0264
Neurite orientation dispersion and density MR imaging: discriminating atypical high-grade glioma from primary central nervous system lymphoma
Eryuan Gao1, Guohua Zhao1, Huiting Zhang2, Peipei Wang1, Xiaoyue MA1, Jie Bai1, Xu Yan2, Guang Yang3, and Jingliang Cheng1
1Department of Magnetic Resonance, the First Affliated Hospital of Zhengzhou University, Zhengzhou, China, 2MR Scientific Marketing, Siemens Healthcare, Shanghai, China, 3Shanghai Key Laboratory of Magnetic Resonance, East China Normal University, Shanghai, China
1Department of Magnetic Resonance, the First Affliated Hospital of Zhengzhou University, Zhengzhou, China, 2MR Scientific Marketing, Siemens Healthcare, Shanghai, China, 3Shanghai Key Laboratory of Magnetic Resonance, East China Normal University, Shanghai, China
Synopsis
Keywords: Tumors, Neuro, atypical high-grade glioma, primary central nervous system lymphoma
Preoperative differentiation of atypical high-grade glioma (HGG) (with no or little necrosis) and primary central nervous system lymphoma (PCNSL) may help to develop treatment plans. However, they share similar appearance in routine MR images. As a new diffusion model, neurite orientation dispersion and density imaging (NODDI) reflects the microstructure of tissue by measuring different components within it. Through quantitative analysis, we found that all parameters of NODDI performed excellent in distinguishing between atypical HGG and PCNSL.Introduction
It’s crucial to differentiate high-grade glioma (HGG) from primary central nervous system lymphoma (PCNSL) before treatment, because their treatment strategies substantially differ. The standard treatment for HGG is surgical resection and then concurrent chemoradiation, whereas that for PCNSL is usually chemotherapy after biopsy [1-3]. Usually, HGG and PCNSL demonstrate different characteristics in routine MR images [4]. However, atypical HGG cases with little or no necrosis exhibit similar characteristics to PCNSL in routine MR images, which increases the difficulty of distinguishing them. The aim of this study was to assess the diagnostic value of quantitative analysis based on neurite orientation dispersion and density (NODDI) in discrimination between atypical HGG and PCNSL.Materials and Methods
The institutional review board approved this prospective study, and informed consent was obtained from every patient. Patients pathologically diagnosed with atypical HGG or PCNSL were enrolled from September 2018 to October 2022. The following inclusion criteria were applied in this study: (1) patients who were diagnosed with HGG or PCNSL pathologically; (2) no obvious necrosis was found within the tumor; (3) no anti-tumor treatment or biopsy were performed before MRI scanning; (4) MR images with no obvious motion artifact; (5) the biopsy or surgery was performed within two weeks after the MRI scanning. Finally, 30 patients with atypical HGG and 25 patients with PCNSL were included. All MR images were acquired using a 3 T MRI scanner (MAGNETOM Prisma; Siemens Healthcare, Erlangen, Germany) with a 64-channel head and neck integrated coil. The sequences employed were shown in Table 1. The multi-b-value DWI data were acquired using 6 b-values (0, 500, 1000, 1500, 2000, and 2500 s/mm2), and every non-zero b value was performed at 30 encoding directions. The CE-T1 MPRAGE images were acquired after administering 0.2 mol/kg body weight of gadopentetate dimeglumine (Magnevist, Bayer Schering Pharma AG, Berlin, Germany) and then reconstructed in axis planes with 20 slices. With an in-house-developed post-processing software, NeuDilab, based on DIPY (http://nipy.org/dipy), the parametric maps of NODDI were calculated, including intracellular volume fraction (ICVF), isotropic volume fraction (ISOVF) and orientation dispersion index (ODI). The region of interest (ROI) was drawn on the axial CE-T1 MPRAGE images using the ITK-SNAP (http://www.itksnap.org) software by the consensus of two radiologists. The ROI was defined as the contrast-enhanced area on the axial CE-T1 MPRAGE images, excluding the large vessels, cysts and necrosis (Figure 1). After delineation, with the ITK-SNAP software, the parametric maps of NODDI were registered to the axial CE-T1 MPRAGE images, and the mean value of ICVF, ISOVF and ODI in the ROI were measured, respectively. All statistical analyses were performed using SPSS 21.0 (SPSS Inc., Chicago, IL, USA). Mann-Whitney U test was use to compared the difference in the mean value of ICVF, ISOVF and ODI between the two groups, and a P<0.05 was considered statistically significant. Receiver operating characteristic (ROC) analysis were conducted and the areas under the curve (AUCs) were measured to evaluate the diagnostic efficiency of the parameters with significant difference.Results
As shown in Table 2, the mean values of NODDI parameters, ICVF, ISOVF and ODI, in atypical HGG group are significantly lower than those in PCNSL group (P<0.05). ODI showed the best diagnostic performance (AUC=0.963), ICVF showed good performance (AUC=0.855), and ISOVF was the worst (AUC=0.664), as shown in Table 3 and Figure 2.Discussion
In this study, we assessed the value of NODDI in differentiating between atypical HGG and PCNSL. Our results showed that the NODDI model was useful in discriminating atypical HGG from PCNSL. Among the three parameters from NODDI, ODI showed the best diagnostic performance. According to the guideline and previous studies, PCNSL has better homogeneity in terms of size and morphology on tumor cells and nucleus relative to HGGs in pathology, which was verified by our results with higher ODI in PCNSL [5, 6]. Pang et. al [5, 6] showed lower FA in PCNSL compared with HGGs using DKI method. ODI reflects the orientation dispersion index of tissue, which has the opposite trend of FA. The more homogeneous the tissue structure, the higher the ODI. The higher ICVF of PCNSL than atypical HGG, is in accordance with the result of Pang et al [5, 6]. In his study, the MD value obtained in the enhancing area of PCNSL was significantly lower than that of HGG. The diffusivity of water was mainly affected by the extracellular spaces rather than the intracellular spaces. Pang’s results demonstrated thar the extracellular space of PCNSL is significantly smaller than that of HGG, in other words, intracellular space accounts for a larger proportion in PCNSL than HGG. We also found that the ISOVF of PCNSL were significantly higher than those of atypical HGG, which meant that the water diffusivity was more isotropy in PCNSL than that in atypical HGG. This is also in accordance with the results of Pang et al (the lower FA in PCNSL) [5, 6]. In his study, the FA of PCNSL was also found significantly lower than that of HGG, which meant that the water diffusivity was more isotropy in PCNSL than that in HGG.Conclusion
In conclusion, NODDI parameters have excellent performance in distinguishing between atypical HGG and PCNSL.Acknowledgements
No acknowledgement found.References
[1] Schlegel U. Primary CNS lymphoma. Ther Adv Neurol Disord. 2009; 2:93–104 [2] Stupp R, Mason WP, van den Bent MJ et al. Radiotherapy plus concomitant and adjuvant temozolomide for glioblastoma. N Engl J Med. 2005; 352:987–996. [3] Kickingereder P, Wiestler B, Sahm F et al. Primary central nervous system lymphoma and atypical glioblastoma: multiparametric differentiation by using diffusion-, perfusion-, and susceptibilityweighted MR imaging. Radiology. 2014;272:843–850. [4] Haldorsen IS, Espeland A, Larsson EM. Central nervous system lymphoma: characteristic findings on traditional and advanced imaging. AJNR Am J Neuroradiol. 2011;32:984–992. [5] Pang H, Ren Y, Dang X, et al. Diffusional kurtosis imaging for differentiating between high-grade glioma and primary central nervous system lymphoma. J Magn Reson Imaging. 2016;44(1):30-40. [6] Pang H, Dang X, Yan R, et al. Diffusion kurtosis imaging differs between primary central nervous system lymphoma and high-grade glioma and is correlated with the diverse nuclear-to-cytoplasmic ratio: a histopathologic, biopsy-based study. Eur Radiol. 2020;30(4):2125-2137.Figures
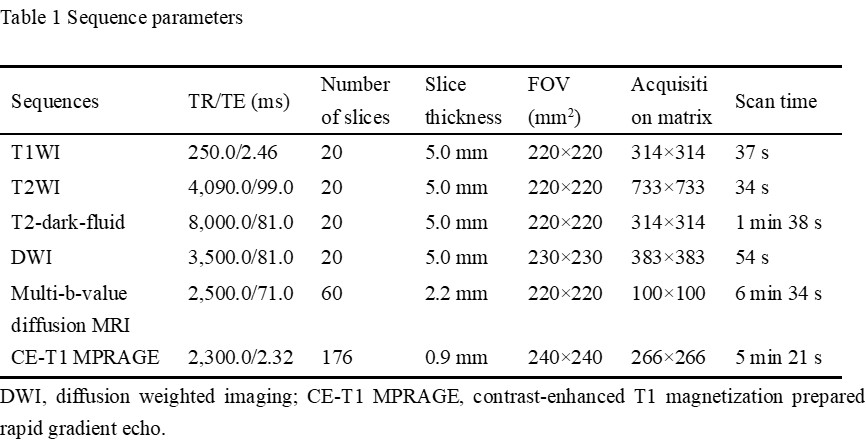
Table
1 Sequence parameters.
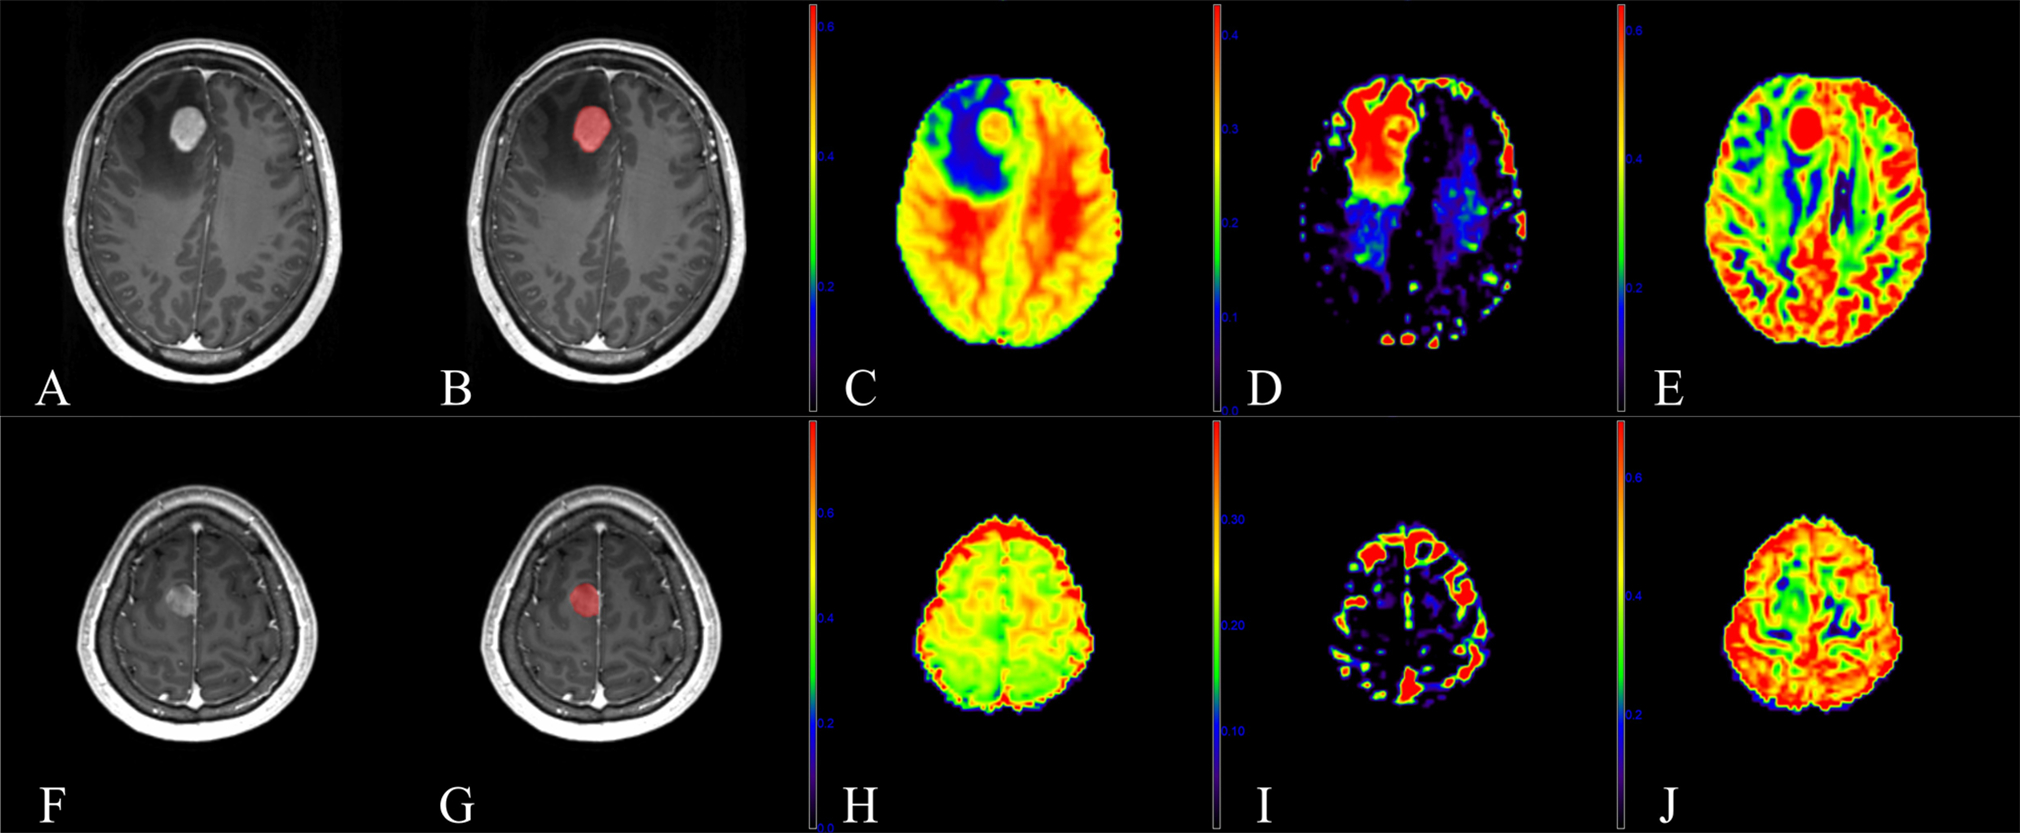
Fig.
1. A 59-year-old female with primary central nervous
system lymphoma (PCNSL) in the right frontal lobe (A-E) and a 46-year-old
female with atypical high-grade glioma (HGG) in the right frontal lobe (F-J). (A,
F): Contrast-enhanced T1 magnetization prepared rapid gradient echo (CE-T1
MPRAGE) images. (B, G): Region of interest (ROI) (contrast-enhanced area) in
the CE-T1 MPRAGE images. (C, H): Parametric maps of intracellular volume fraction
(ICVF). (D, I): Parametric maps of isotropic volume fraction (ISOVF). (E, J): Parametric
maps of and orientation dispersion index (ODI).
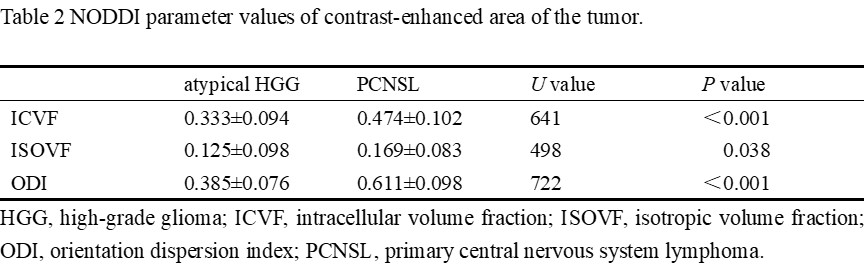
Table
2 NODDI parameter values of contrast-enhanced area of the tumor.
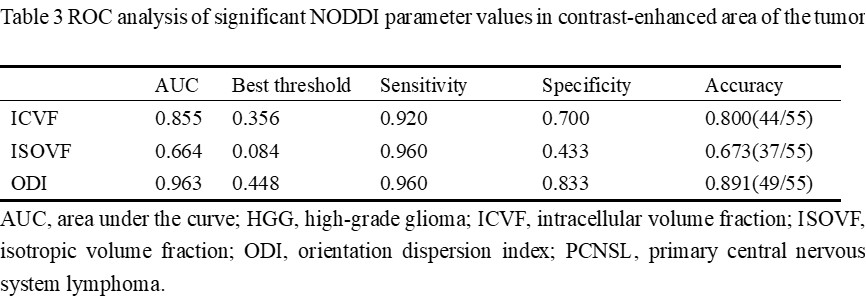
Table
3 ROC analysis of significant NODDI parameter values in contrast-enhanced area
of the tumor.
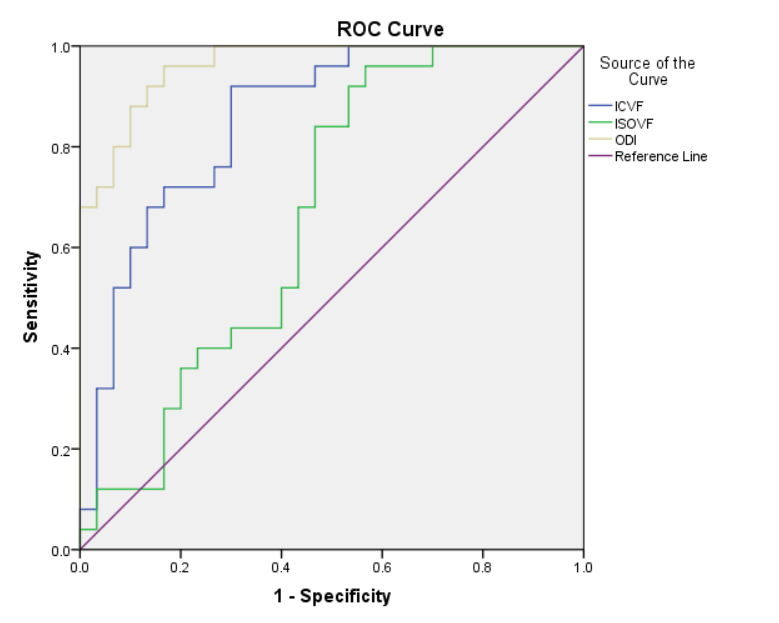
Fig
2. ROC curves of significant NODDI parameter values in differentiating atypical
HGG and PCNSL.
DOI: https://doi.org/10.58530/2023/0264