0261
Fixel-based and tensor analysis of tractography-reconstructed anterior optic pathway in patients with sellar/parasellar tumor1Department of Biomedical and Neuromotor Sciences, University of Bologna, Bologna, Italy, 2IRCCS Istituto delle Scienze Neurologiche di Bologna, Bologna, Italy, 3Department of Physics and Astronomy, University of Bologna, Bologna, Italy
Synopsis
Keywords: Tumors, Tractography & Fibre Modelling, Anterior Optic Pathway
Tumors of the sellar/paraellar region are likely to displace the optic chiasm, making it valuable to study the entire course and microstructural properties of the anterior optic pathway (AOP, including optic nerves, chiasm and optic tracts). We present the first fully automated tractography pipeline to entirely reconstruct the AOP. The pipeline was applied on a group of patients with sellar/parasellar tumors displacing the chiasm, achieving excellent reliability. We also estimated mean diffusivity, fractional anisotropy and fiber density along the AOP, demonstrating alterations in patients compared to controls, which we explain based on chiasmal compression.Introduction
Using conventional brain MRI sequences, the anatomical visualization of the anterior optic pathway (AOP, including optic tracts, chiasm and nerves) is challenging, especially in case of neoplasms of the sellar/parasellar regions that can cause extrinsic compression of the chiasm. The possibility of using diffusion tensor tractography to track the trajectory of the AOP in vivo allows improvements in pre-surgical planning1 and investigation of microstructural integrity2, potentially improving clinical outcomes.Methods
Twenty-seven patients (13 F, age=53.3±16.4y) with occupying lesions of the sella turcica/parasellar region with evidence of chiasmal compression were included in this study. Thirty-eight healthy volunteers (18 F, age=43.0±16.5y) were also recruited. All participants underwent a brain MRI protocol on a 3-T Siemens Skyra scanner, including a multishell diffusion weighted (DW) imaging protocol (TR/TE=4300/98; 2mm3 isotropic voxel), composed of n=8 volumes acquired with anterior-posterior (AP) and posterior-anterior (PA) phase encoding directions at b=0s/mm2, n=12 AP/PA at b=300s/mm2, n=30 AP/PA at b=1000s/mm2, n=64 AP at b=2000s/mm2; 12min total duration.A fully automated preprocessing3 and probabilistic tractography pipeline to reconstruct the whole AOP was developed in-house using functions of MRtrix 3.0.2 and FSL 6. DW images were skull-stripped, denoised, and corrected for susceptibility artifacts, eddy-currents, and signal dropouts. The response function for spherical deconvolution was modelled using the Dhollander algorithm. Fiber orientation distributions were estimated using multishell-multitissue spherical deconvolution. Probabilistic tractography of the AOP was performed using the iFOD1 approach4.
Seed and inclusion regions of interest (ROIs) to generate and select streamlines were manually defined by an expert neuroradiologist on the MNI152 standard space over the orbit, chiasm and lateral geniculate nucleus (LGN). An exclusion ROI was also created (see Fig. 1). ROIs were registered to the single-subject DWI space and an algorithm was developed to automatically recognize cases where the chiasm ROI resulted within the tumor and thus re-define it. The ratio between the mean intensity µ of the structural T1-weighted image inside the chiasm ROI and its standard deviation σ was computed in each subject to obtain an empirical threshold to discriminate whether the ROI was registered inside the tumor or included other tissues. Hollow boxes with increasing external radius (range 6-20mm) and thickness 6mm centered in the original chiasm ROI were generated until the µ/σ ratio returned below threshold. The so-defined region was set as the new inclusion ROI (Fig. 2).
Tractography was performed with cut-off fractional anisotropy (FA) value of 0.005 by seeding up to 5000000 streamlines both from LGN to orbit and vice-versa, then merging them. The tracks were separately generated for crossing and non-crossing fibers per hemisphere and cut to 2000 streamlines maximum. The tracks were transformed to NIFTI, thresholded at 10% and used to mask-back the tracks. Minimum streamline length was set equal to their average (prior to masking) minus 5σ.
Mean diffusivity (MD) and FA maps were computed from the diffusion tensor. Fixel-based analysis was performed to derive a fiber density (FD) map5,6. Each streamline was resampled to 30 points (segment 1-12 corresponding to optic tract, 13-17 chiasm, 18-30 optic nerve) and values of FA, MD and FD were calculated at those locations (Fig. 4). For each track, the median value at every segment was calculated, then points at corresponding locations were averaged between tracks, weighting by the number of streamlines. Thus, for each patient and segment, we obtained a single estimate of the microstructural parameters in the chiasm and a bilateral value in the optic tract and nerve.
Outliers were removed. A Shapiro-Wilk test was run to test the normality of the distribution of the parameters, then an unpaired t-test was performed to compare along-tract the microstructural parameters between patients and controls. Statistical significance was set at p<0.05, FDR-corrected for multiple comparisons.
Results
The AOP was successfully reconstructed in all subjects. Upon visual inspection during surgery in 13 patients, all but two (84.6%) presented correct correspondence with the entire course of the tractography.FD and FA were significantly lower bilaterally in patients along most of the optic tract and partially along the optic nerve, whereas they were higher in the posterior portion of the chiasm. Instead, MD was significantly increased in the bilateral optic tract of patients and decreased in the chiasm. All results are summarized in Fig. 5.
Discussion
This is the first fully automated pipeline to completely reconstruct the AOP, even in presence of a displaced chiasm, that received a direct confirmation upon visual examination during surgery.The higher FD values in the optic chiasm found in patients can be explained by the physical compression caused by the nearby tumor that compacts the structure, which is coherent with higher FA and lower MD. This results in increased axonal density in each voxel and FD values were demonstrated to be higher in regions with high axonal density7,8. This interpretation is further supported by the inverse direction of the difference in microstructural parameters between patients and controls along the optic tract and nerve, which are not compressed, yet pathological.
Conclusions
We presented an automated tractography pipeline able to reliably reconstruct the entire course of the AOP in patients with sellar/parasellar tumors. Additionally, we found altered microstructural parameters along most of the tract, consistent with chiasmal compression.Acknowledgements
No acknowledgement found.References
1. Jacquesson T, Frindel C, Kocevar G, Berhouma M, Jouanneau E, Attyé A, Cotton F. Overcoming Challenges of Cranial Nerve Tractography: A Targeted Review. Neurosurgery. 2019 Feb 1;84(2):313-325. doi: 10.1093/neuros/nyy229
2. Paul DA, Gaffin-Cahn E, Hintz EB, Adeclat GJ, Zhu T, Williams ZR, Vates GE, Mahon BZ. White matter changes linked to visual recovery after nerve decompression. Sci Transl Med. 2014 Dec 10;6(266):266ra173. doi: 10.1126/scitranslmed.3010798
3. Manners DN, Gramegna LL, La Morgia C, Sighinolfi G, Fiscone C, Carbonelli M, Romagnoli M, Carelli V, Tonon C, Lodi R. Multishell Diffusion MR Tractography Yields Morphological and Microstructural Information of the Anterior Optic Pathway: A Proof-of-Concept Study in Patients with Leber's Hereditary Optic Neuropathy. Int J Environ Res Public Health. 2022 Jun 5;19(11):6914. doi: 10.3390/ijerph19116914
4. He J, Zhang F, Xie G, Yao S, Feng Y, Bastos DCA, Rathi Y, Makris N, Kikinis R, Golby AJ, O'Donnell LJ. Comparison of multiple tractography methods for reconstruction of the retinogeniculate visual pathway using diffusion MRI. Hum Brain Mapp. 2021, 15, 42(12):3887-3904. doi: 10.1002/hbm.25472
5. Dhollander T, Clemente A, Singh M, Boonstra F, Civier O, Duque JD, Egorova N, Enticott P, Fuelscher I, Gajamange S, Genc S, Gottlieb E, Hyde C, Imms P, Kelly C, Kirkovski M, Kolbe S, Liang X, Malhotra A, Mito R, Poudel G, Silk TJ, Vaughan DN, Zanin J, Raffelt D, Caeyenberghs K. Fixel-based Analysis of Diffusion MRI: Methods, Applications, Challenges and Opportunities. Neuroimage. 2021 Nov 1;241:118417. doi: 10.1016/j.neuroimage.2021.118417
6. Fekonja LS, Wang Z, Aydogan DB, Roine T, Engelhardt M, Dreyer FR, Vajkoczy P, Picht T. Detecting Corticospinal Tract Impairment in Tumor Patients With Fiber Density and Tensor-Based Metrics. Front Oncol. 2021 Jan 27;10:622358. doi: 10.3389/fonc.2020.622358
7. Rojas-Vite G, Coronado-Leija R, Narvaez-Delgado O, Ramírez-Manzanares A, Marroquín JL, Noguez-Imm R, Aranda ML, Scherrer B, Larriva-Sahd J, Concha L. Histological validation of per-bundle water diffusion metrics within a region of fiber crossing following axonal degeneration. Neuroimage. 2019 Nov 1;201:116013. doi: 10.1016/j.neuroimage.2019.116013
8. Narvaez-Delgado O, Rojas-Vite G, Coronado-Leija R, Ramírez-Manzanares A, Marroquín JL, Noguez-Imm R, Aranda ML, Scherrer B, Larriva-Sahd J, Concha L. Histological and diffusion-weighted magnetic resonance imaging data from normal and degenerated optic nerve and chiasm of the rat. Data Brief. 2019 Aug 15;26:104399. doi: 10.1016/j.dib.2019.104399
Figures
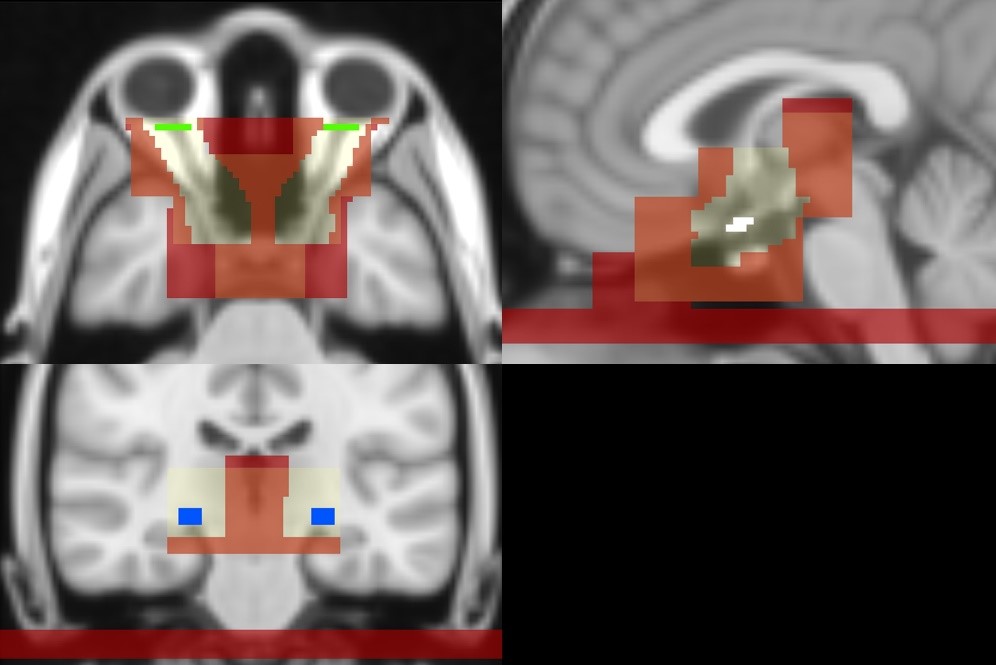
Fig. 1: ROIs defined on the MNI 152 for streamline seeding and selection of the anterior optic pathway. Light yellow: admitted region mask; red: exclusion mask; green: orbit (seed/inclusion ROI); white: chiasm (inclusion ROI); blue: lateral geniculate nucleus (LGN, inclusion/seed ROI). Orbit and LGN ROIs were iteratively defined as seed or inclusion ROIs basing on the direction of tractography.
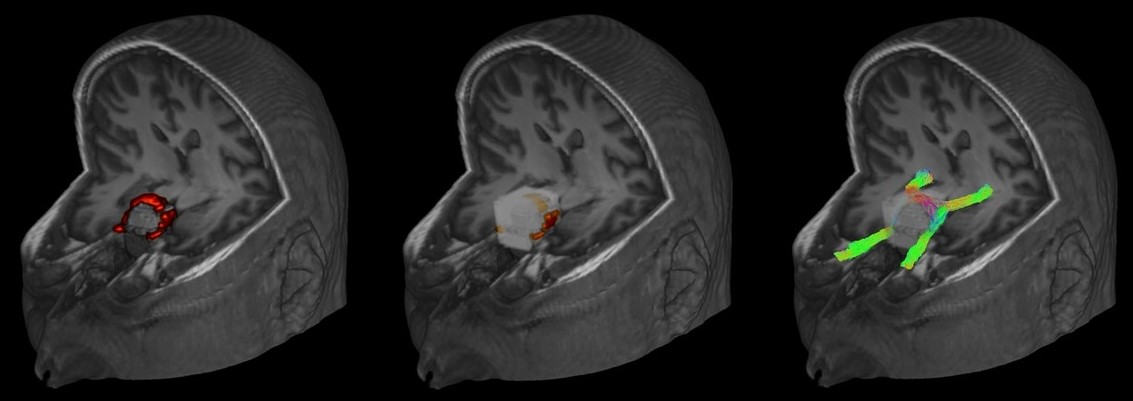
Fig. 2: Example of chiasm (highlighted in red) highly displaced by tumor (left). The inclusion ROI of the optic chiasm was automatically deformed into a hollow box with radius 16mm, thickness 6mm (in white) which includes portions of the dislocated chiasm (center). As we cannot know a priori the position of the dislocated chiasm, the box wraps the entire tumor. The other constraints ensure the correct tract of interest is reconstructed. Tractography result in this patient are shown (right).
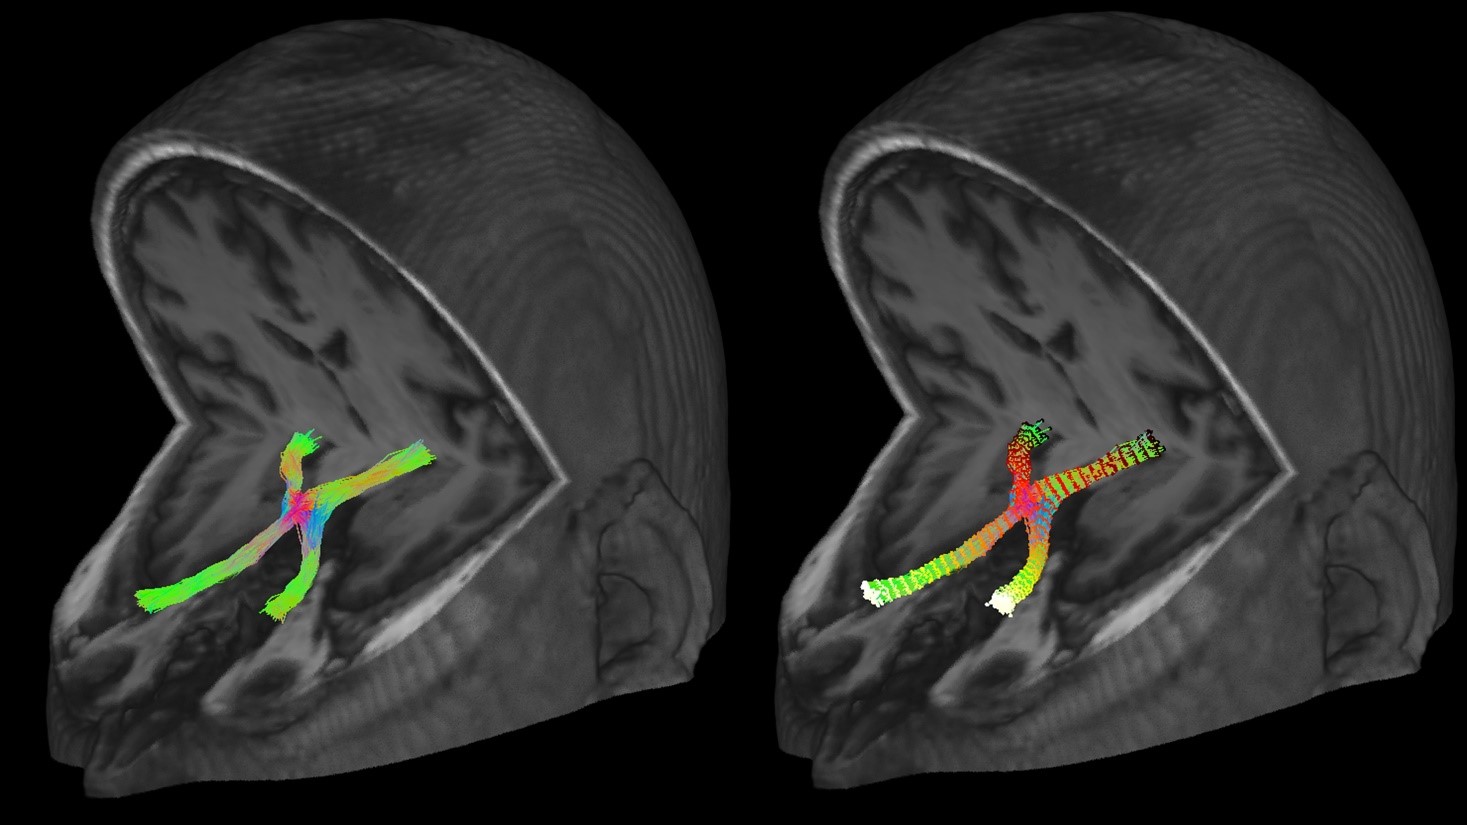
Fig. 3: Example of the reconstruction of the complete course of the anterior optic pathway in a patient, where the colors represent the direction of streamlines (left), and the estimated 30 resampling locations, identified by the black-white color gradient, where the microstructural parameters were calculated (right).
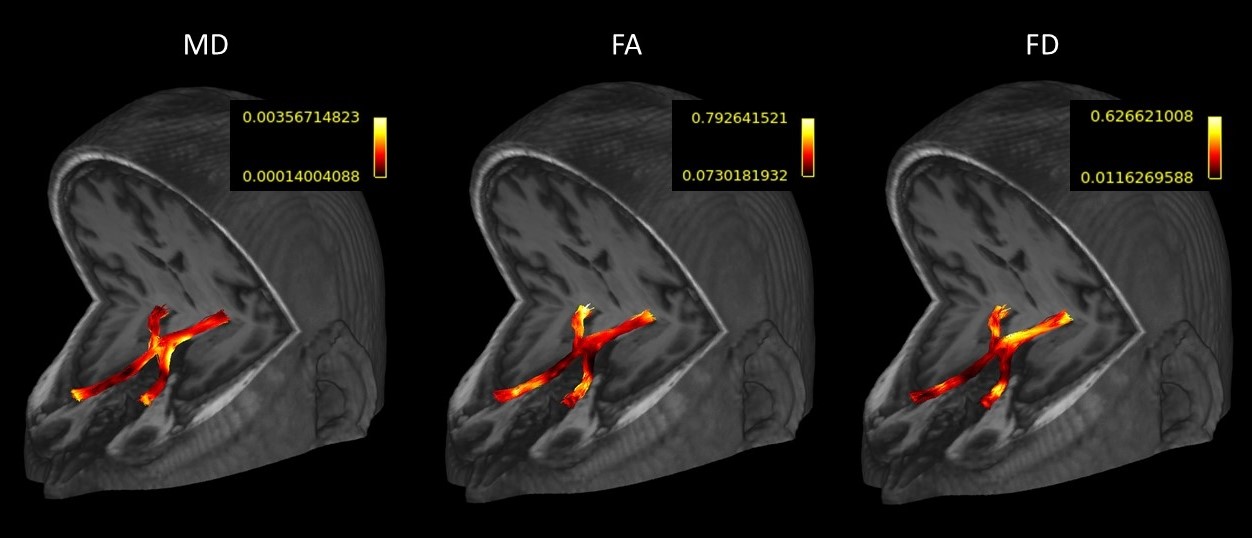
Fig. 4: Example of the microstructural parameters (MD=mean diffusivity, FA=fractional anisotropy, FD=fiber density) evaluated along the anterior optic pathway of a patient. The parameters are initially calculated at every resampling point of each streamline.
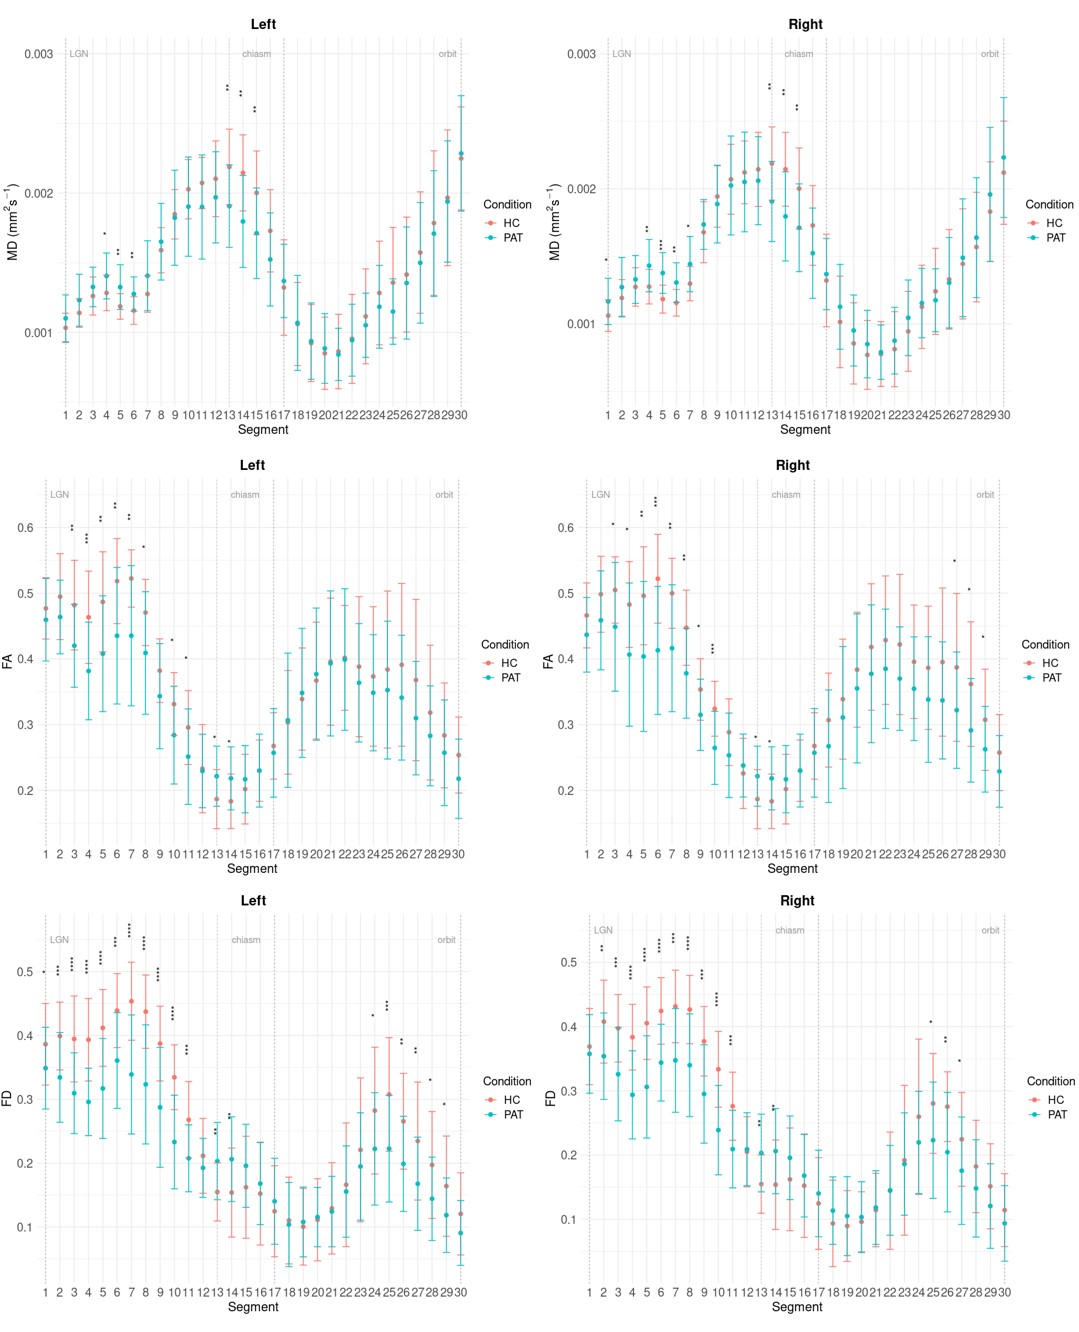
Fig. 5: Along-tract comparison of the microstructural parameters between patients and controls. Fractional anisotropy (FA) and fiber density (FD) are significantly lower in patients along the optic tract and nerve and higher in the chiasm; mean diffusivity (MD) is significantly higher in patients’ optic tract and lower in the chiasm. * = adjusted p < 0.05; ** = adjusted p <0.01; *** = adjusted p<0.001; **** = adjusted p<0.0001.