0259
Deuterium metabolic imaging distinguishes metabolic subtypes and detects early treatment response to current standard of care in glioblastoma1CRUK Cambridge Institute, Cambridge, United Kingdom
Synopsis
Keywords: Tumors, Deuterium
The potential for DMI measurements of deuterated glucose metabolism to differentiate between metabolic subtypes in GBM has been demonstrated in patient-derived xenografts in mice. The glycolytic subtype showed increased lactate labelling whereas two oxidative subtypes showed increased glutamate/glutamine (Glx) labelling. There was decreased lactate labelling in a glycolytic subtype and decreased lactate and Glx labelling in an oxidative subtype within 24 h after the completion of standard-of-care chemoradiotherapy, demonstrating that the technique can also be used to detect early treatment response in this tumor type.
Introduction
Glioblastoma (GBM) is the most aggressive primary brain malignancy in adults with a median survival of 14.6 months following standard-of-care treatment, which consists of surgical debulking followed by chemoradiotherapy.1 GBM has been shown to display oxidative and glycolytic metabolic subtypes of GBM, which may offer important therapeutic targets.2 However, currently a diagnosis of GBM does not include metabolic characterisation or subtyping.3Deuterium metabolic imaging (DMI) has emerged recently as a powerful metabolic imaging technique that can be used to probe metabolism in patients.4 Here we have used DMI measurements of [6,6’-2H2]glucose metabolism in orthotopically implanted patient-derived GBM xenografts (PDX) in mice to explore the potential of the technique for distinguishing between metabolic subtypes and for detecting early responses to standard-of-care treatment.Methods
In vitroThree primary human GBM cell lines were characterized using a Seahorse Bioscience XF 96 analyzer (Agilent Technologies, Santa Clara). Baseline oxygen consumption rate (OCR) measurements, a reflection of mitochondrial activity, and extracellular acidification rate (ECAR) measurements, a reflection of glycolytic activity, were made. Mitochondrial activity was further assessed using the Mitostress assay (Agilent Technologies, Santa Clara). Representatives of the glycolytic (A11) and oxidative (S2 & AT5) subtypes were identified and subsequently seeded in T25 flasks at a density of 1 x 10⁶ cells, These cells were cultured for five days and then incubated with 13 mM D-[6,6’-2H2]glucose (Sigma Aldrich, St. Louis) for 4 hours, after which extracellular media samples were taken for 2H MRS measurements of 2H-labelled metabolites. Spectra were acquired at 14.1T (Bruker, Billerica) and 300K using the2H coil of a 5 mm proton/broadband inverse detection probe. A 90 degree pulse and 2 second repetition time were used and the spectra were the sum of 1024 transients collected over 62 minutes with a spectral width of 2000 Hz.
In vivo
Female athymic BALB/c nude mice (Charles River, Germany) underwent stereotactic intracranial implantation with 1.5 x 10⁶ A11 (n=5), S2 (n=7) and AT5 (n=6) cells. When tumors had grown to >5mm3, 2H MR spectra were acquired using a 7T spectrometer (Agilent, Palo Alto) with a custom built 14-mm diameter 2H transmit-receive surface coil and a 1H volume transmit receive coil (Rapid Biomedical, Rimpar). A baseline 2H spectrum was obtained prior to intravenous administration of 2g/kg D-[6,6’-2H2]glucose (Sigma Aldrich, St. Louis) dissolved in saline. Sequential coil-localised 2H spectra were acquired with a 2003 Hz spectral width into 256 spectral points over a period of 65 mins using a 2 ms BIR4 pulse with a nominal flip angle of 50°, TR of 140 ms and 2250 averages. The animals then underwent a 4-day regime of oral temozolomide (100 mg/kg/day) and 5Gy/day of targeted radiation delivered via a SARRP device (Xstrahl, UK). Post-treatment 2H spectra were acquired within 24 hours of the last day of treatment.
Results
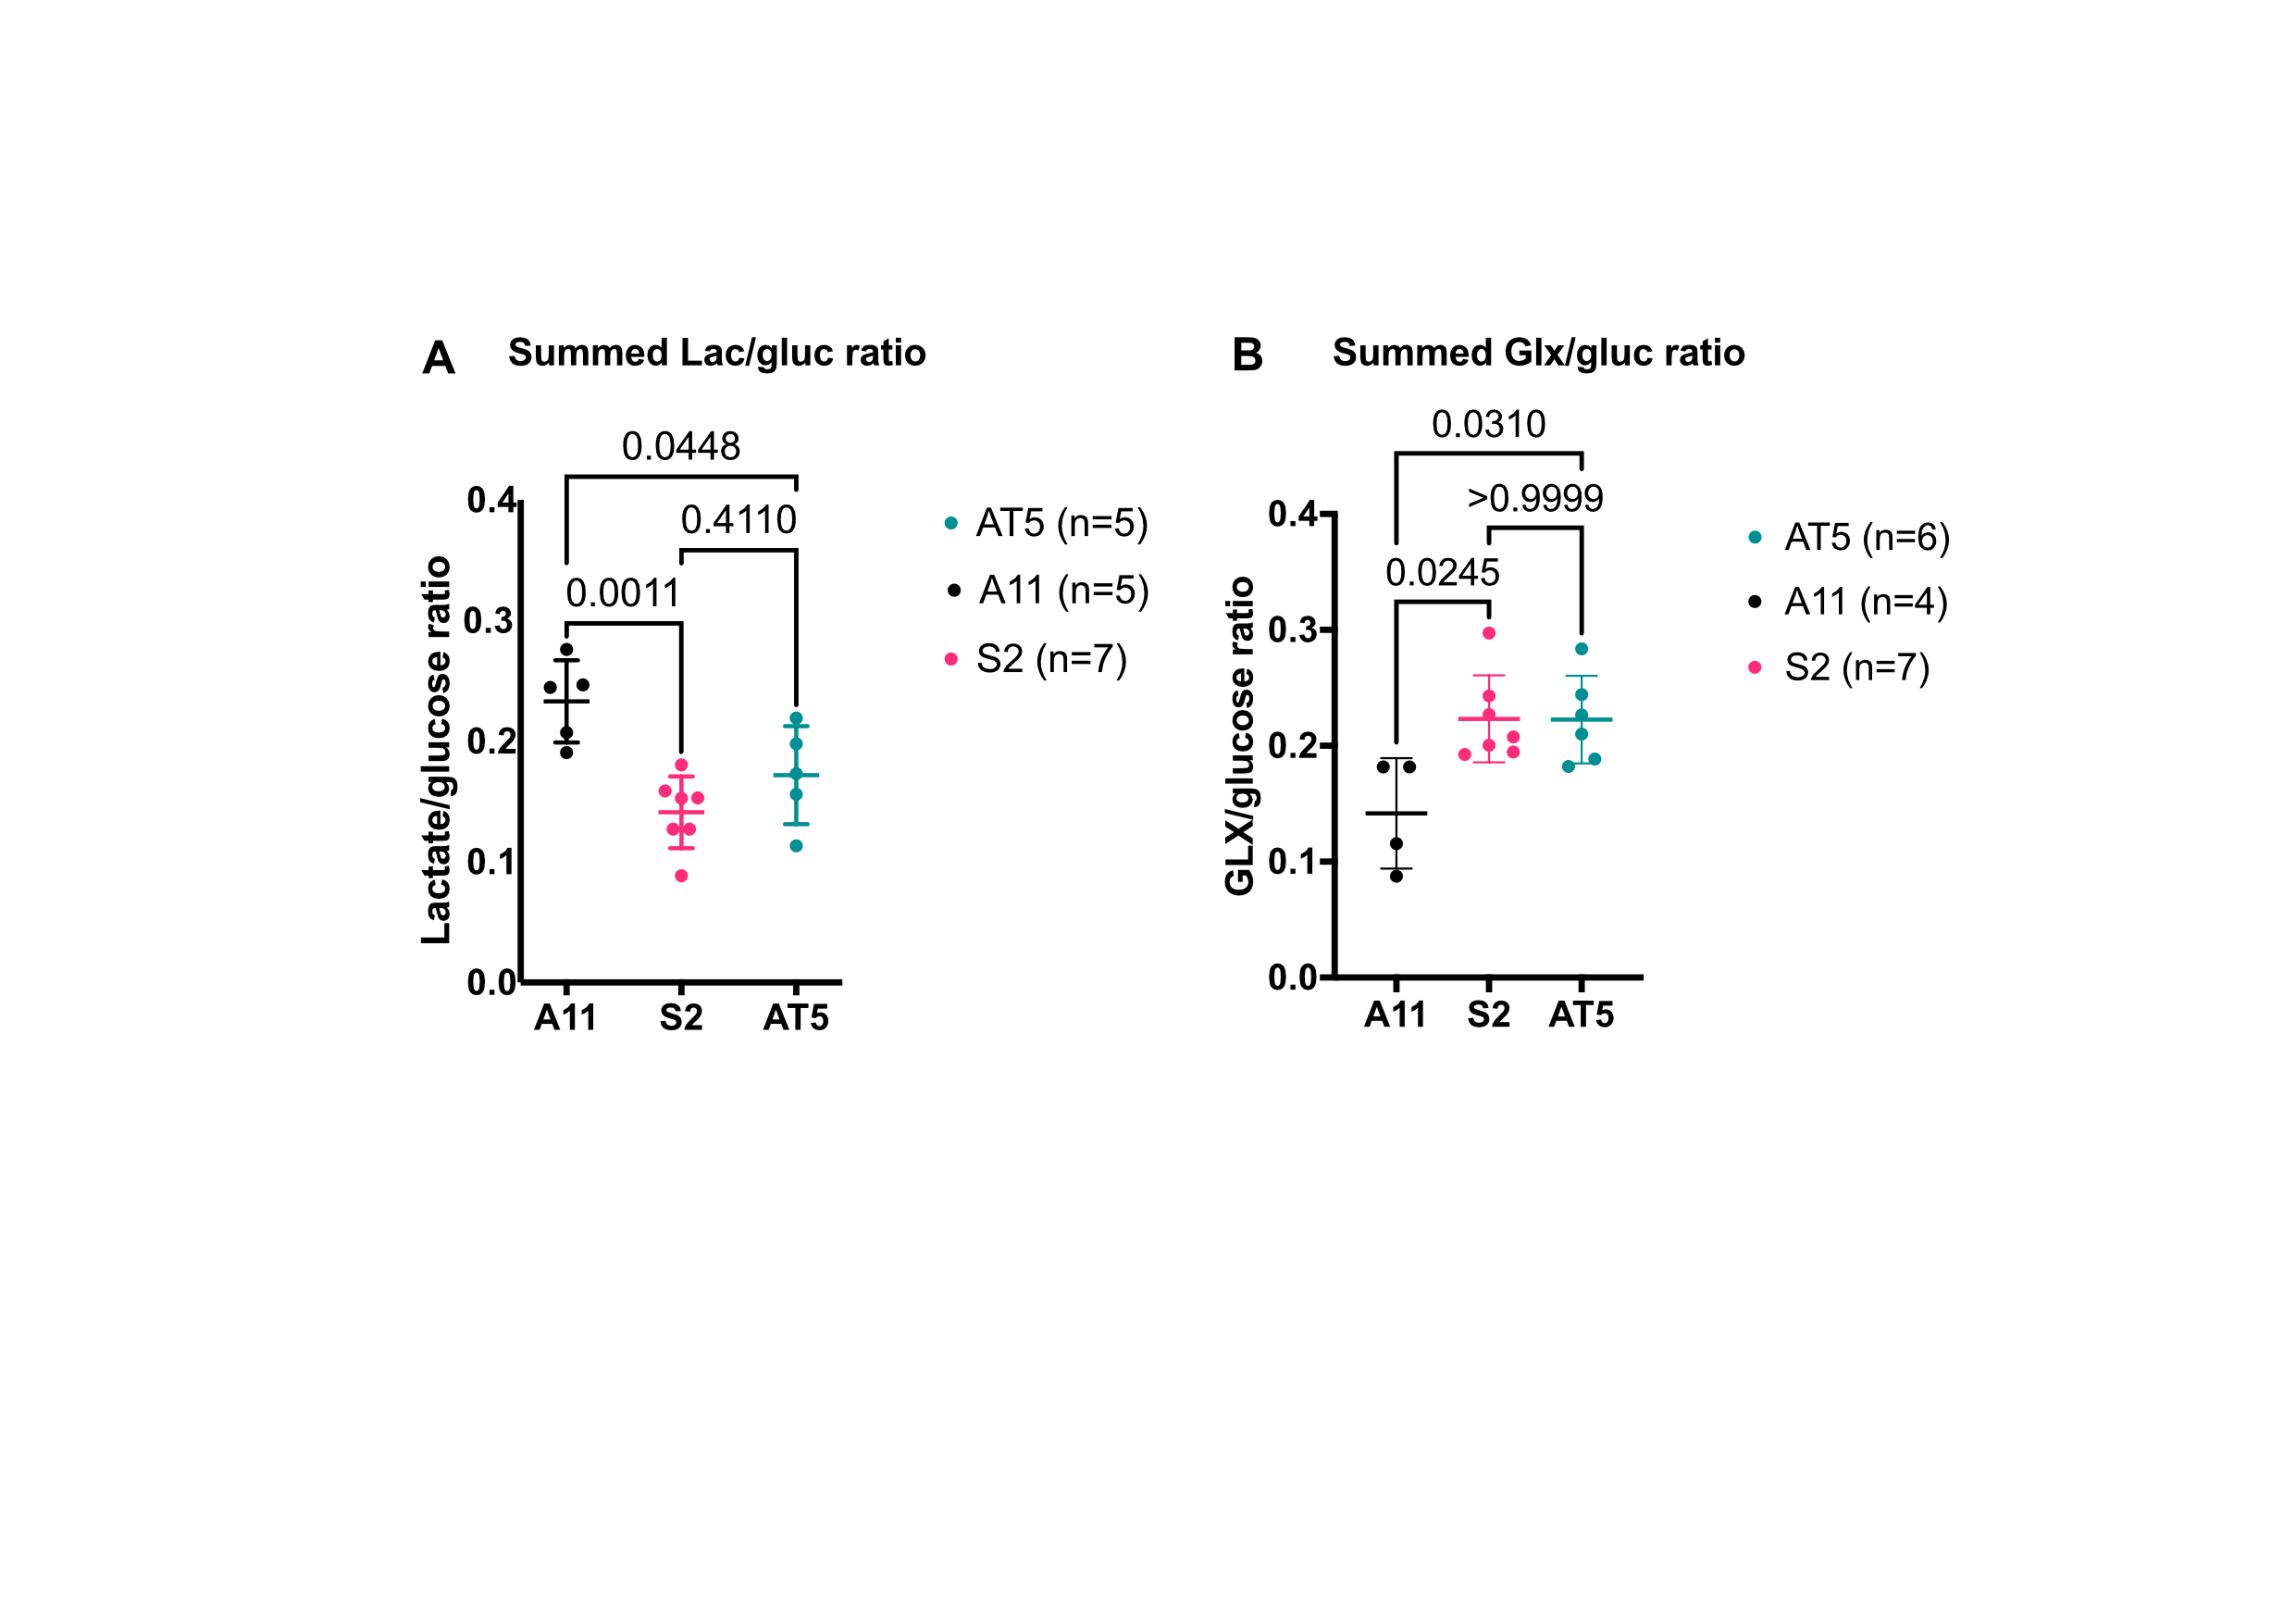
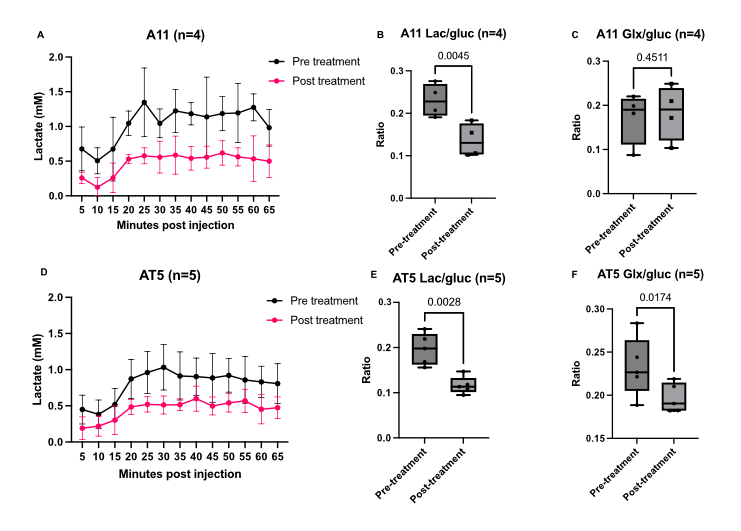
Seahorse analysis and 2H NMR spectroscopy measurements on extracellular media samples showed that A11 cells exhibited a glycolytic phenotype, with the highest ECAR and rate of lactate production, whereas S2 and AT5 cells exhibited an oxidative phenotype with higher OCRs and lower rates of lactate production when compared to A11 cells (Figure 1.) Although when implanted as orthotopic tumors all three lines showed the same concentration of intratumoral deuterated glucose, there were varying rates of production of 2H-labelled glutamate/glutamine (Glx) (a surrogate for TCA cycle activity) and lactate. The lactate/glucose ratio was significantly higher in A11 tumors (A11 vs S2, p=0.0011, A11 vs AT5 p=0.0448) (Figure 3.). The lactate/glucose ratios were not significantly different between the two oxidative tumor models (S2 vs AT5, p=0.4110). The Glx/glucose ratios were significantly higher in the oxidative tumor models when compared to A11 (S2 vs A11, p=0.0245, AT5 vs A11, p=0.0310), and were not significantly different between the two oxidative tumor models (S2 vs AT5, p=>0.9999).Following standard-of-care treatment the lactate/glucose ratio in A11 tumors (n=4) was reduced (p=0.0045) but there was no change in the Glx/glucose ratio (p=0.4511) (Figure 4.). In AT5 tumors (n=5) there was a reduction in both the lactate/glucose (p=0.0028) and Glx/glucose ratios (p=0.0174).
Discussion
Current imaging techniques in the clinic, CT and MRI, remain the primary tools used to diagnose GBM and to monitor treatment response. As metabolic subtypes of GBM may be associated with a different prognosis and treatment sensitivity, novel imaging techniques are required to robustly identify these metabolic subtypes. Here we have demonstrated the potential of DMI to differentiate glycolytic oxidative GBM subtypes in PDX models and that DMI measurements of glucose metabolism can detect treatment response within 24 hours of completion of chemoradiotherapy.Conclusion
Deuterium metabolic imaging of deuterated glucose metabolism has the potential to differentiate between metabolic subtypes of GBM in vivo and can detect treatment response within 24 hours of completion of current standard-of-care chemoradiotherapy.Acknowledgements
No acknowledgement found.References
1. Stupp, R. et al. Radiotherapy plus Concomitant and Adjuvant Temozolomide for Glioblastoma. New England Journal of Medicine 352, 987–996 (2005).
2. Garofano, L. et al. Pathway-based classification of glioblastoma uncovers a mitochondrial subtype with therapeutic vulnerabilities. Nature Cancer 2020 2:2 2, 141–156 (2021).
3. Louis, D. N. et al. The 2021 WHO Classification of Tumors of the Central Nervous System: a summary. Neuro Oncol23, 1231–1251 (2021).
4. de Feyter, H. M. et al. Deuterium metabolic imaging (DMI) for MRI-based 3D mapping of metabolism in vivo. Sci Adv4, (2018).
Figures
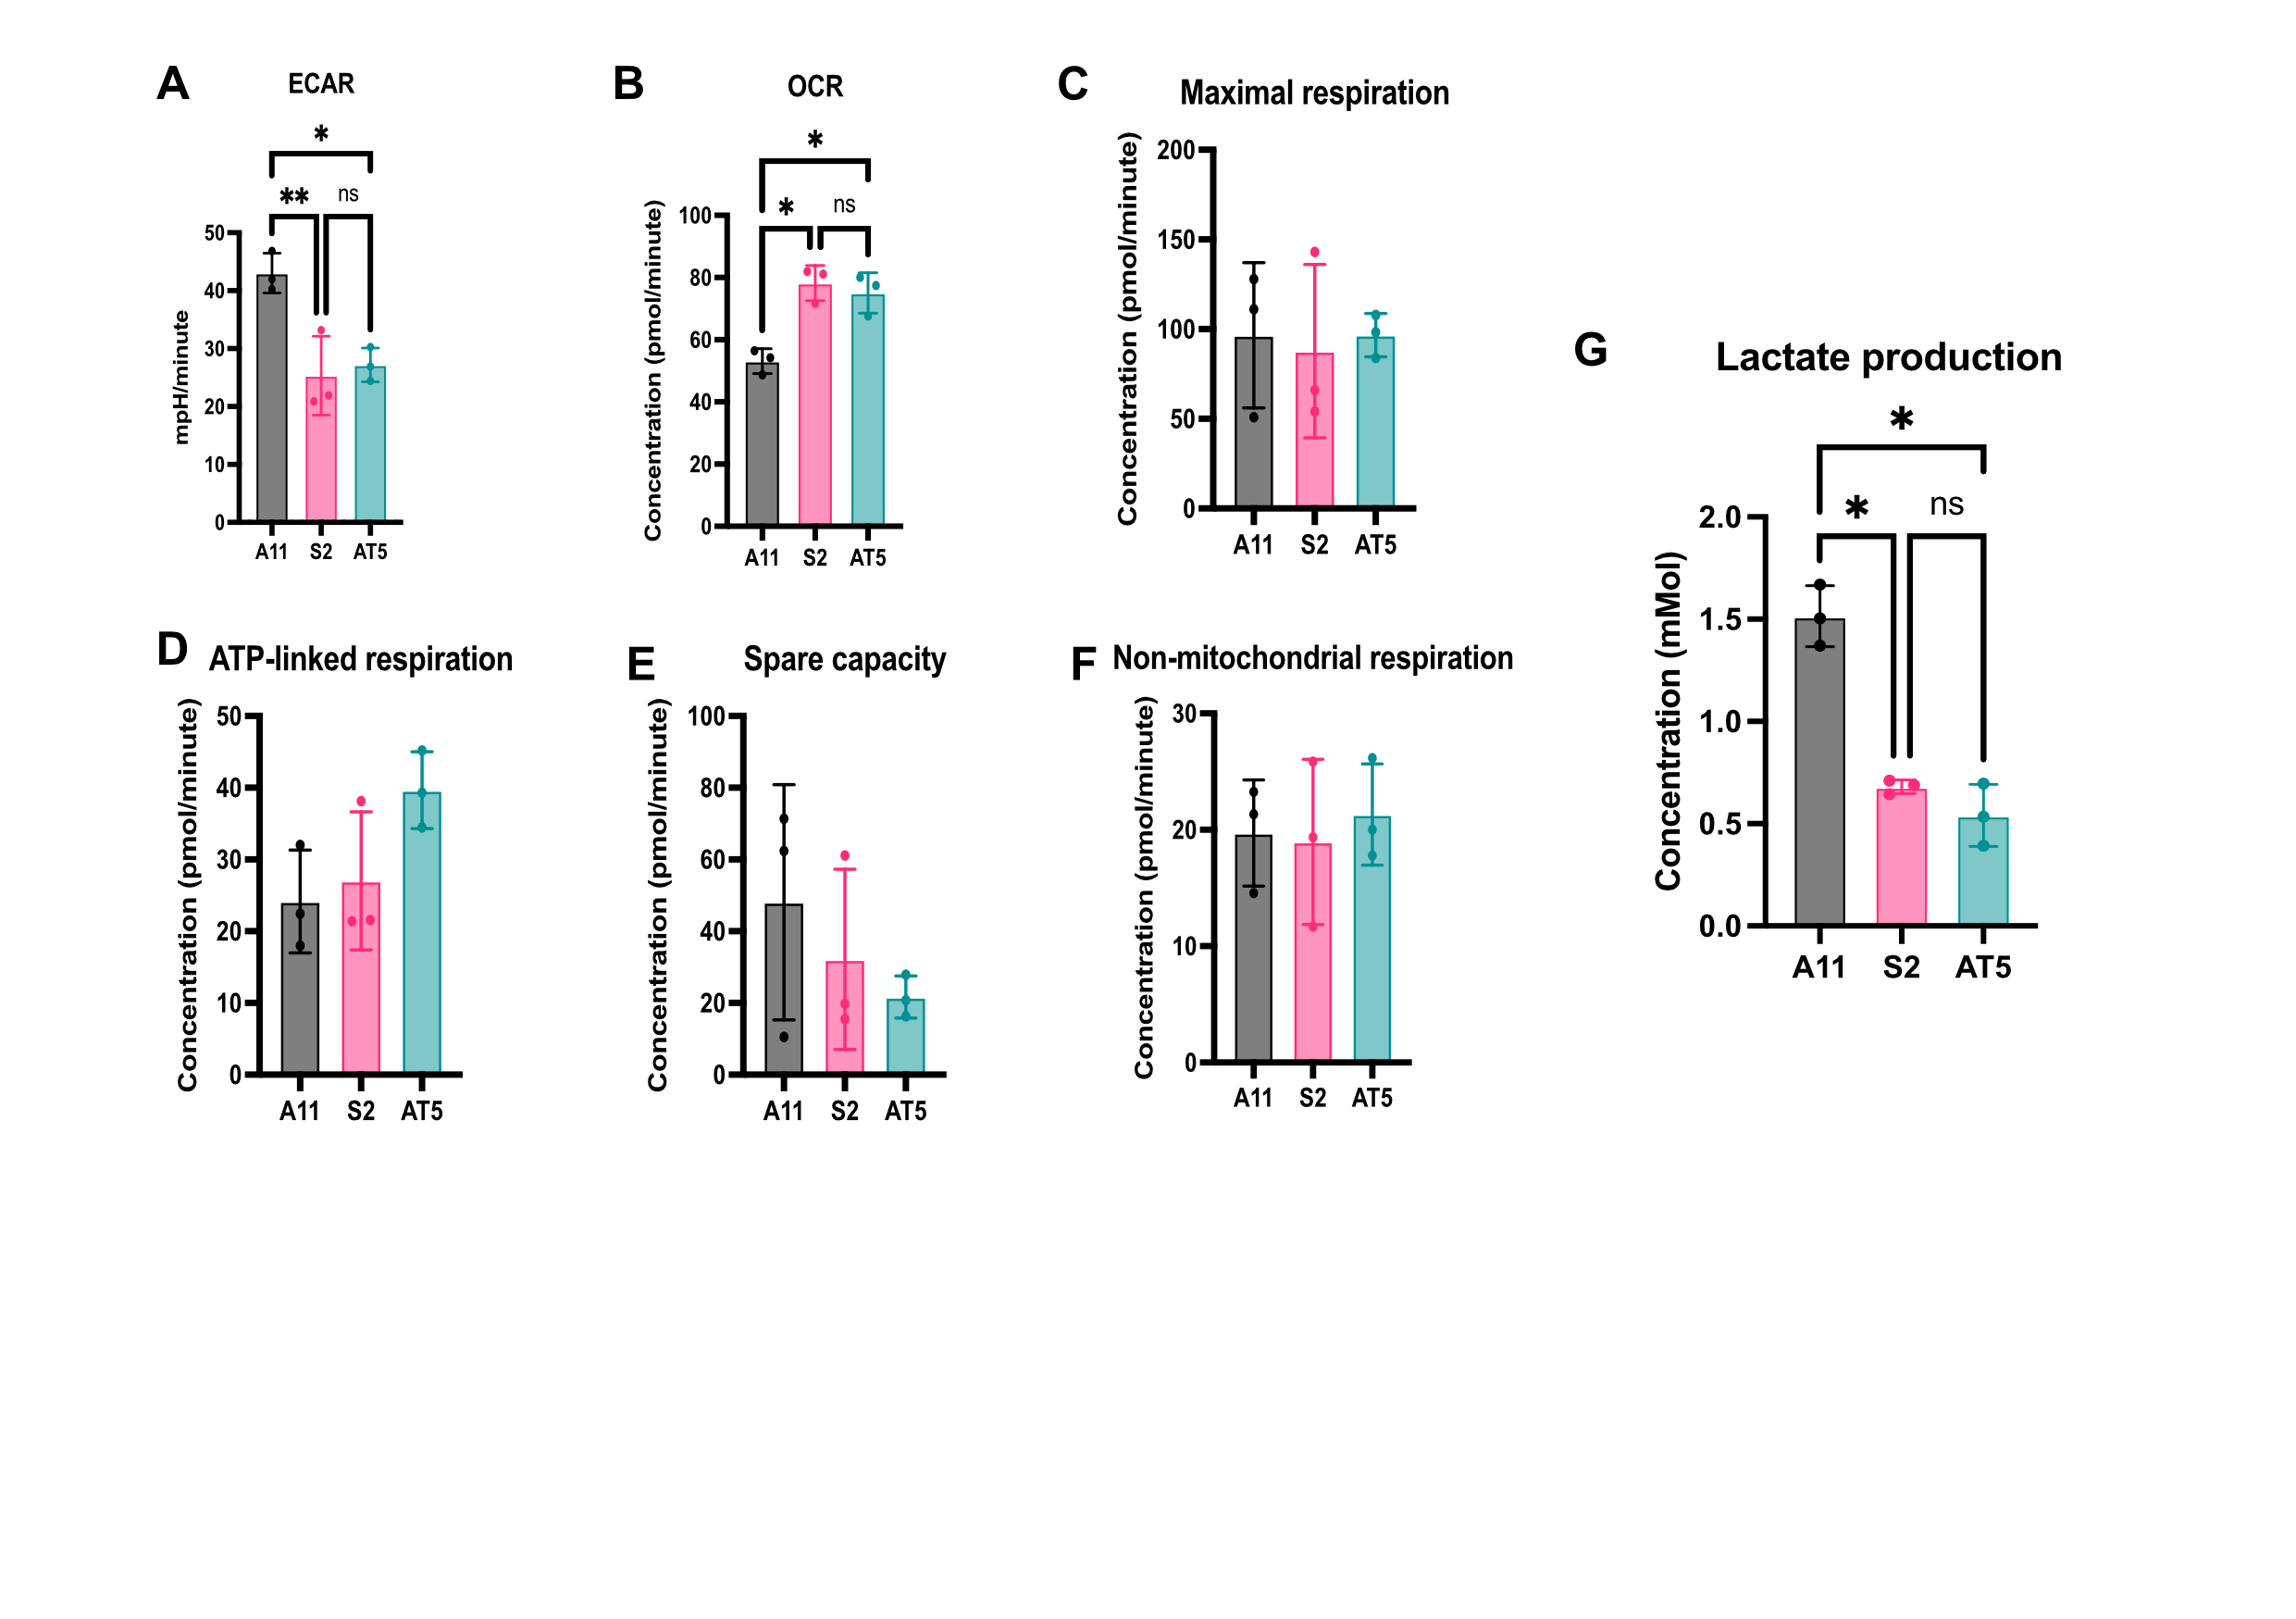
Fig 1. (A-F) Metabolic characterisation using a Seahorse analyzer. (A)ECAR (B)OCR (C)Maximal respiration reflects electron flow after injection of an uncoupler (FCCP). (D)ATP-linked respiration calculated as basal OCR minus proton leak. (E)Spare capacity calculated as maximal respiration minus basal OCR. (F)Non-mitochondrial respiration is residual OCR occurring after injection of rotenone & antimycin A. (G)1x10⁶ cells were seeded, grown for 5 days then incubated in 13mM D-[6,6’-2H2]glucose. The resulting labelled lactate was measured in extracellular media extracts.
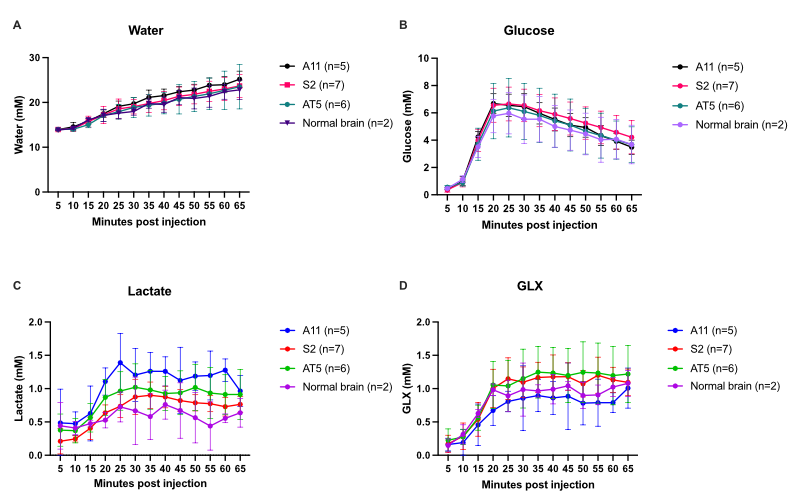
Fig 2. Concentrations in orthotopically implanted tumors of 2H labelled water (A), glucose (B), lactate (C) and Glx (D).