0258
Differentiation of subtypes and genotypes in adult-type diffuse gliomas by APT imaging1Key Laboratory for Biomedical Engineering of Ministry of Education, Department of Biomedical Engineering, College of Biomedical Engineering & Instrument Science, Zhejiang University, Hangzhou, China, 2Department of Radiology, Beijing Tiantan Hospital, Capital Medical University, Beijing, China, 3MR Collaboration, Siemens Healthineers Ltd., Beijing, China
Synopsis
Keywords: Tumors, Brain
APT-related metric maps were applied to differentiate subtypes and genotypes of adult-type diffuse gliomas following the latest 2021 WHO guidelines. One hundred and twenty-nine patients were imaged on a 3T scanner. Regions of interest were obtained with an automatic segmentation algorithm on conventional anatomical images, which were then resampled and matched with the CEST images. The mean CEST metric values were calculated in the automatically-defined regions of interest, and the receiver operating characteristic analysis was implemented, achieving generally successful performance in identifying the IDH status and part of the subtypes.Introduction
Glioma is a common primary brain tumor in adults (1). In the 2021 WHO Classification of Tumors of the Central Nervous System (2), adult-type diffuse gliomas are divided into three subtypes: oligodendrogliomas, IDH-mutant and 1p/19q-codeleted; astrocytomas, IDH-mutant; and glioblastomas, IDH-wildtype. Chemical exchange saturation transfer (CEST) imaging is a relatively new magnetic resonance imaging contrast approach that can detect biomolecules in vivo (3). Amide Proton Transfer (APT) imaging is a sub-type CEST imaging method that detects proteins and peptides in biological tissues (4,5). In previous studies, APT imaging was reported to be a promising method for grading gliomas (6) and predicting the genetic marker status (7). In this work, quantitative analysis of APT-related metrics was applied to identify subtypes and genotypes of adult-type diffuse gliomas, following the latest WHO guidelines.Methods
Patient recruitmentA total of 129 patients from our hospital were enrolled in this work from December 2020 to August 2022. The cohort comprised 69 males and 60 females, including 29 patients diagnosed with oligodendrogliomas , IDH-mutant and 1p/19q-codeleted; 59 with astrocytomas, IDH-mutant; and 41 with glioblastomas, IDH-wildtype (Table 1). The genotypes (IDH-mutant and IDH-wildtype) of gliomas were also studied in this work.
MRI data acquisition
Experiments were conducted on a 3T MRI scanner (MAGNETOM Prisma, Siemens Healthcare, Erlangen, Germany). The main acquisition parameters for whole-brain CEST imaging (8) were as follows: RF saturation power/duration = 2.5uT/1sec, TR/TE = 3000/17ms, FOV = 212x212mm2, slice thickness = 2.79mm, and 7 frequency offsets including an unsaturated frame and 6 saturated frames (±3ppm, ±4ppm, and ±3.5ppm), and total acquisition duration = 4.6min. In addition, a dual-echo gradient-echo sequence with TE = 4.92/9.84ms was deployed for B0 field mapping. Conventional T1-weighted images (TR/TE = 1560/1.65ms, slice thickness = 1mm) and T2-weighted images (TR/TE = 5020/105ms, slice thickness = 5mm) were also acquired for defining the regions of interest (ROI).
Automatic segmentation
Figure 1 shows the whole process of this work, including image segmentation, resampling, and metric calculation. Axial T2-weighted images from 700 randomly selected glioma patients in our database, and 234 glioma patients from the TCGA database(9) were used to train an automatic segmentation tool based on a 3D nnUnet (10). The tool was applied to T2-weighted images acquired in this study to obtain initial regions of tumors which were then transformed to CEST raw images with a python toolbox named SimpleITK (11).
Statistical analysis
With the reference signal at -3.5ppm and the label signal at 3.5ppm, APT-related metric maps, including CESTR, CESTRnr, and MTRRex, were calculated (12) on motion-corrected CEST images (13). Resampled ROIs were overlaid on CEST metric maps to calculate the mean indices within each patient’s tumor area. Quantitative data were expressed as mean values±standard deviation. A two-sample t-test and a one-way ANOVA were performed to evaluate the differences in metrics of different glioma subtypes and genotypes. As for the comparison between genotypes and subtypes, the receiver operating characteristic curves (ROC) were plotted. A Delong test was implemented with the Medcalc software to evaluate the statistical difference in the areas under the ROC (AUC). P < 0.05 was considered significant. Images were processed in MATLAB R2021b.
Results
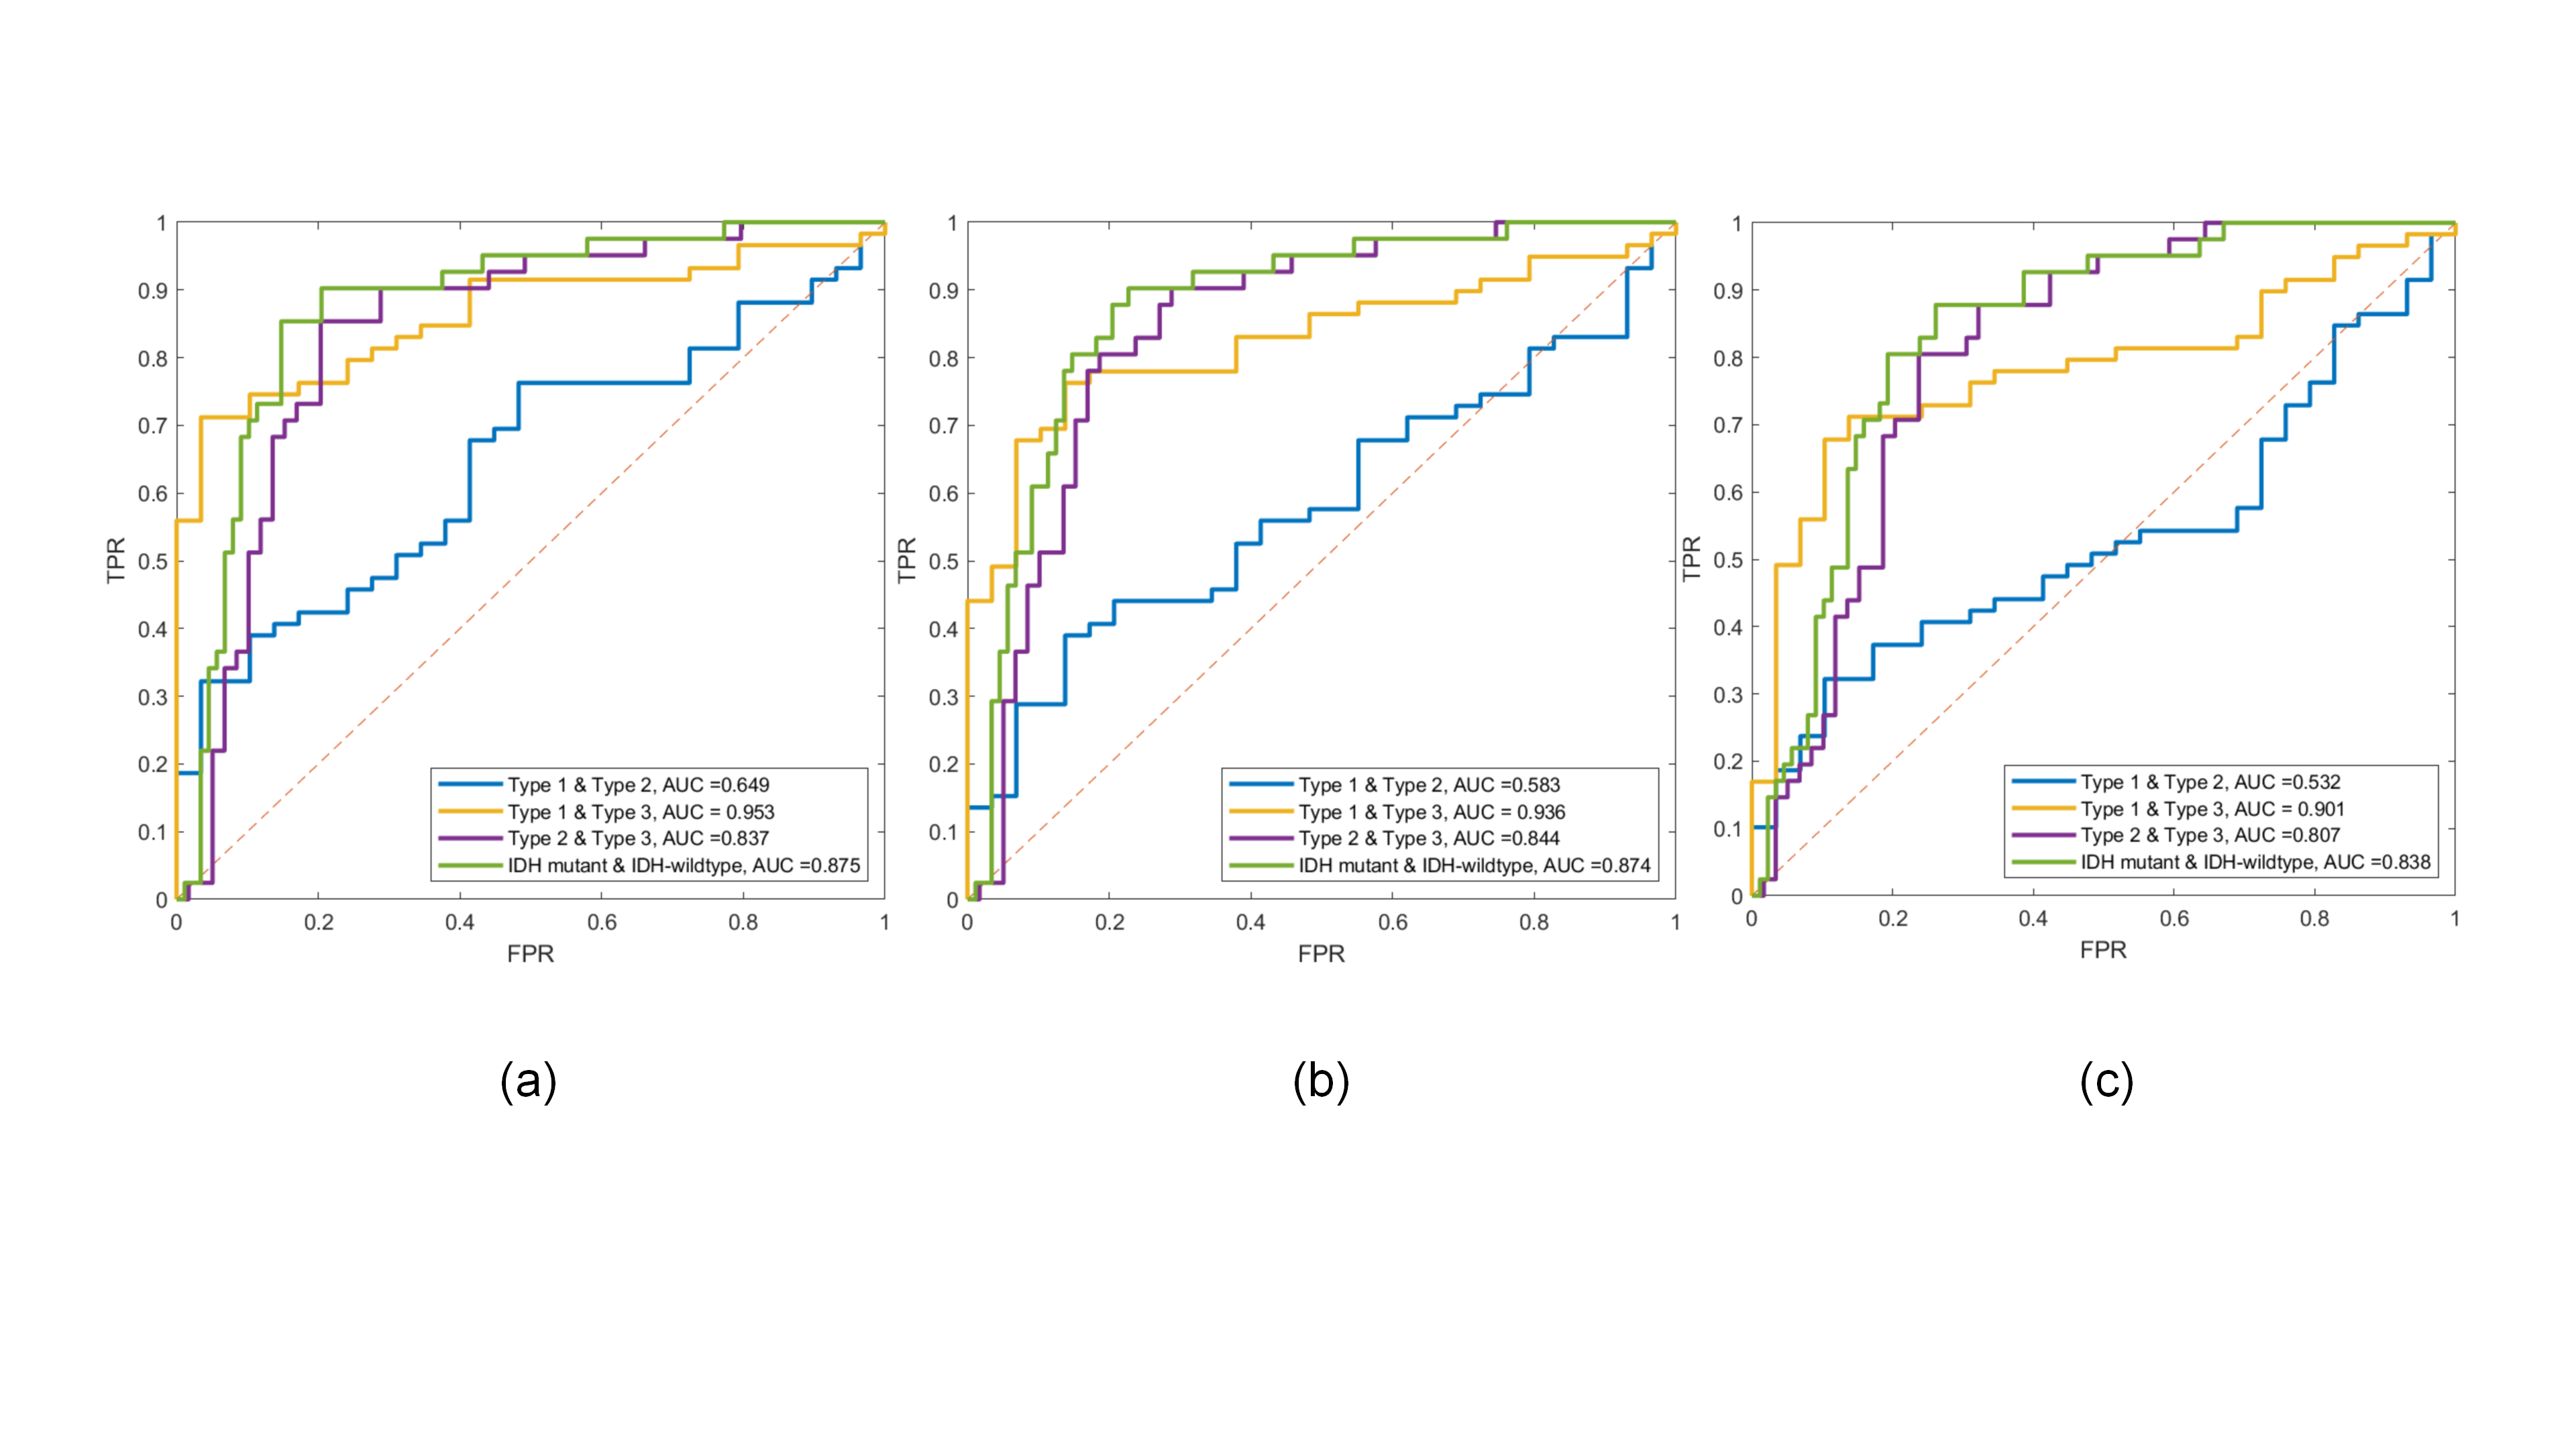
Figure 2 displays representative T1-weighted images and APT-related metric maps (CESTR, CESTRnr, and MTRRex) from patients of each subtype. Quantitative analysis results are displayed in Figure 3. Each metric in type 3 (glioblastomas, IDH-wildtype) was significantly bigger (P<0.0003) than the other 2 types, while no significant difference was found between type 1 (oligodendroglioma, IDH-mutant and 1p/19q-codeleted) and type 2 (astrocytoma, IDH-mutant). In addition, the metrics of IDH-wildtype were significantly bigger (P<0.0001) than those of IDH-mutant. Figure 4 displays receiver operating curves between pairwise genotypes and subtypes, among which the biggest AUC reaches 0.953 between type 1 (oligodendroglioma, IDH-mutant and 1p/19q-codeleted) and type 3 (glioblastomas, IDH-wildtype). According to the results of the Delong test, significant differences were found only between CESTRnr and MTRRex.Discussion and Conclusion
To the best of our knowledge, the APT-related metrics have been rarely used for subtyping gliomas, especially following the latest 2021 WHO guidelines. In this work, APT MRI showed excellent performance in differentiating the subtypes and genotypes of adult-type diffuse gliomas. The results show good identification between IDH-mutant and IDH-wildtype, probably because IDH-mutant and IDH-wildtype gliomas have distinct clinical and genetic features, IDH-wildtype is more aggressive and has a worse prognosis (2). Besides, two subtypes of IDH-mutant gliomas cannot be differentiated well, which implies APT imaging can be an effective molecular marker of the IDH status but may need further studies to get more detailed subtyping.Acknowledgements
National Natural Science Foundation of China: 81971605. Key R&D Program of Zhejiang Province: 2022C04031. Leading Innovation and Entrepreneurship Team of Zhejiang Province: 2020R01003. This work was supported by the MOE Frontier Science Center for Brain Science & Brain-Machine Integration, Zhejiang University.References
1. Lapointe S, Perry A, Butowski NA. Primary brain tumours in adults. The Lancet 2018;392(10145):432-446.
2. Louis DN, Perry A, Wesseling P, Brat DJ, Cree IA, Figarella-Branger D, Hawkins C, Ng H, Pfister SM, Reifenberger G. The 2021 WHO classification of tumors of the central nervous system: a summary. Neuro-oncology 2021;23(8):1231-1251.
3. Van Zijl PC, Yadav NN. Chemical exchange saturation transfer (CEST): what is in a name and what isn't? Magnetic resonance in medicine 2011;65(4):927-948.
4. Zhou J, Payen J-F, Wilson DA, Traystman RJ, van Zijl PC. Using the amide proton signals of intracellular proteins and peptides to detect pH effects in MRI. Nature medicine 2003;9(8):1085-1090.
5. Zhou J, Zaiss M, Knutsson L, Sun PZ, Ahn SS, Aime S, Bachert P, Blakeley JO, Cai K, Chappell MA, Chen M, Gochberg DF, Goerke S, Heo HY, Jiang S, Jin T, Kim SG, Laterra J, Paech D, Pagel MD, Park JE, Reddy R, Sakata A, Sartoretti-Schefer S, Sherry AD, Smith SA, Stanisz GJ, Sundgren PC, Togao O, Vandsburger M, Wen Z, Wu Y, Zhang Y, Zhu W, Zu Z, van Zijl PCM. Review and consensus recommendations on clinical APT-weighted imaging approaches at 3T: Application to brain tumors. Magnetic resonance in medicine 2022;88(2):546-574.
6. Togao O, Yoshiura T, Keupp J, Hiwatashi A, Yamashita K, Kikuchi K, Suzuki Y, Suzuki SO, Iwaki T, Hata N. Amide proton transfer imaging of adult diffuse gliomas: correlation with histopathological grades. Neuro-oncology 2014;16(3):441-448.
7. Jiang S, Zou T, Eberhart CG, Villalobos MA, Heo HY, Zhang Y, Wang Y, Wang X, Yu H, Du Y. Predicting IDH mutation status in grade II gliomas using amide proton transfer‐weighted (APTw) MRI. Magnetic resonance in medicine 2017;78(3):1100-1109.
8. Zhang Y, Yong X, Liu R, Tang J, Jiang H, Fu C, Wei R, Hsu YC, Sun Y, Luo B. Whole‐brain chemical exchange saturation transfer imaging with optimized turbo spin echo readout. Magnetic Resonance in Medicine 2020;84(3):1161-1172.
9. Tomczak K, Czerwińska P, Wiznerowicz M. Review The Cancer Genome Atlas (TCGA): an immeasurable source of knowledge. Contemporary Oncology/Współczesna Onkologia 2015;2015(1):68-77.
10. Isensee F, Jaeger PF, Kohl SA, Petersen J, Maier-Hein KH. nnU-Net: a self-configuring method for deep learning-based biomedical image segmentation. Nature methods 2021;18(2):203-211.
11. Yaniv Z, Lowekamp BC, Johnson HJ, Beare R. SimpleITK image-analysis notebooks: a collaborative environment for education and reproducible research. Journal of digital imaging 2018;31(3):290-303.
12. Heo HY, Lee DH, Zhang Y, Zhao X, Jiang S, Chen M, Zhou J. Insight into the quantitative metrics of chemical exchange saturation transfer (CEST) imaging. Magnetic resonance in medicine 2017;77(5):1853-1865.
13. Zhang Y, Heo HY, Lee DH, Zhao X, Jiang S, Zhang K, Li H, Zhou J. Selecting the reference image for registration of CEST series. Journal of Magnetic Resonance Imaging 2016;43(3):756-761.
Figures
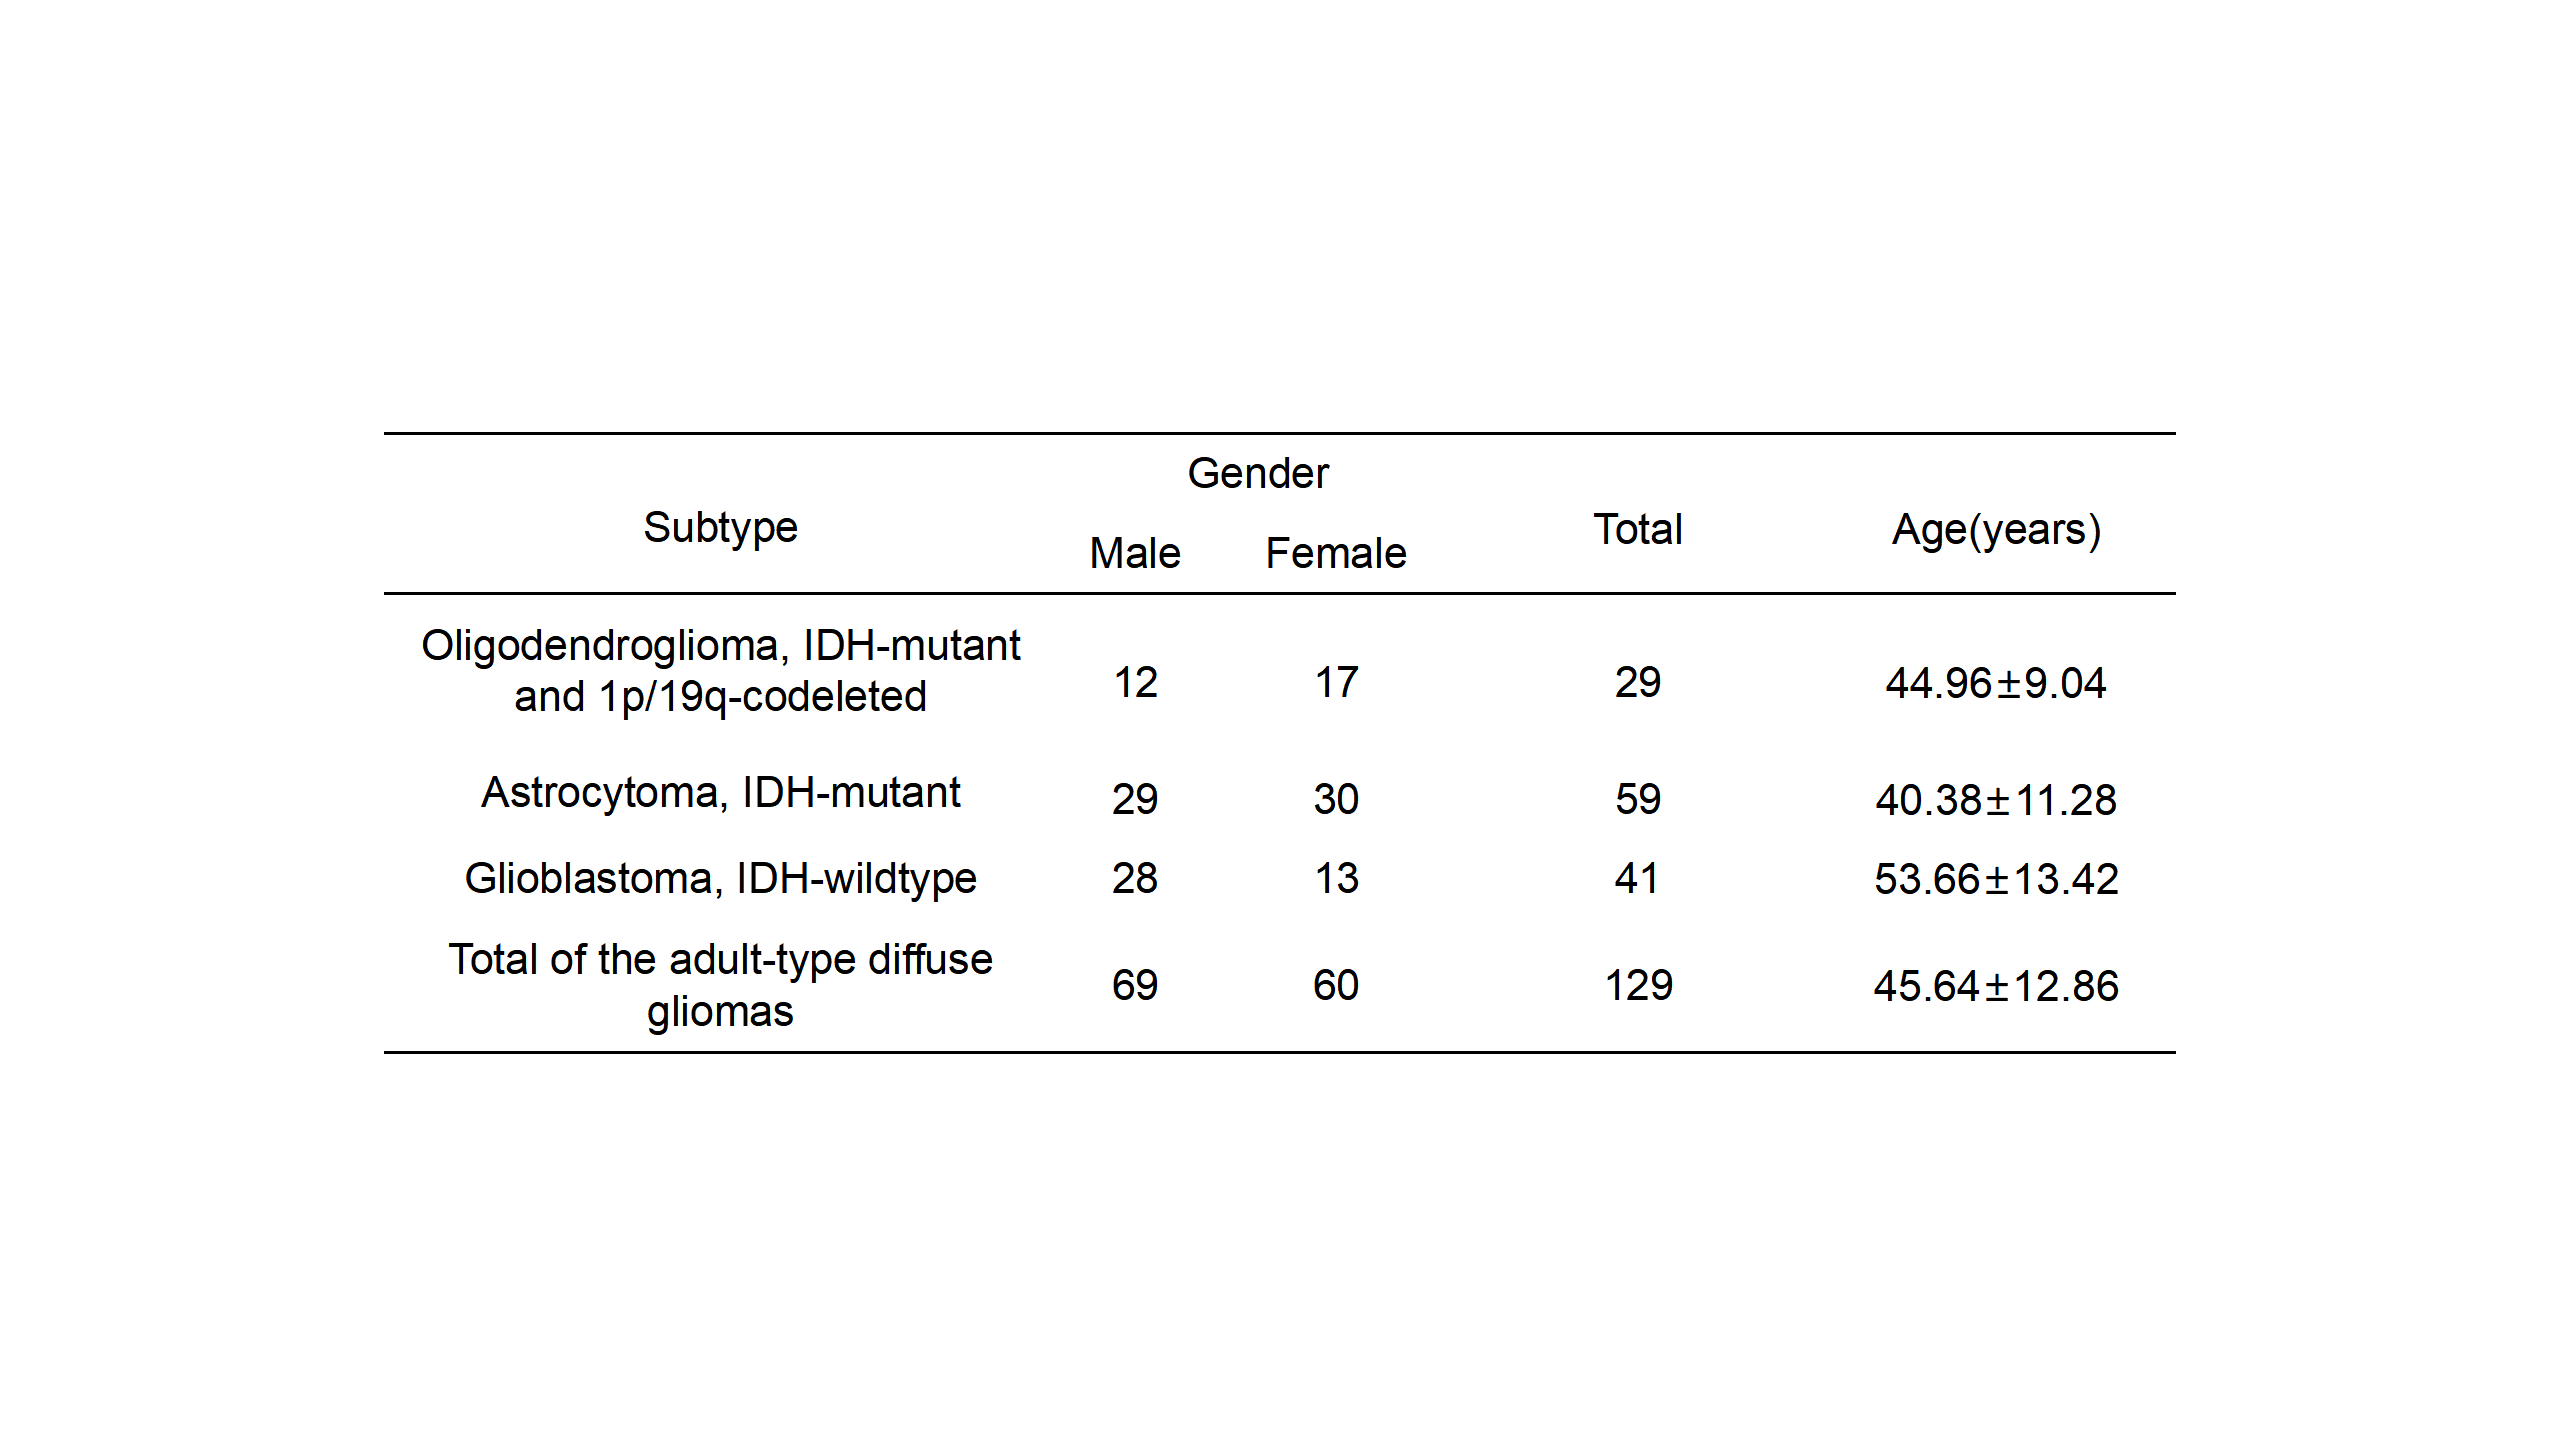
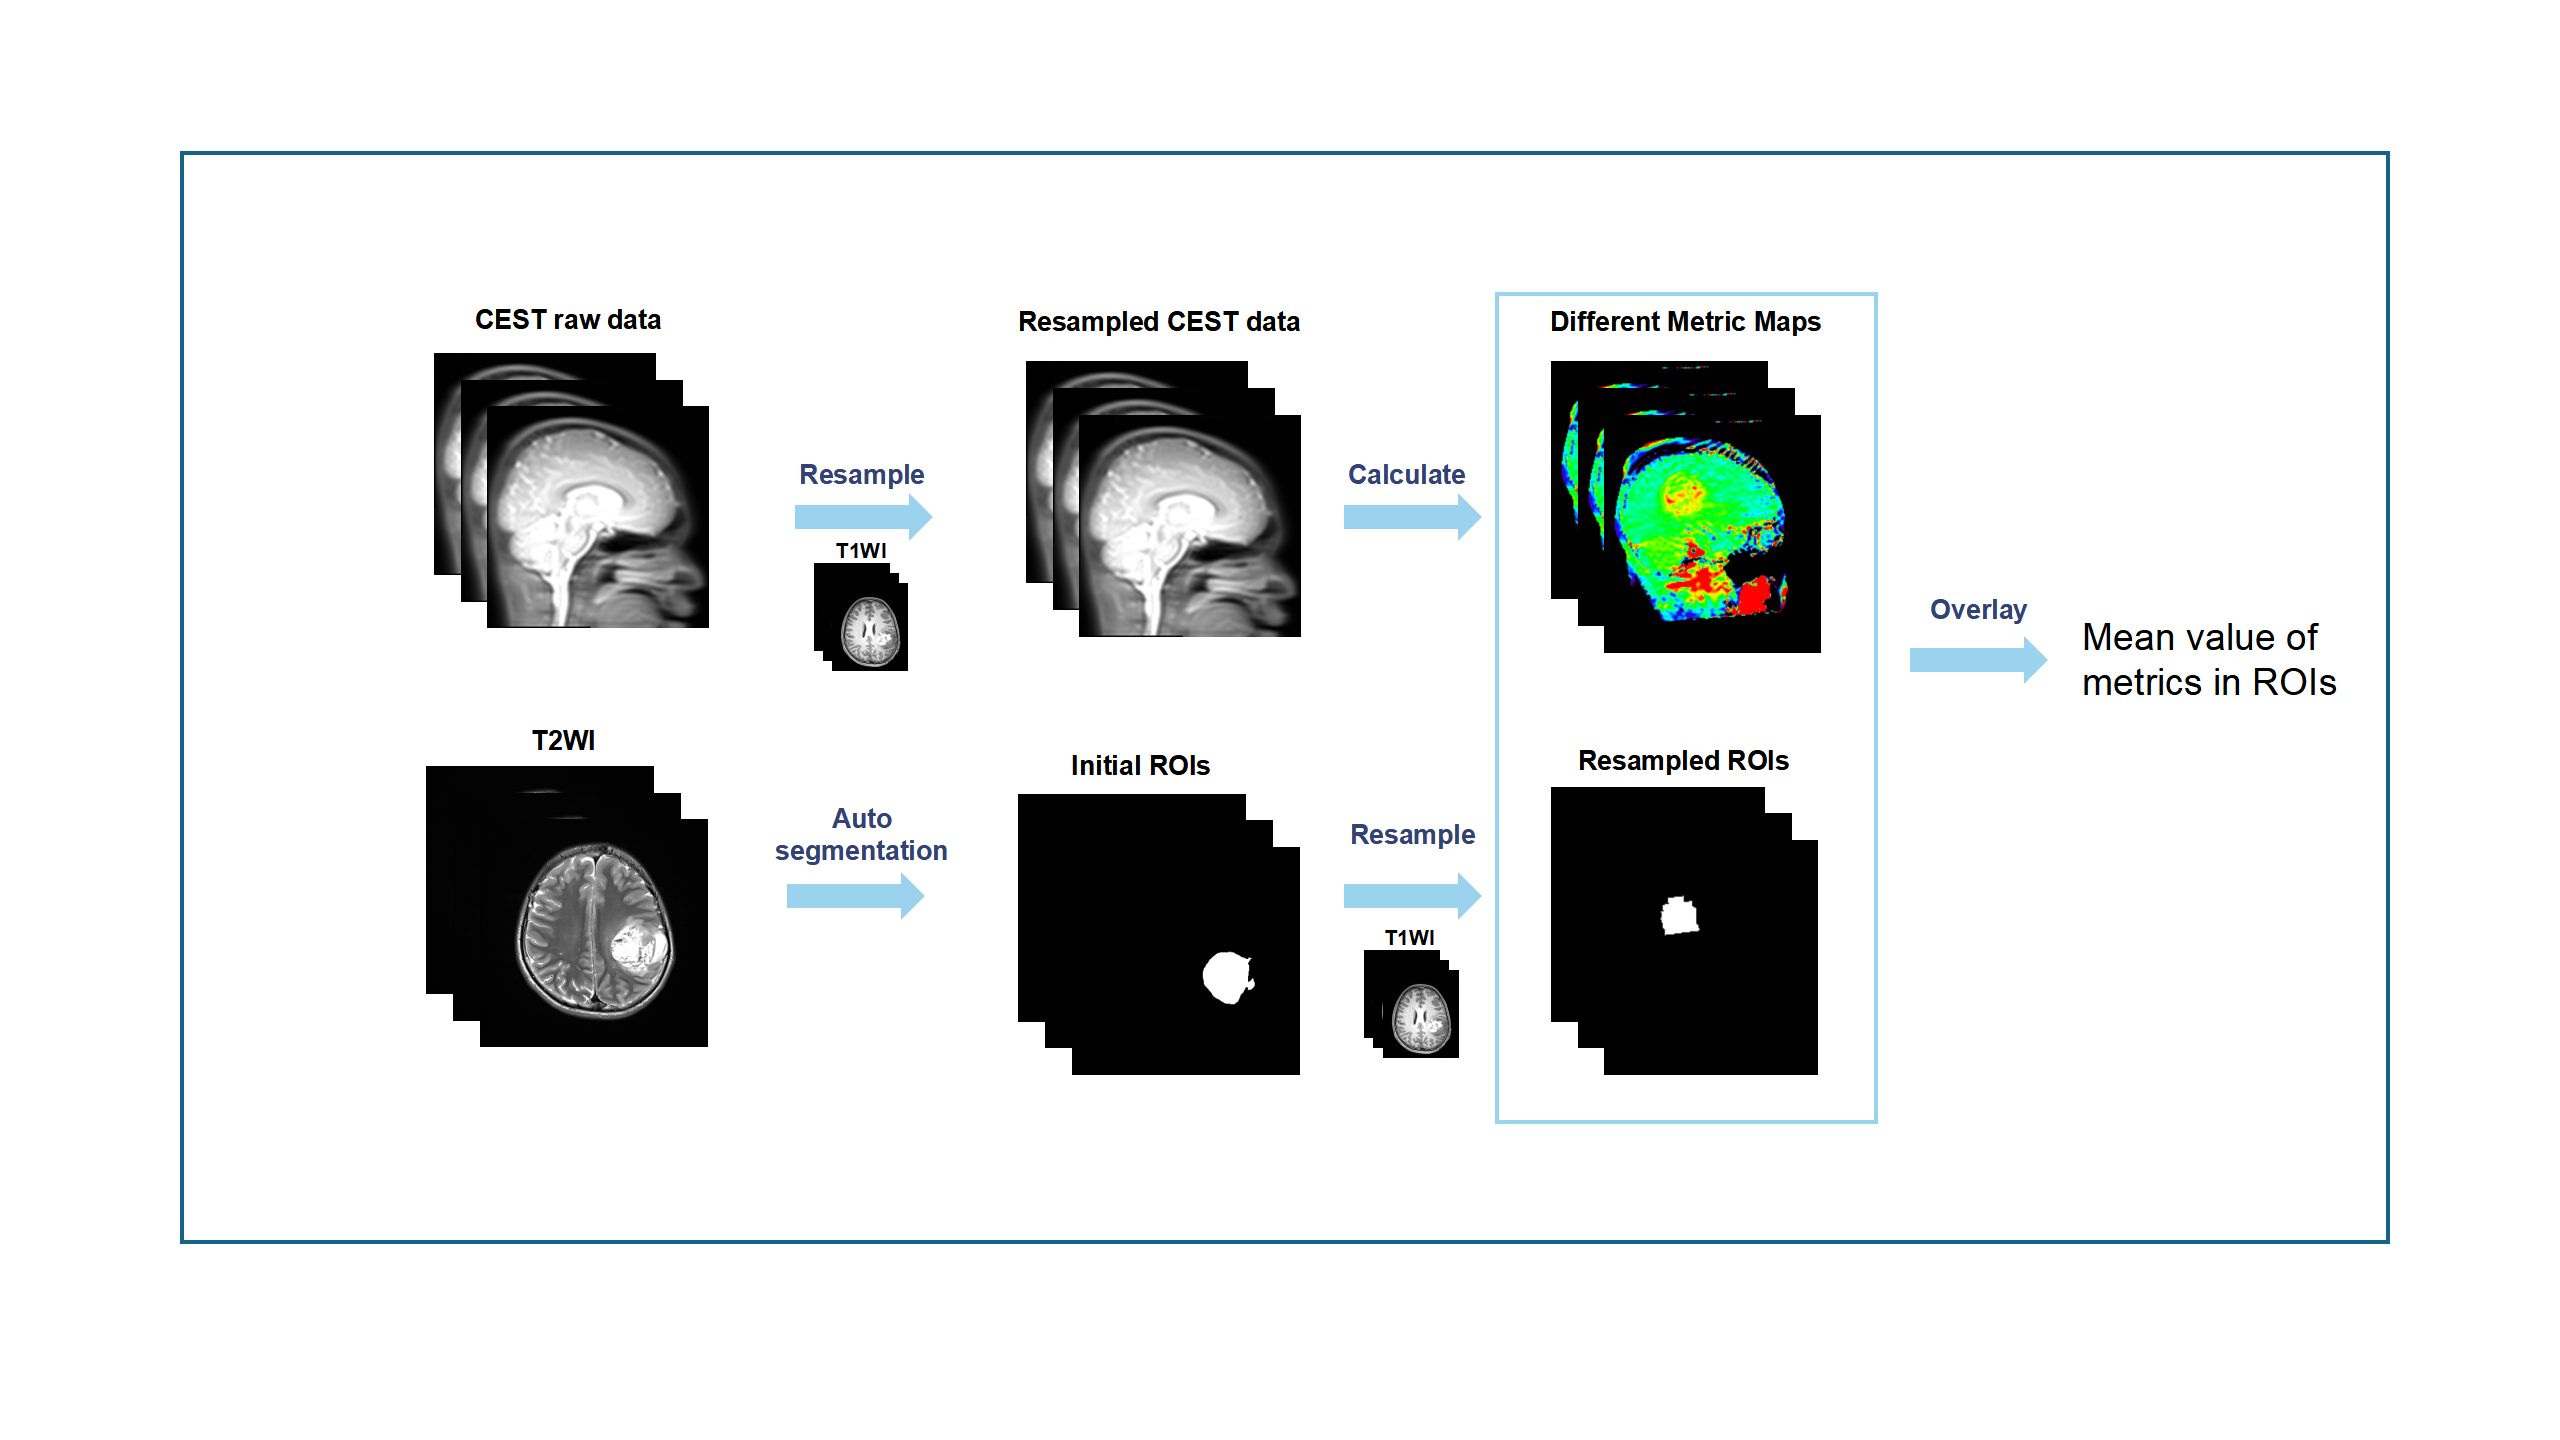
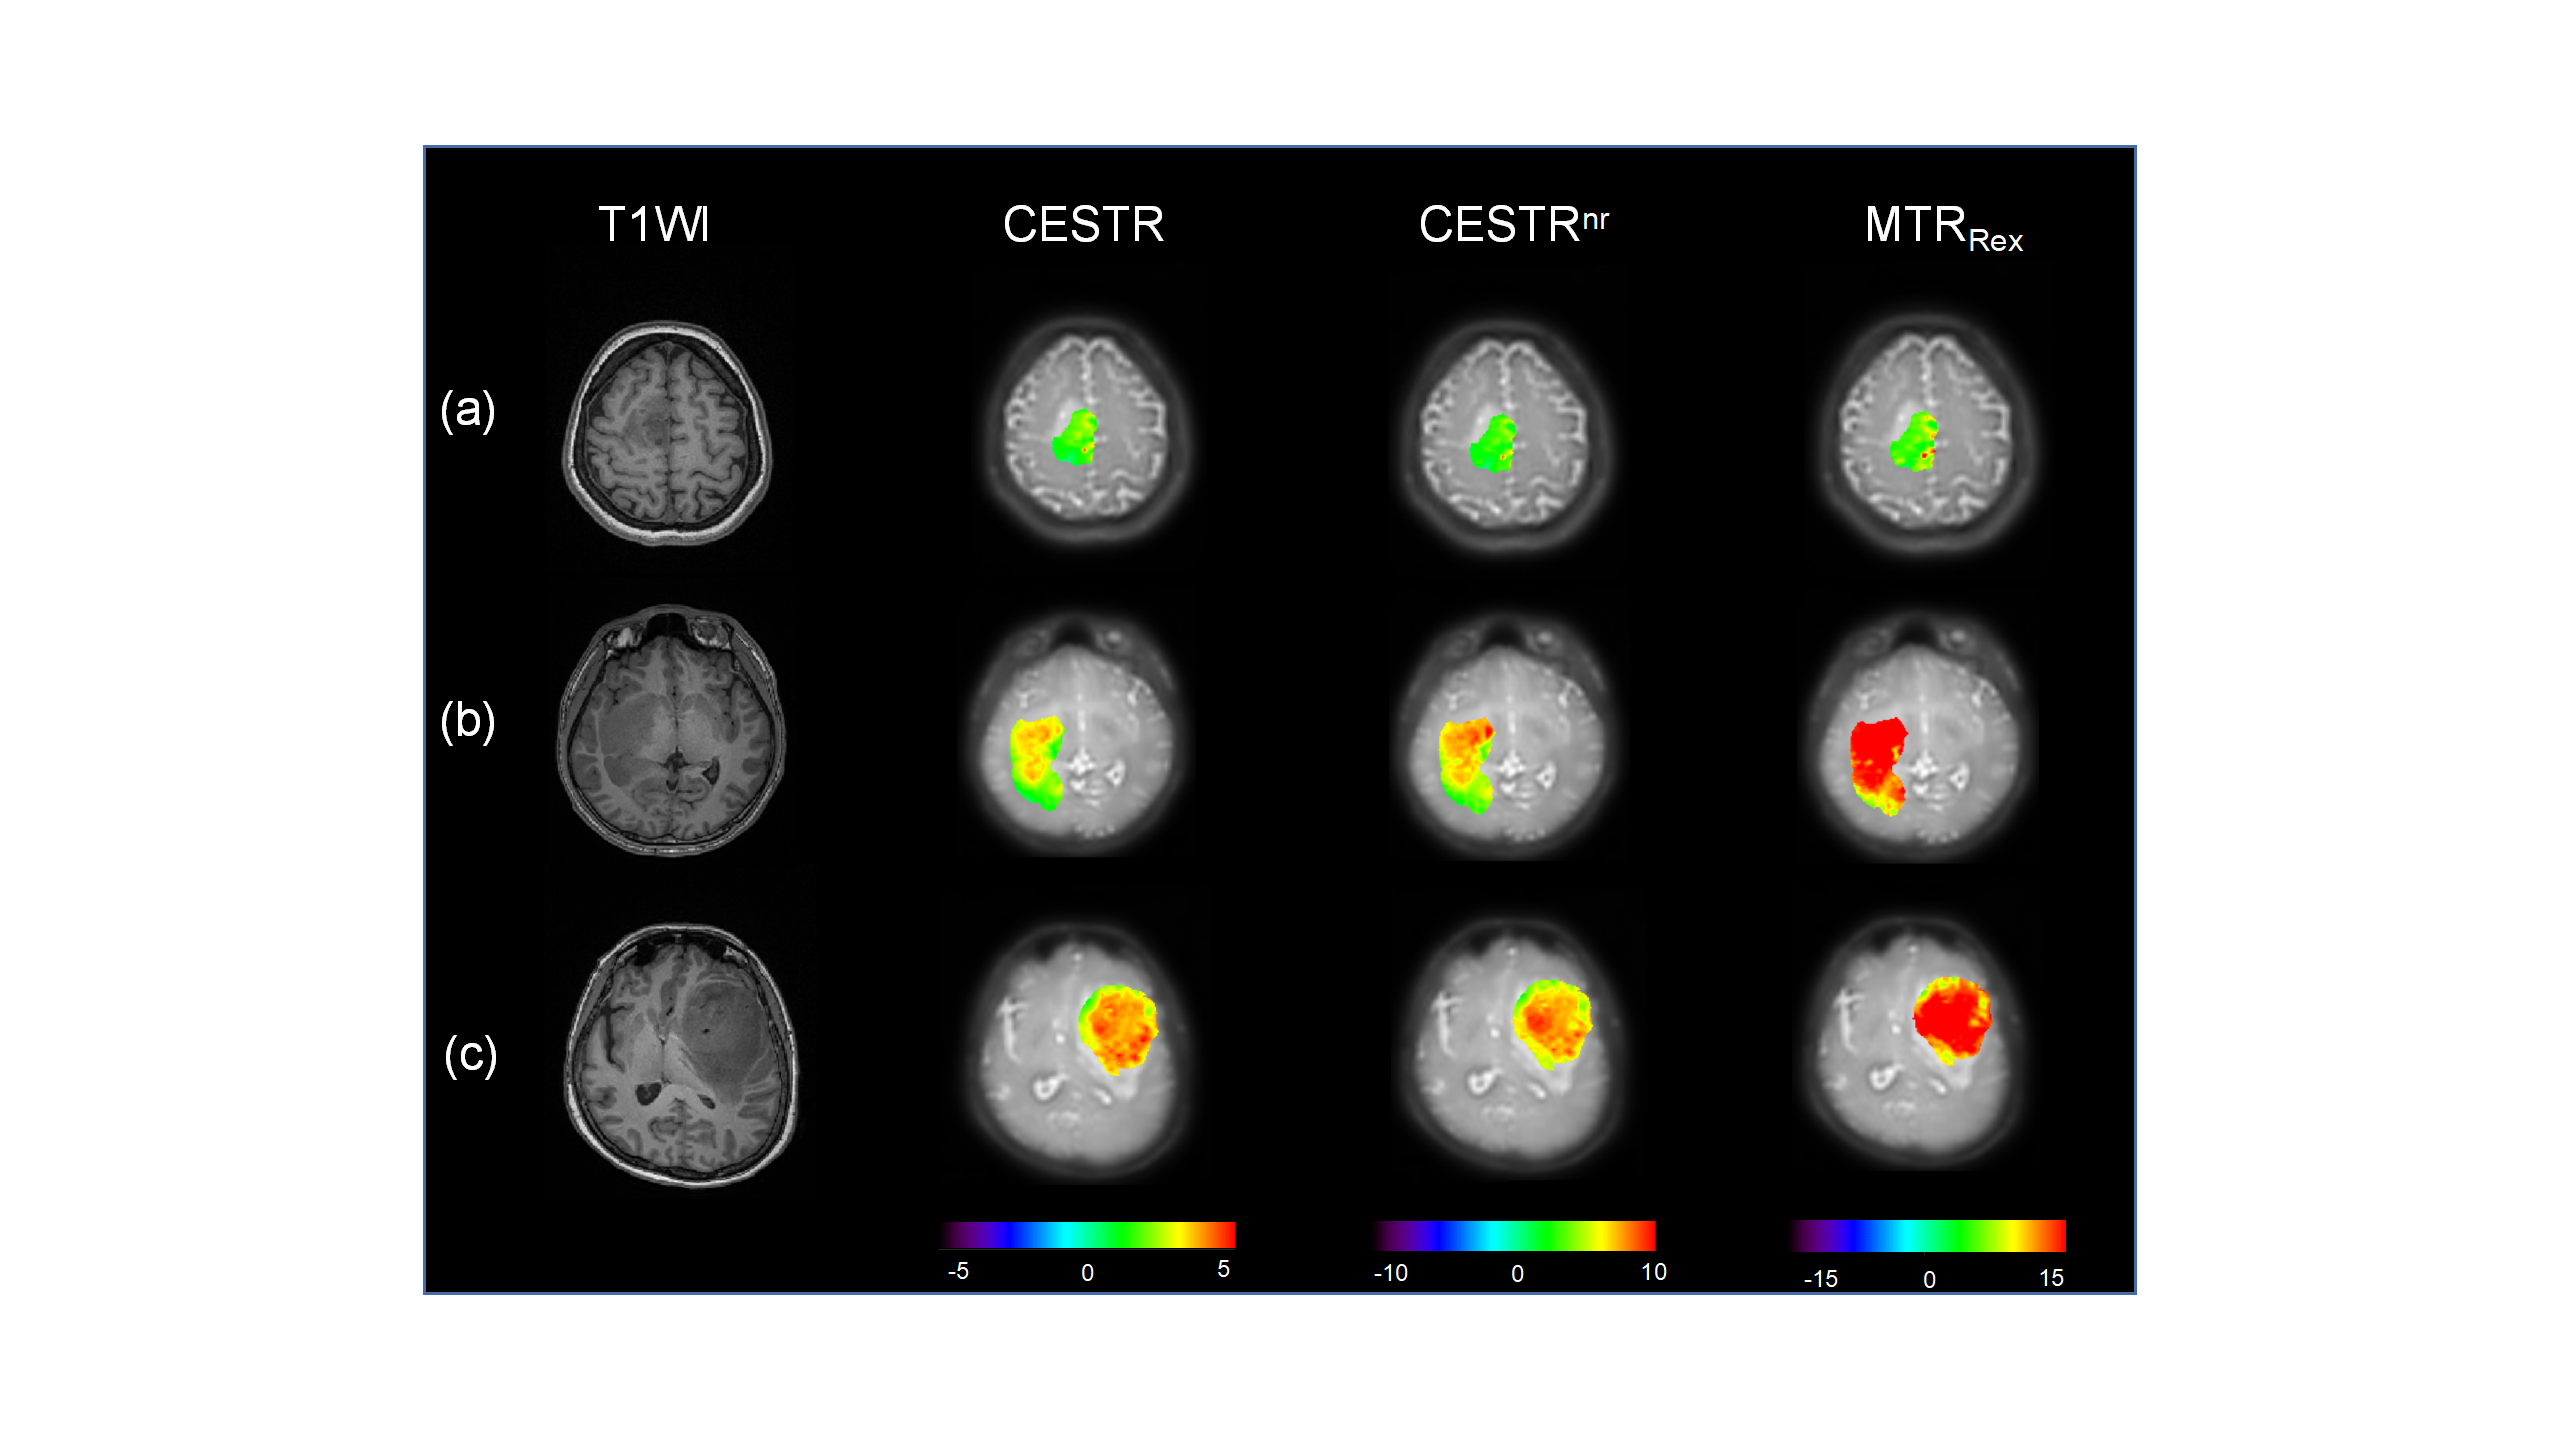
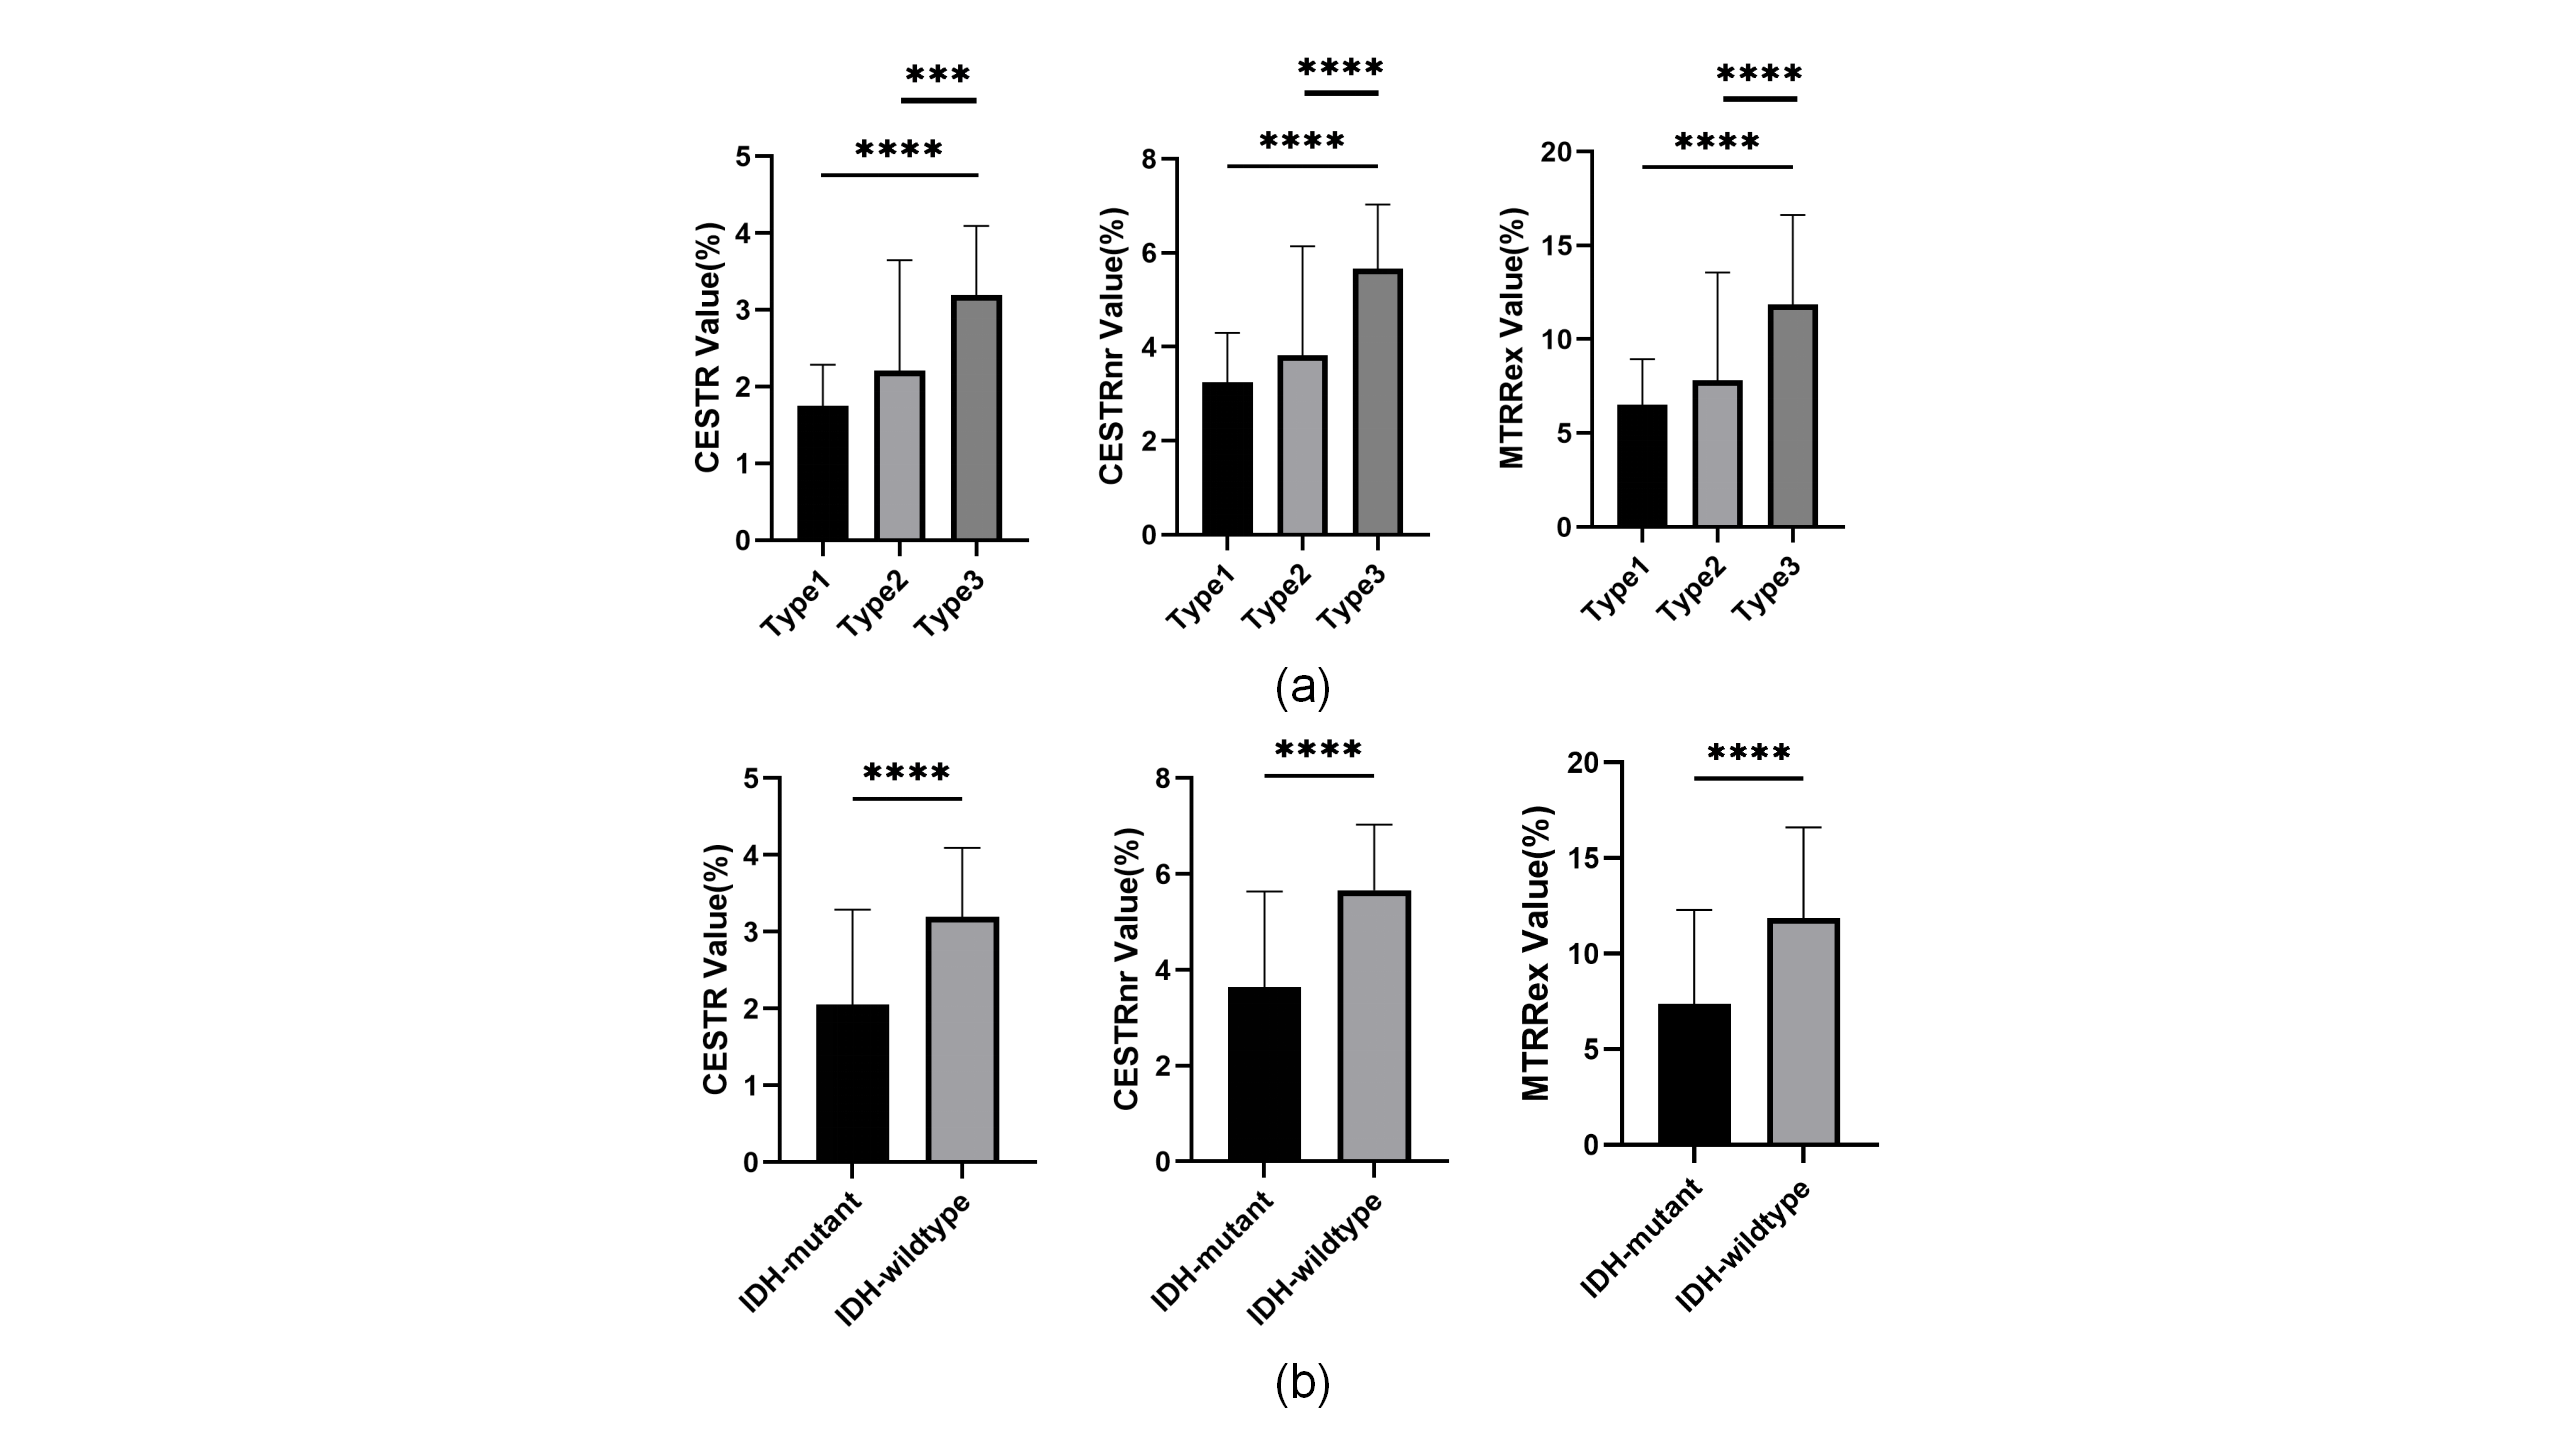
Figure 3. Quantitative analyses of different CEST metrics of three molecular subtypes (a) and IDH subtypes (b) of adult-type diffuse gliomas. Column 1 displays CESTR values, column 2 displays CESTRnr values, and column 3 displays MTRRex values. Type 1: oligodendroglioma, IDH-mutant and 1p/19q-codeleted; type 2: astrocytoma, IDH-mutant; type 3: glioblastomas, IDH-wildtype.
Note: ***, p<0.001; ****, p<0.0001.