0257
Early detection of brain tumor response during local hydrogel based treatment using CEST MRI1Department of Biomedical Engineering, City University of Hong Kong, Hong Kong, Hong Kong, 2Hong Kong Centre for Cerebro-Cardiovascular Health Engineering (COCHE), Hong Kong, Hong Kong, 3SiBionics, Shenzhen, China, 4Russell H. Morgan Department of Radiology and Radiological Science, The Johns Hopkins University School of Medicine, Baltimore, MD, United States, 5City University of Hong Kong Shenzhen Research Institute, Shenzhen, China
Synopsis
Keywords: Tumors, Treatment
CEST MRI is a non-invasive molecular imaging approach, while APT has been applied to reveal molecular changes in brain tumors. Based on our theranostic hydrogel studies, here, we demonstrated the therapeutic effect on brain tumor with a continuous decrease in tumor size over 10 days. Importantly, the APT signal showed significant decrease on day 3 after treatment when tumor size did not have a significant change. Moreover, a strong correlation between APT signal and Ki-67 staining was shown. This could be a potential application to detect early tumor responses toward local hydrogel based treatment.Introduction
Current clinical and biological prognostic factors for glioblastoma (GBM) include gender, age or chemo-radiation therapy1. There are also multiple molecular prognostic factors, including MGMT promoter methylation, IDH mutation or high expression of angiogenic genes but still under investigation2. APT signal has been frequently used in clinical stage for tumor grading and differentiating tumor recurrence from tumor necrosis3, since it indicates endogenous proteins and peptides4-6. Here, based on our developed theranostic hydrogel7-9, which we have already shown therapeutic effect by treating brain tumor locally, we would like to investigate the role of APT in the detection of tumor response to the local hydrogel-based treatment. Three subregions of tumors based on the distance from the hydrogel were analyzed by Ki-67. Findings were validated with histology using H&E and Ki-67 staining, which indicate changes in cellularity and cell proliferation respectively10-12. We also studied the cell density, cell proliferation and correlation between APT signal and Ki-67 expression. Therefore, APT signal could be a specific molecular tumor biomarker, which can provide an information for early assessment in tumor treatment.Methods
The preparation of liposomal hydrogel and injection of tumor and hydrogel were from the previous studies7-9. In brief, the liposomal hydrogel contained the gemcitabine and methotrexate. T2-weighted images and CEST were acquired until day 10. The saturation parameters for CEST were B1=0.8 µT, Tsat=3 secs and CEST signal at 3.5 ppm was analyzed after Lorentzian fitting. At day 10, mice (n=10) were anesthetized and perfused with saline (0.9%) and 10% neutral buffered formalin (NBF) to fix brain tissues. Brain tissue sections with a thickness of 14 mm were cut on a cryostat (Leica) and directly mounted onto microscopic slides. H&E staining was performed according to the standard protocols. For Ki-67 staining, antigen retrieval was performed for 20 minutes after rehydration in PBST. After staining with antibodies and DAPI, bright field and fluorescence microscopic images were acquired and statistical analysis was evaluated with Prism 8 (GraphPad Software).Results and Discussion
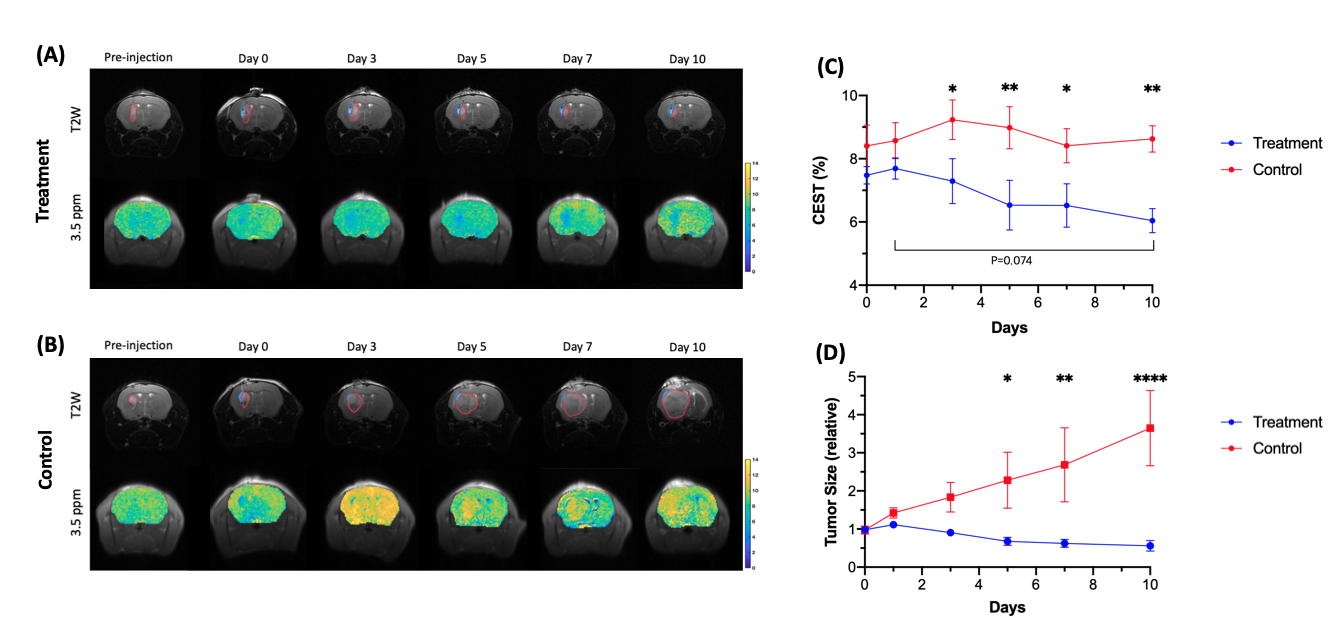
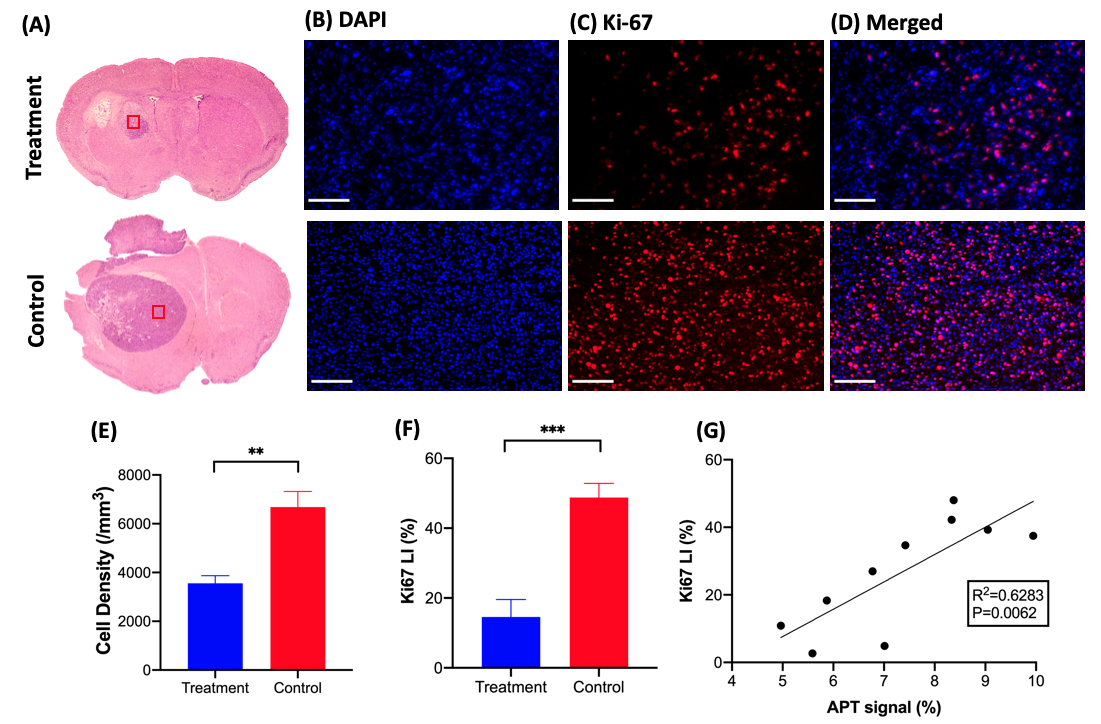
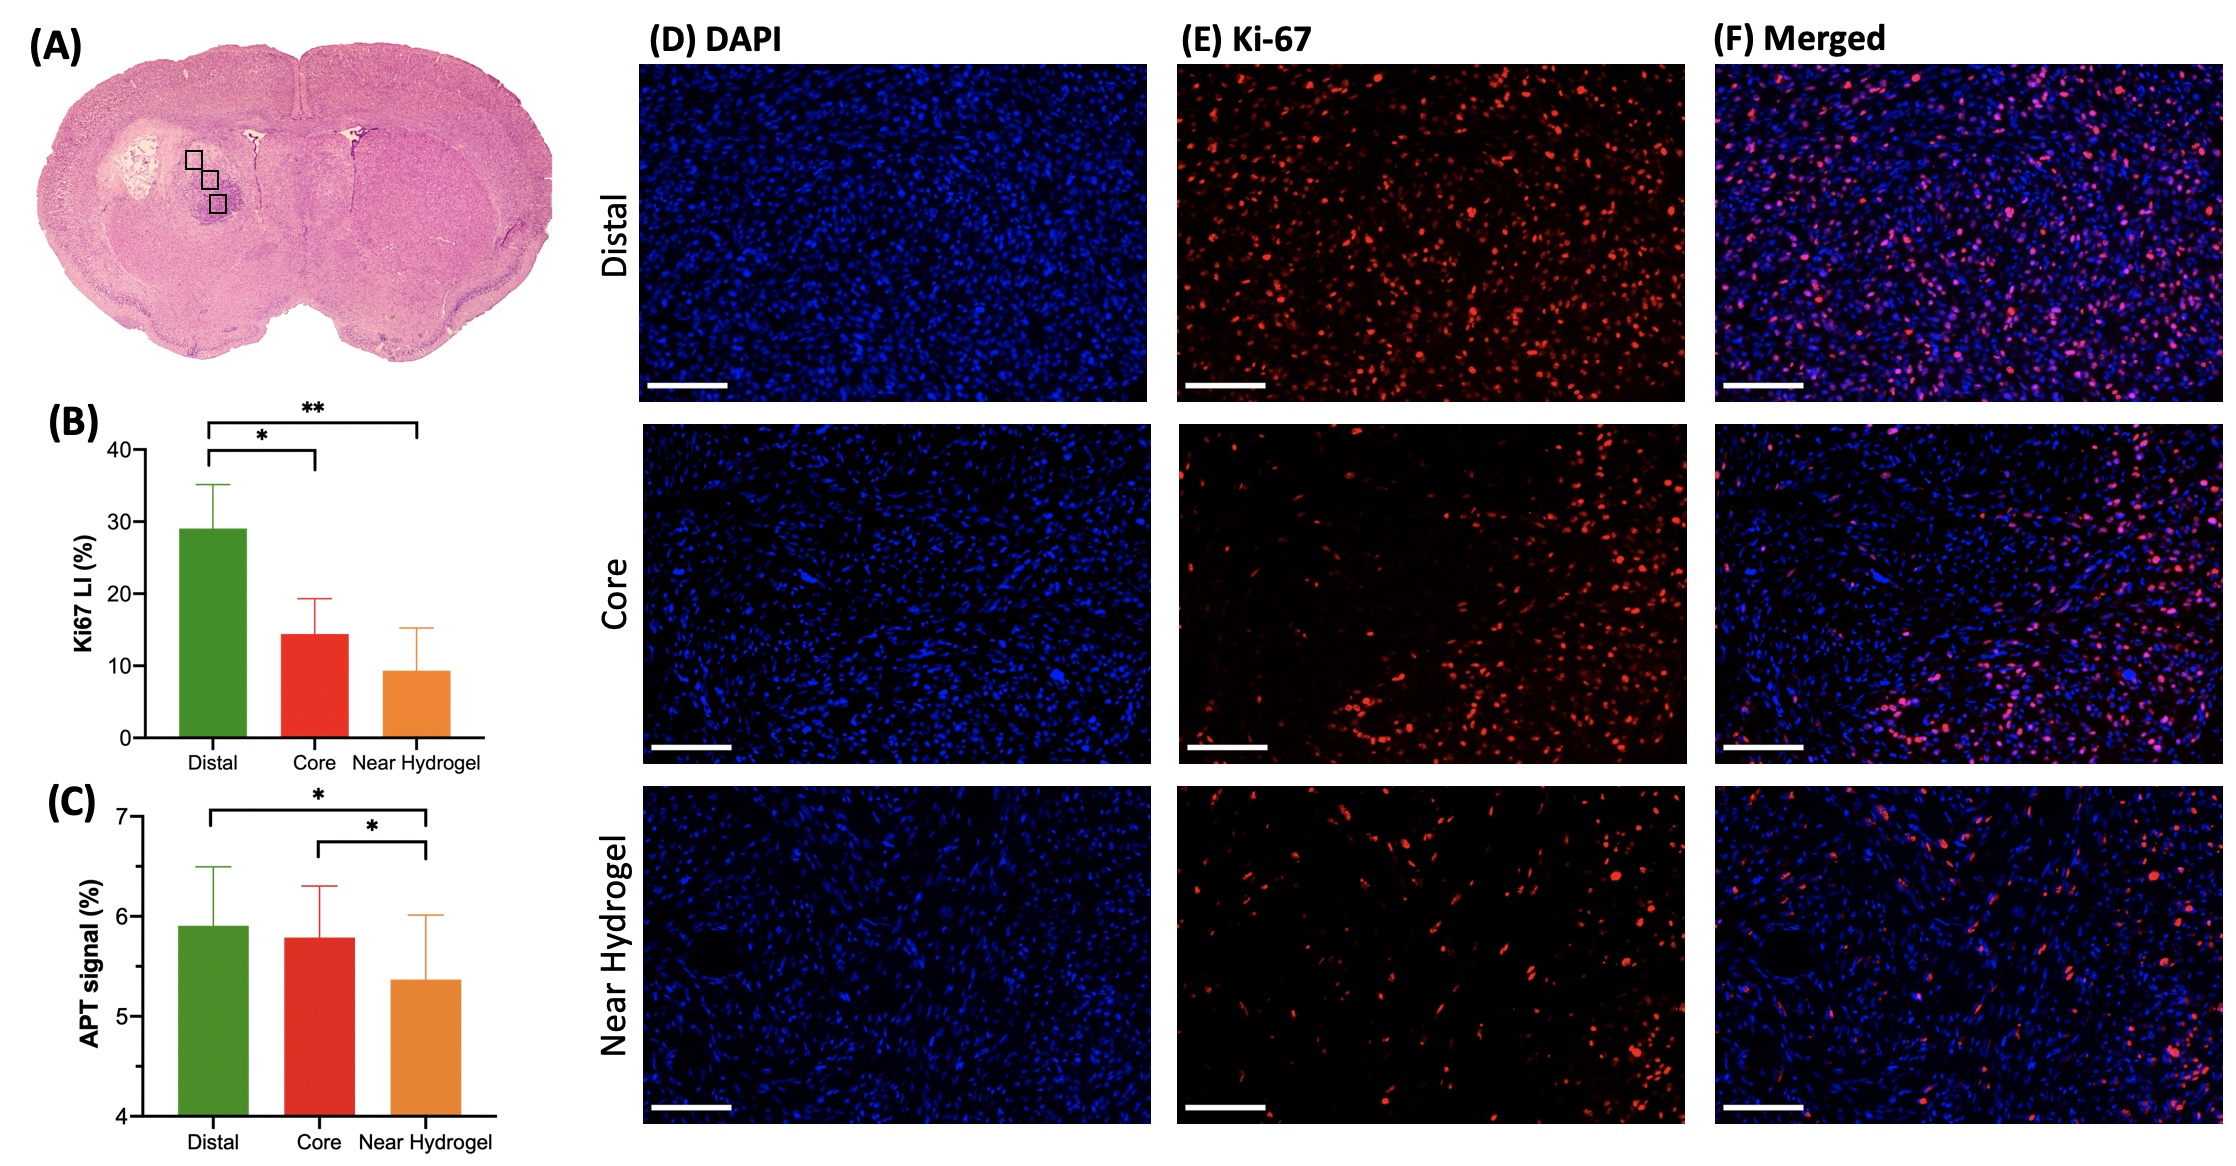
GBM mice were randomly separated into two groups, one with and one without hydrogel treatment. Mice were imaged over 10 days (Fig. 1) and their tumor sizes and CEST signals at 3.5ppm were analyzed. Further to our previous study, which has shown tumor decrease until day 67, we continuously observed reduction in both tumor size and signal at 3.5ppm until day 10 in treatment group (Fig 1C,D). Moreover, at day 10, APT signal was greatly decreased (P=0.074). On the other hand, in control group, tumor size increased and APT signal remained higher than that in treatment group with significant differences from day 3. In histology (Fig. 2), we observed significant differences between the two groups (P=0.0023, 0.0007; Fig 2E, F) in both H&E and Ki-67 staining, which represents cellularity and cell proliferation, respectively. Low cell density and cell proliferation was associated with a decrease in APT signal, as increase in APT signal, which could mainly attributed to increased cellular protein and peptide content4-6 and low pH12, 13. Acidosis is commonly found in extracellular microenvironment in tumor14 and tumor size increase in control group has led APT signal being higher than treatment group. In Fig 2G, a strong positive linear correlation between APT signal and Ki-67 labeling index was observed (R2=0.6283, P=0.0062). This shows that APT signal reflects endogenous mobile proteins and it is highly associated with the cell proliferation. Moreover, in treatment group, Ki-67 showed intratumoral heterogeneity in three different subregions, which were distal, core and near hydrogel region (Fig 3A). Regions near hydrogel showed the lowest Ki-67 expression of 6.7% and distal region from the hydrogel, showed the highest value of 29.1% (Fig 3B). Even though distal region showed the highest Ki-67 expression, it was still lower than that of control group which was 48.8%, indicating that treatment effect was observed in the whole tumor region. The corresponding APT signal also showed significant differences in subregions (P<0.05; Fig 3C). Interestingly, we observed a significant decrease in tumor size on day 5 (Fig. 1C), while we observed a significant change in APT on day 3 (Fig. 1D) between the two groups of mice. This indicates APT could detect early tumor response to the local hydrogel treatment when compared to tumor size. The treatment effect lasted for 10 days, which indicated the sustainable release of chemotherapeutics of our theranostic hydrogel. Thus, APT signal could serve as a noninvasive imaging biomarker for tumor prognosis and early detection in tumor response for local hydrogel treatment.Conclusion
We demonstrated that our theranostic hydrogel had a sustainable treatment effect on GBM, which could be monitored by APT. APT showed a significant decrease on day 3 (P<0.05, Fig. 1C), when there was no significant changes in tumor size (Fig. 1D). APT changes correlated well with the number of proliferative cells (Fig. 2G). In addition, we observed subregional changes in tumor that indicated the different degree of responses toward the treatment. Thus, APT could facilitate the monitoring the early tumor responses in tumor subregions, under local treatment with theranostic hydrogel.Acknowledgements
Authors would like to acknowledge the funding supports from Research Grants Council (11102218, PDFS2122-1S01, 11200422, RFS2223-1S02, C1134-20G); City University of Hong Kong (7005433, 7005626, 9239070, 9609307, 9610560); National Natural Science Foundation China (81871409); Tung Biomedical Sciences Centre; Hong Kong Centre for Cerebro-cardiovascular Health Engineering.References
1. Kartik R, Lee GR, Lee CC, et al. Clinical Prognostic Factors of Survival in Glioblastoma Multiforme. Neurology. 2020;94(15 Supplement):2593.
2. Xavier-Magalhães A, Nandhabalan M, Jones C, et al. Molecular prognostic factors in glioblastoma: state of the art and future challenges. CNS Oncol. 2013;2(6):495-510.
3. Zhou J, Tryggestad E, Wen Z, et al. Differentiation between glioma and radiation necrosis using molecular magnetic resonance imaging of endogenous proteins and peptides. Nat Med. 2011;17(1):130-4.
4. Zhou J, Lal B, Wilson DA, et al. Amide proton transfer (APT) contrast for imaging of brain tumors. Magnetic Resonance in Medicine. 2003;50(6):1120-1126.
5. Zhou J, Payen J-F, Wilson DA, et al. Using the amide proton signals of intracellular proteins and peptides to detect pH effects in MRI. Nature Medicine. 2003;9(8):1085-1090.
6. Zhou J, Zaiss M, Knutsson L, et al. Review and consensus recommendations on clinical APT-weighted imaging approaches at 3T: Application to brain tumors. Magnetic Resonance in Medicine. 2022;88(2):546-574.
7. Park SW, Lai JHC, Han X, et al. Developing CEST-detectable liposomal hydrogel for monitoring local brain tumor treatment. ISMRM & SMRT Virtual Conference & Exhibition. 2022. #3580.
8. Han X, Huang J, To AKW, et al. CEST MRI detectable liposomal hydrogels for multiparametric monitoring in the brain at 3T. Theranostics. 2020;10(5):2215-2228.
9. Han X, Lai JHC, Huang J, et al. Imaging Self-Healing Hydrogels and Chemotherapeutics Using CEST MRI at 3 T. ACS Applied Bio Materials. 2021;4(7):5605-5616.
10. Ortega S, Halicek M, Fabelo H, et al. Hyperspectral Imaging for the Detection of Glioblastoma Tumor Cells in H&E Slides Using Convolutional Neural Networks. Sensors (Basel). 2020;20(7)
11. Li LT, Jiang G, Chen Q, et al. Ki67 is a promising molecular target in the diagnosis of cancer (Review). Mol Med Rep. 2015;11(3):1566-1572.
12. Sagiyama K, Mashimo T, Togao O, et al. In vivo chemical exchange saturation transfer imaging allows early detection of a therapeutic response in glioblastoma. Proceedings of the National Academy of Sciences. 2014;111(12):4542-4547.
13. Krikken E, van der Kemp WJM, Khlebnikov V, et al. Contradiction between amide-CEST signal and pH in breast cancer explained with metabolic MRI. NMR Biomed. 2019;32(8):e4110.
14. Pillai SR, Damaghi M, Marunaka Y, et al. Causes, consequences, and therapy of tumors acidosis. Cancer Metastasis Rev. 2019;38(1-2):205-222.
Figures