0253
Alternating Look-Locker for 3D quantitative longitudinal and rotating frame relaxation mapping1CMRR and Department of Radiology, University of Minnesota, Minneapolis, MN, United States, 2University of Minnesota, Minneapolis, MN, United States
Synopsis
Keywords: High-Field MRI, Relaxometry, T1ρ
A new method entitled alternating Look-Locker (aLL) for mapping of T1 and T1ρ is proposed. Magnetization preparation modules incorporating adiabatic full passage pulses were imbedded in a Look-Locker scheme that additionally alternates magnetization from +Z and -Z axes. MB-SWIFT was used as a readout. Analytical derivations and relevant simulations are presented. Phantom experiments and in vivo studies in the rat brain were conducted at 9.4 T. Results show that aLL allows more robust and faster acquisitions as compared to previously introduced steady–state technique, providing the possibility of simultaneous collection of T1 and T1ρ maps in one acquisition.Introduction
In this study, we developed a new method focused on T1 and T1ρ mapping. The method is entitled alternating Look-Locker (aLL), and is based on the combination of two known approaches. First is Look-Locker method[1,2]. The second approach, proposed in [3], improves the quality of mapping due to combination of two experiments with the positive and negative initial magnetization. Here, we present the simulated and experimental data collected at 9.4T with MB-SWIFT utilized as a readout. We furthermore compare results obtained with aLL technique and SS-SWIFT method [4] in in vivo rat’s brain and Gd-DTPA phantoms used for the relaxivity analysis.Method
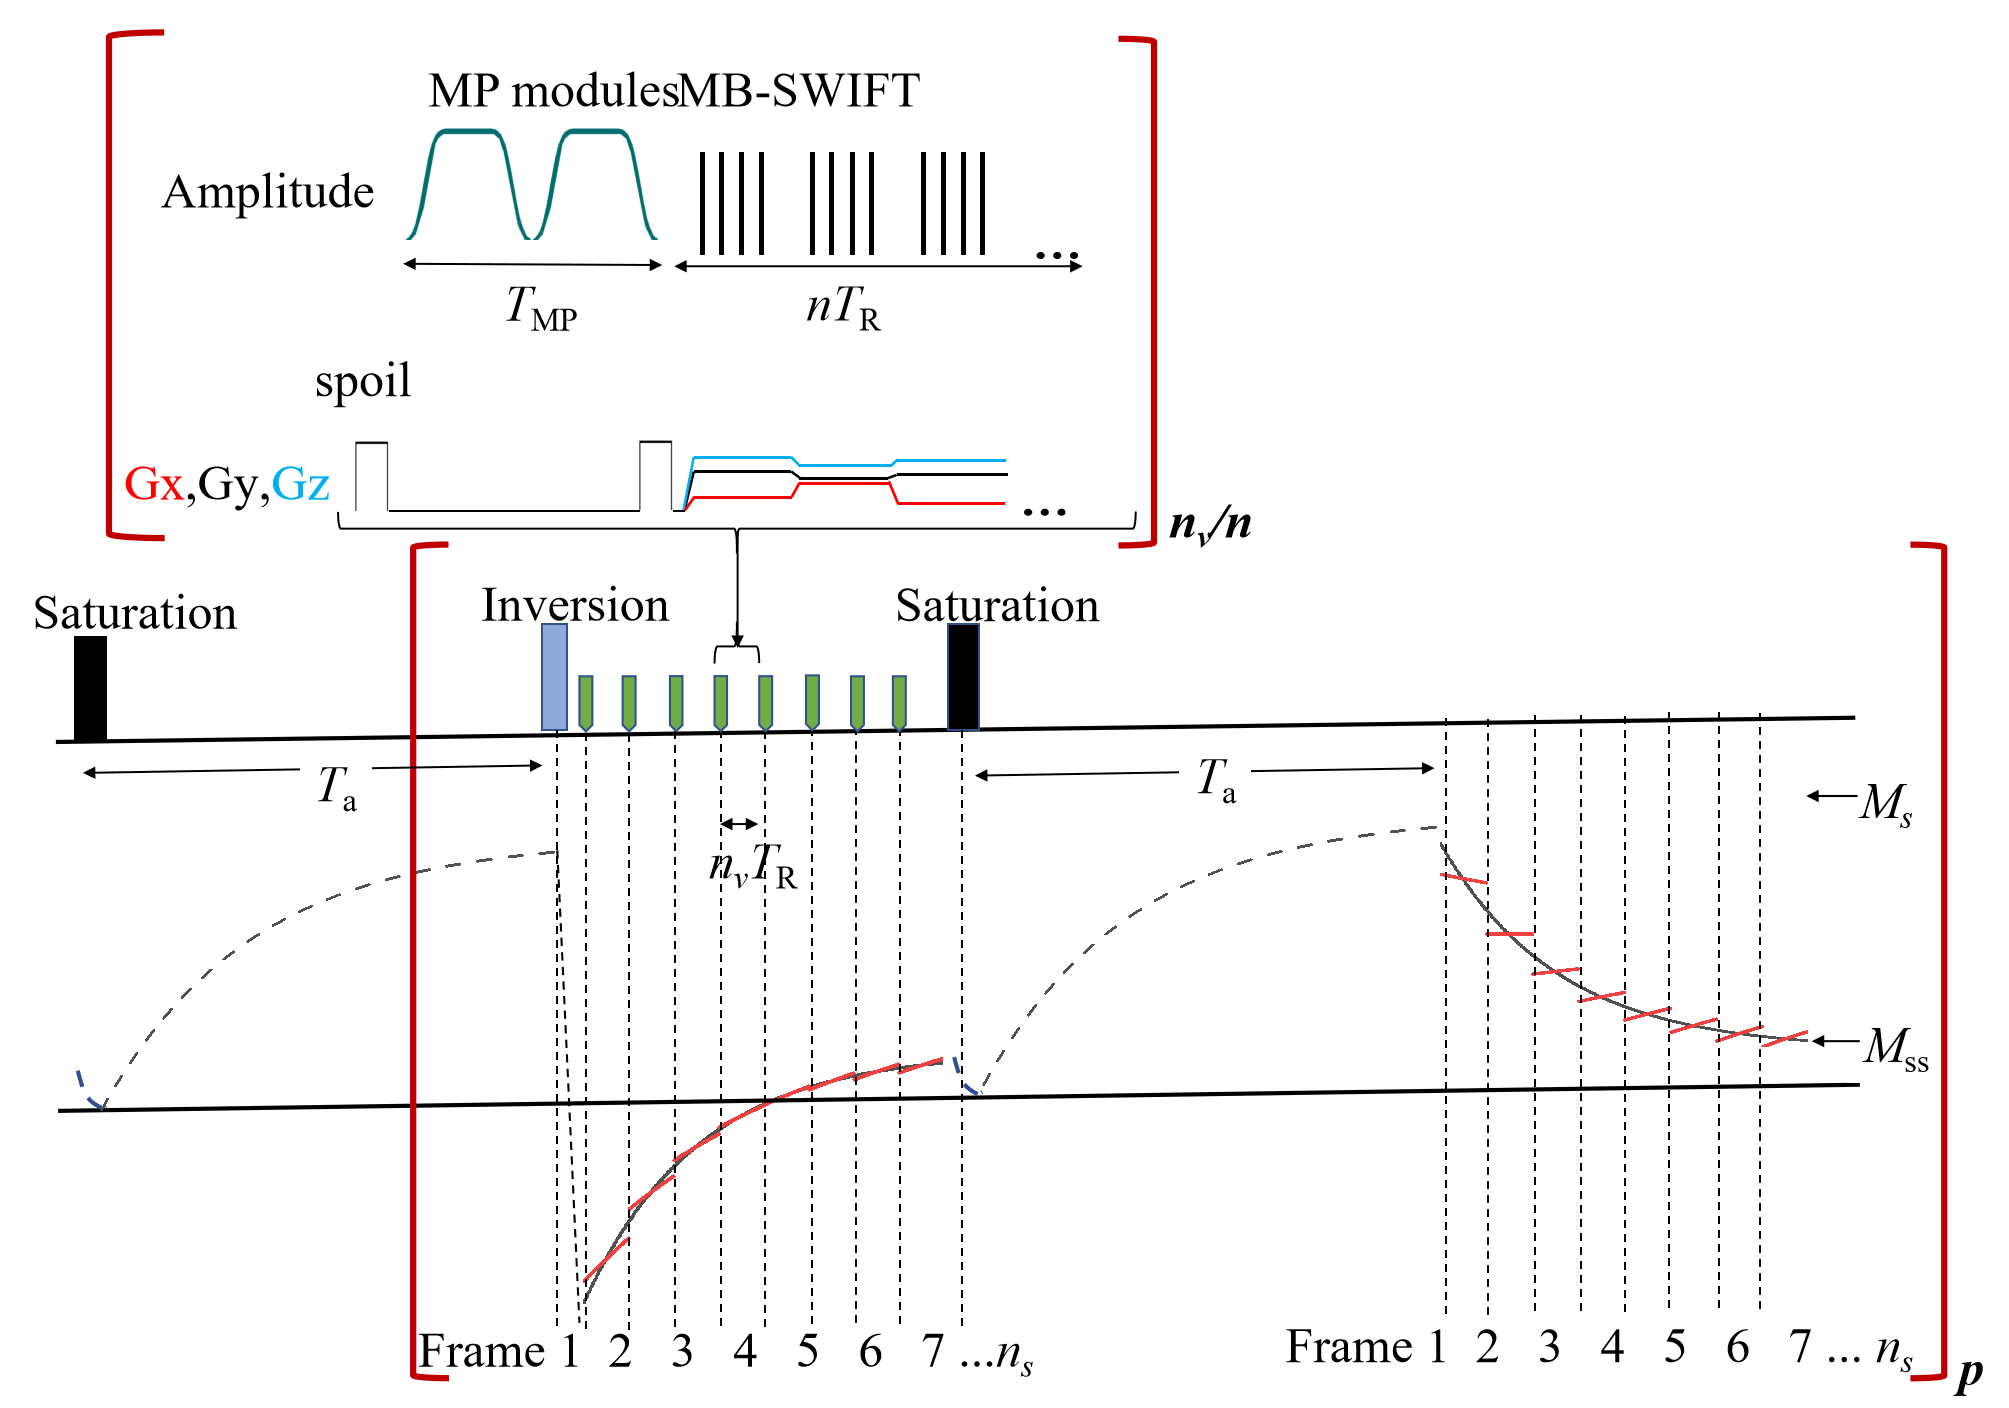
The schematic of aLL method utilizing MB-SWIFT readout is illustrated in Fig.1. The LL acquisition of magnetization evolution from negative values starts after adiabatic inversion pulse. An acquisition is performed by a segmented collection of ns image volumes during evolution of magnetization towards steady-state[5]. Each segment consists of nv k-space readouts. During each segment, MP modules, separated by n readouts satisfying $$$n\leq{n_v}$$$, are applied. Each MP module consists of two AFP pulses, rotating magnetization by 360 degrees and providing an adiabatic T1ρ relaxation $$$E_{mp}=exp(-T_{MP}/T_{1ρ})$$$. After the acquisition of the last segment, the Z magnetization is again fully saturated, and after Ta a similar LL acquisition is repeated without application of the inversion pulse.There are two sets of data, collected by averaging each of n readouts, starting evolution of magnetization at negative (MN) and positive (MP) hemispheres:
$$\overline{M_N(i)}≈p(M_{ss}-(M_{ss}+M_s)qE_{eff}^i ).........(1a)$$
$$\overline{M_P(i)}≈p(M_{ss}-(M_{ss}-M_s)qE_{eff}^i ).........(1b)$$
where $$$M_s=M_0^*(1-E_a)$$$ and $$$ M_0^*=M_0\sin\theta$$$, M0 is equilibrium magnetization, 𝜃 is flip angle, $$$E_a=exp(-T_a/T_1)$$$, $$$E_{eff}=exp(-T_R/T_{eff})$$$, $$$M_{ss}=M_0^*\frac{1-E_1}{1-E_{FA}E_1}\frac{1-(E_{FA}E_1)^n}{1-E_{eff}^n}$$$ is steady-state magnetization, $$$E_1=exp(-T_R/T_1)$$$ and $$$E_{FA}=\cos\theta$$$. Here the coefficient $$$p=(1+E_{MP})/2$$$ corrects for the steps during magnetization evolution created by MP modules. Another coefficient q corrects for segmented averaging of the exponential function: $$$q=T_{eff}(E_{eff}^\frac{-n}{2}-E_{eff}^\frac{n}{2})/(nT_R)$$$.
A simultaneous three-parameter fitting using Eqs.1 provides values of Teff, Mss and Ms and T1 evaluated from:
$$T_1(1-E_a)\frac{1-E_{FA}E_1}{1-(E_{FA}E_1)^n}=\frac{M_sT_R}{M_{ss}(1-E_{eff}^n)}........(2)$$
Then T1ρ is determined from
$$T_{eff}=(\frac{1}{T_1}-\frac{\ln\cos\theta}{T_R}+\frac{T_{MP}}{T_{1ρ}T_Rn})^{-1}........(3)$$
For comparison, the known SS method [4] which allows to extract T1ρ map from Mss acquired with different TMP values was used.
The in vivo study was carried out with 6 Sprague-Dawley rats which were anesthetized using isoflurane for the duration of MRI in a 9.4T 31-cm horizontal-bore magnet equipped with Agilent console (Palo Alto, CA, USA) using a quadrature volume transmit/receive coil.
In both aLL and SS methods, MP modules have the same AFP pulses, namely hyperbolic secant HS4 pulses [6] (4 is the stretching factor) with time-bandwidth product R=20, length of 3ms and peak power of 2kHz. In both methods following parameters were used: TR=4.396ms, TMP=6ms, $$$\theta=4^\circ$$$ with FOV 24x24x30mm3, nv=120 to 200, n=40 or 50, ns=6. Total number of readouts was Ntot=nvm=32000 to 40000 for aLL, Ntot was generally 80000 for SS method, other than in one case for which Ntot =40000 was used to allow fair comparisons with aLL at same SNR. Total time of acquisition of the aLL method was around 45 mins. For SS method, two experiments were conducted with nMP =0,1 with each acquisition being 8 -10 mins for each nMP preparation block, resulting in a total scan time around 20 mins without counting the additional time needed for collecting T1 map used by SS method to obtain T1ρ map.
The phantom consisted of 4 plastic tubes filled with 5% weighted agar and different concentrations of gadobenate dimeglumine (Gd-DTPA, multihance, manufactured for Bracco Diagnostics). All imaging parameters were the same as in in vivo study except the total number of readouts was nv=80, Ntot=11200.
Result
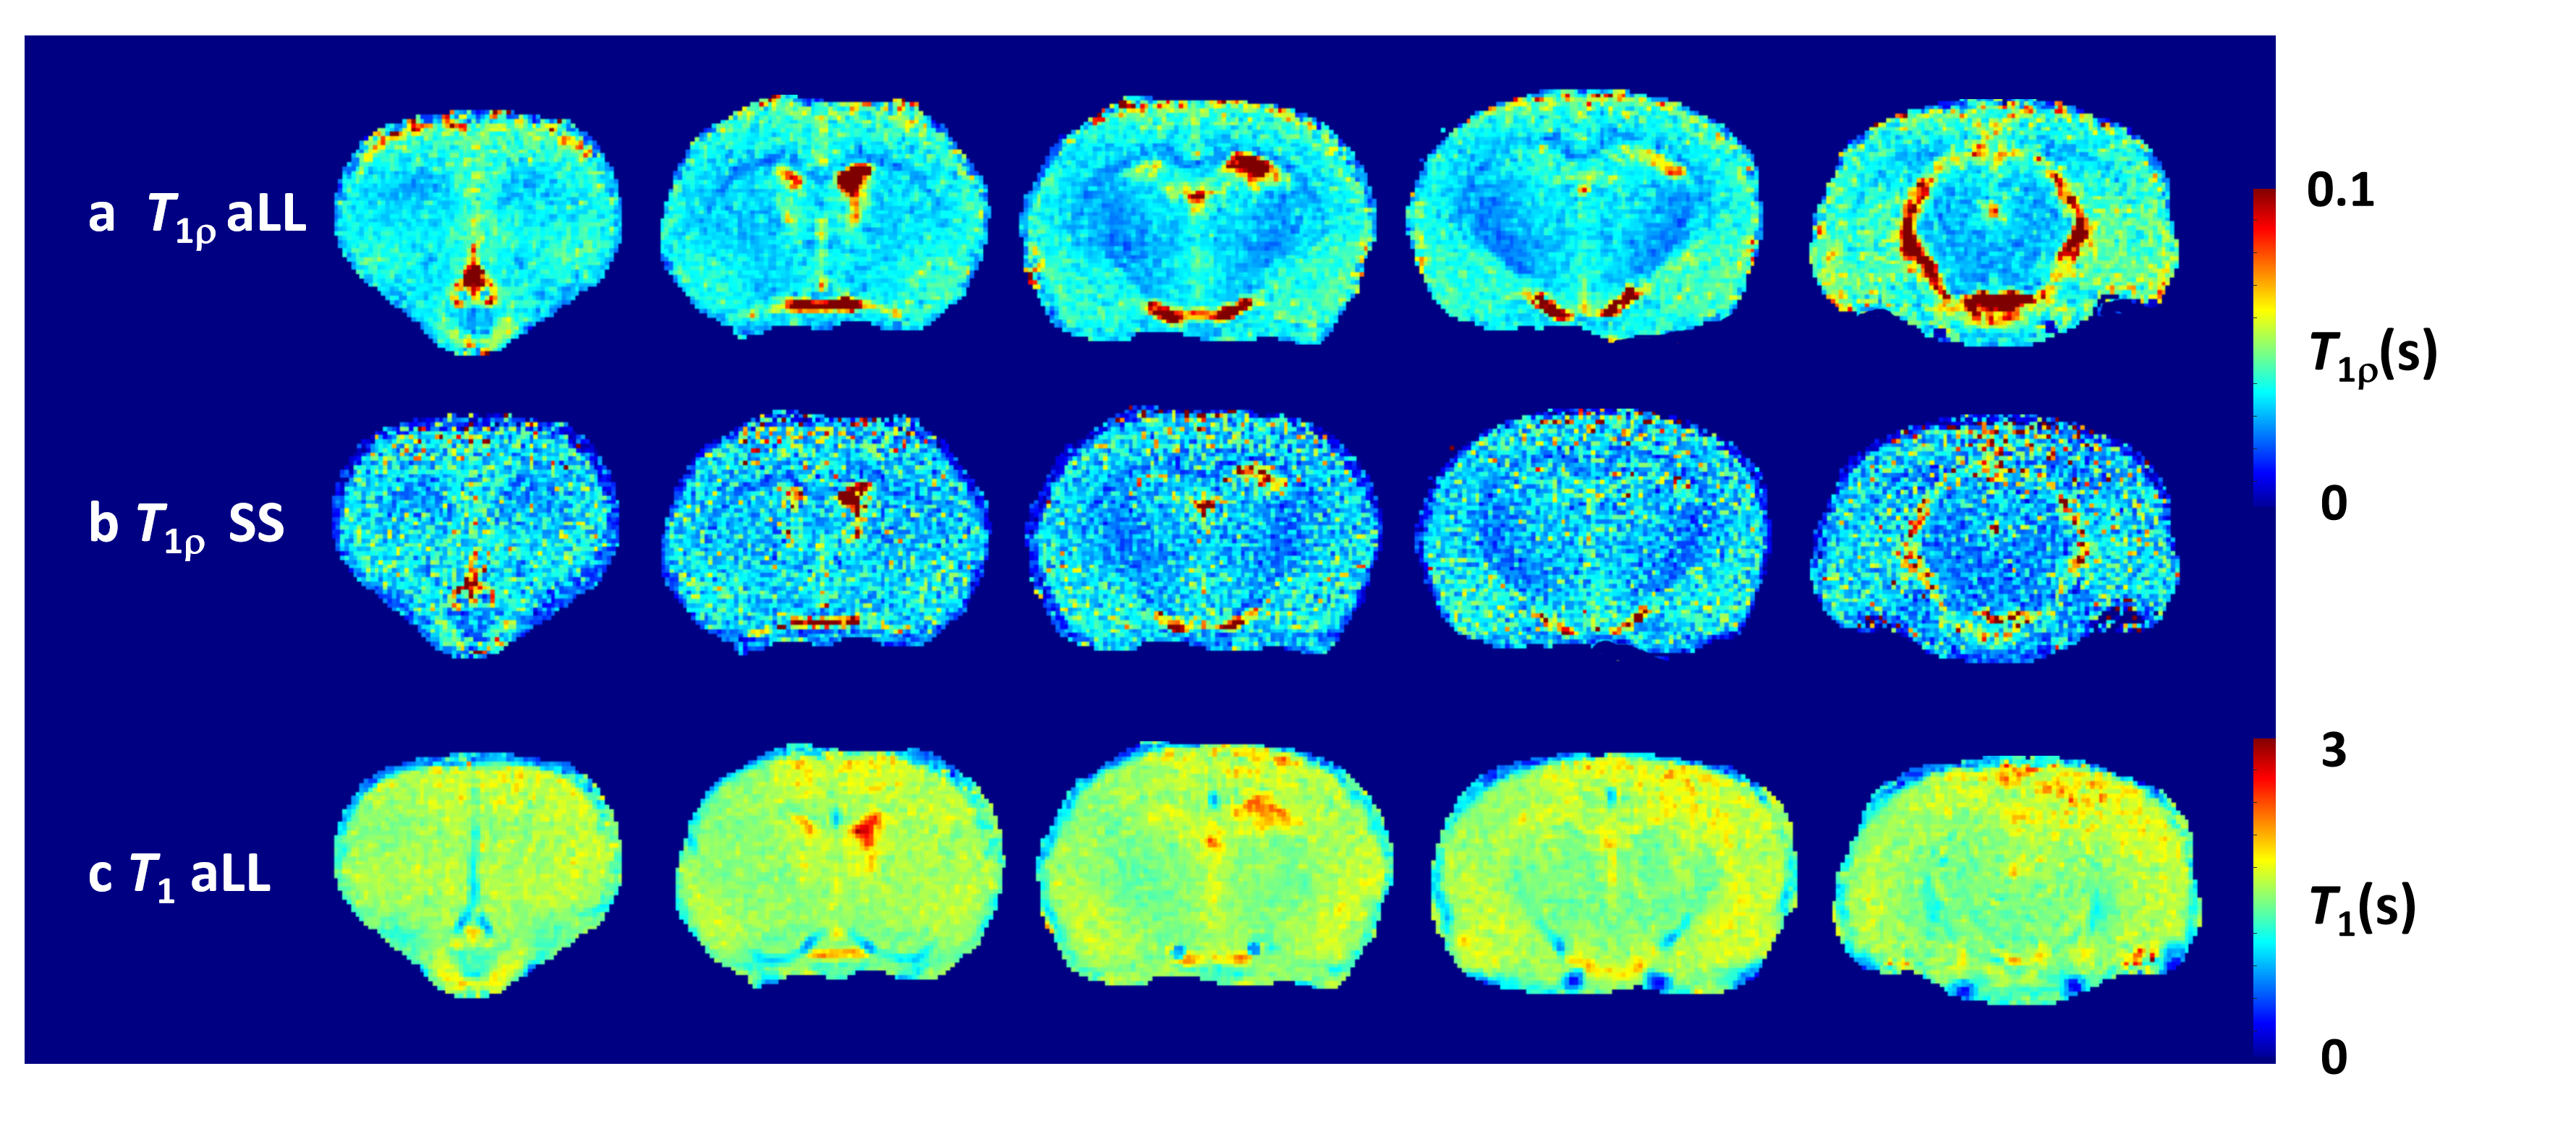
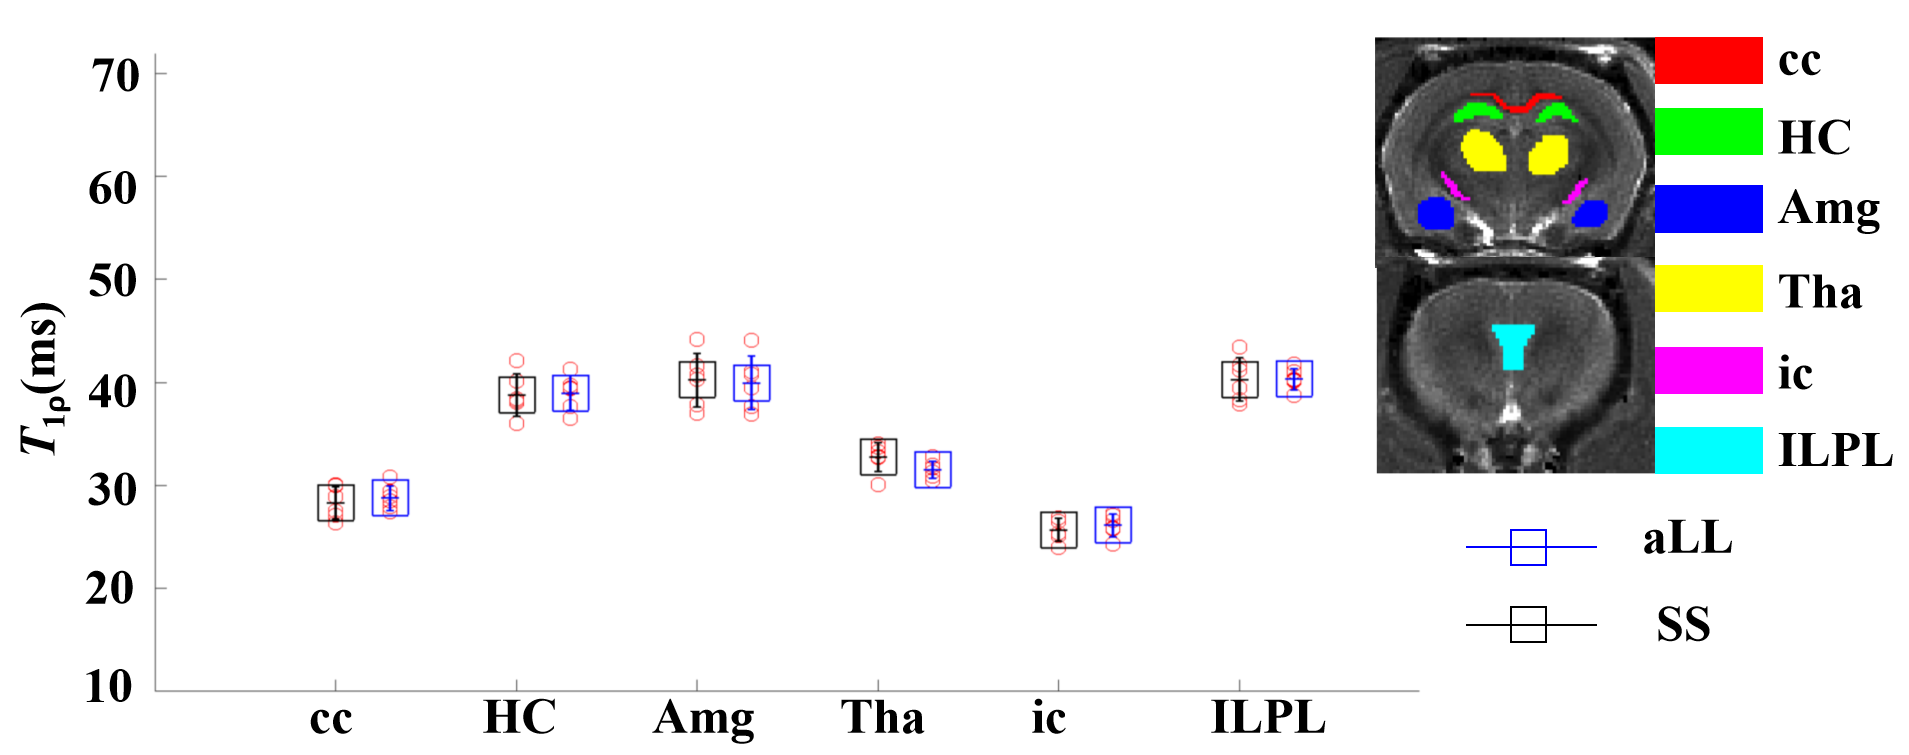
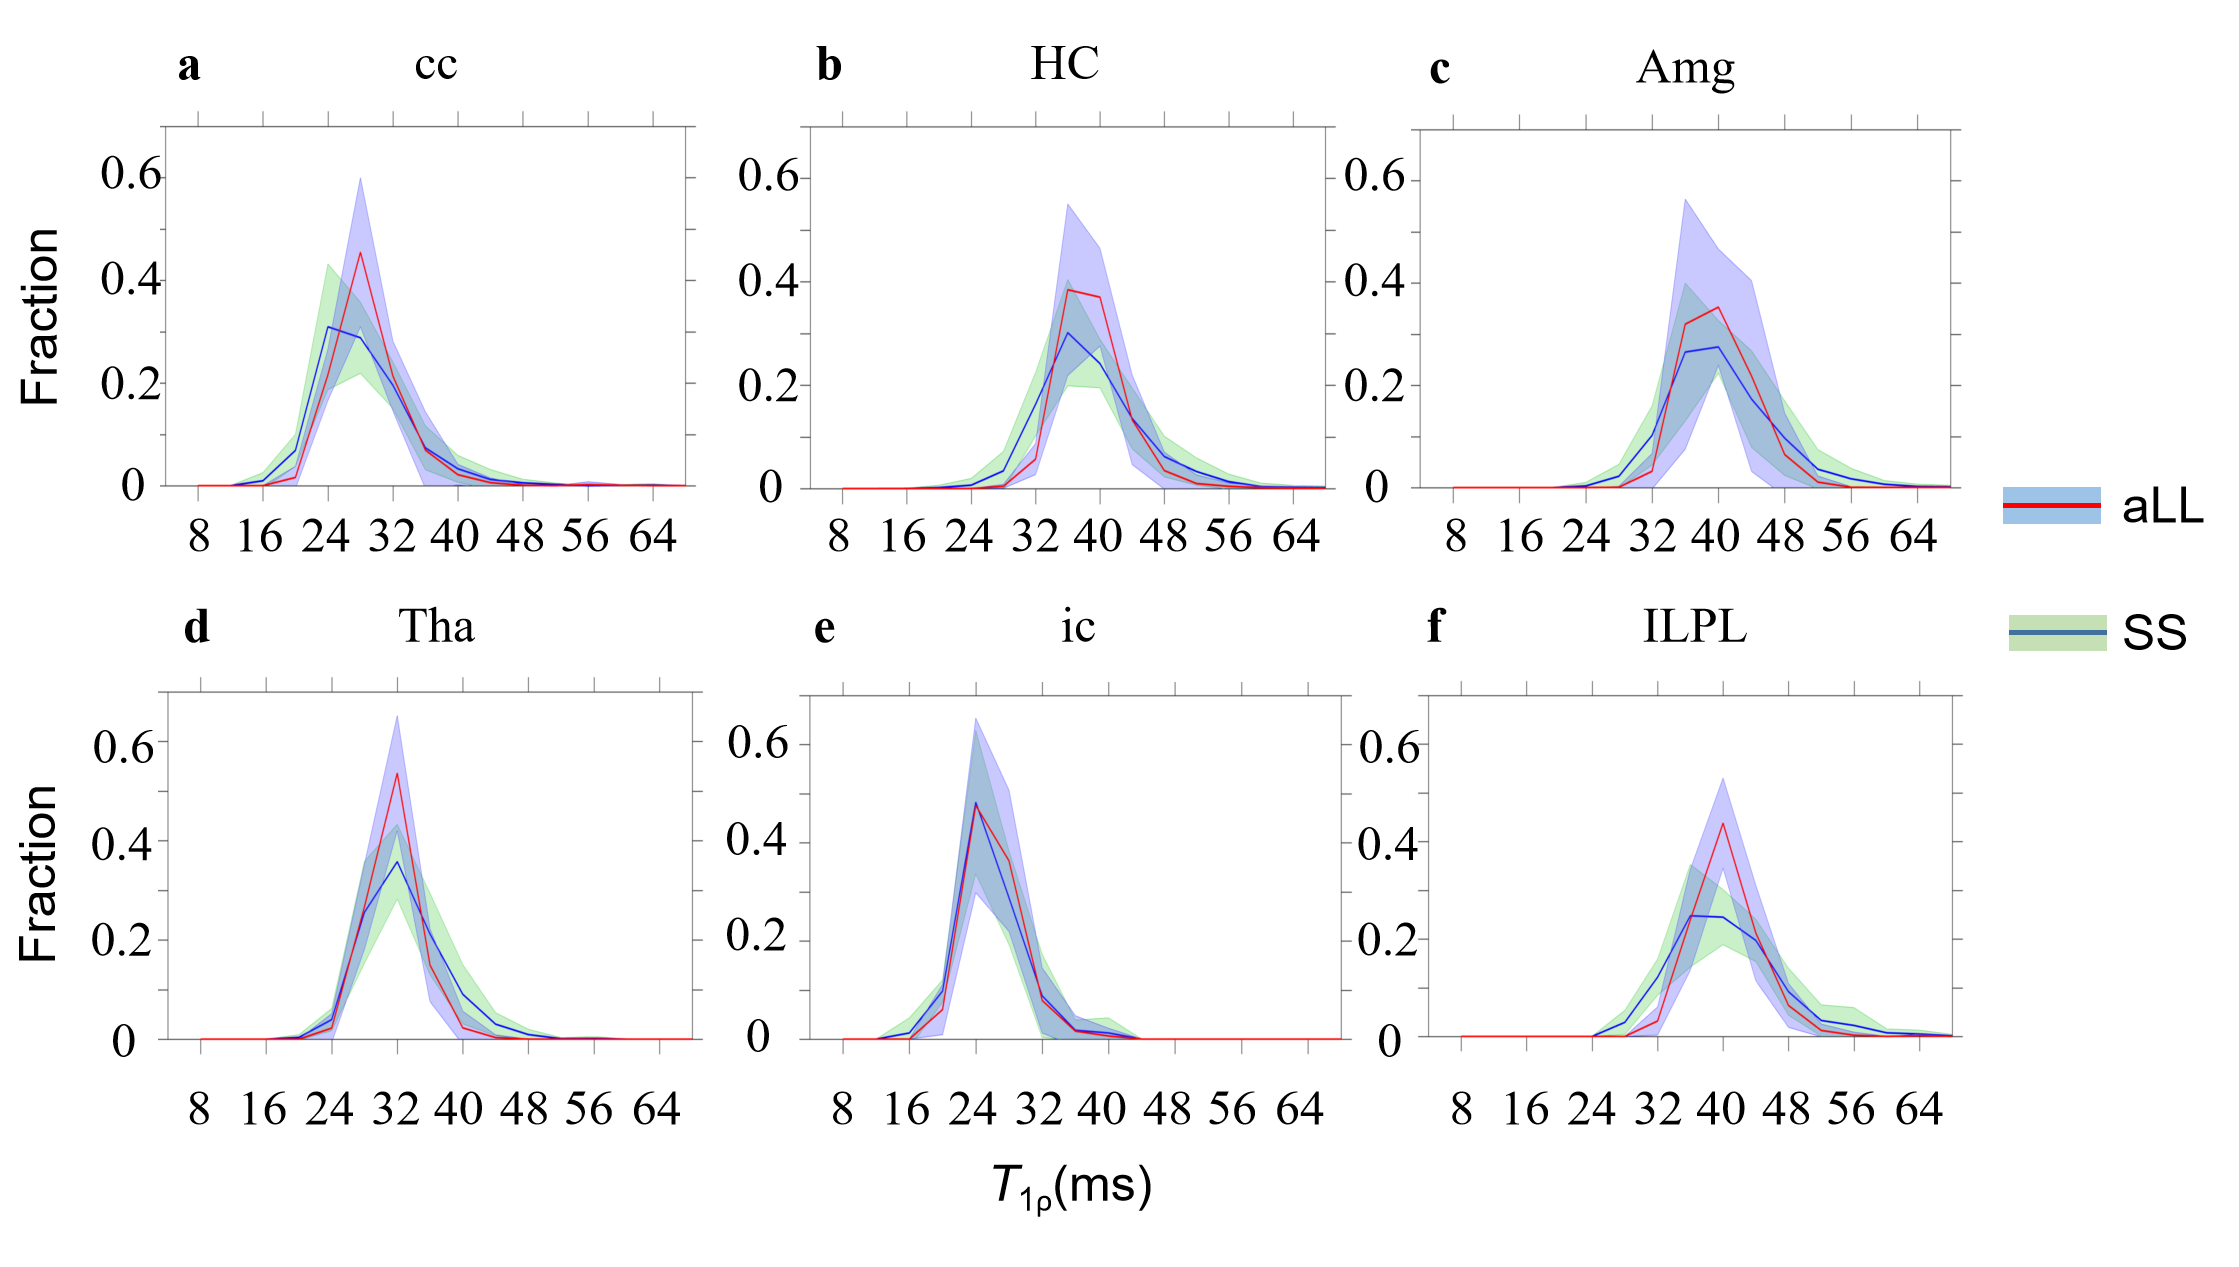
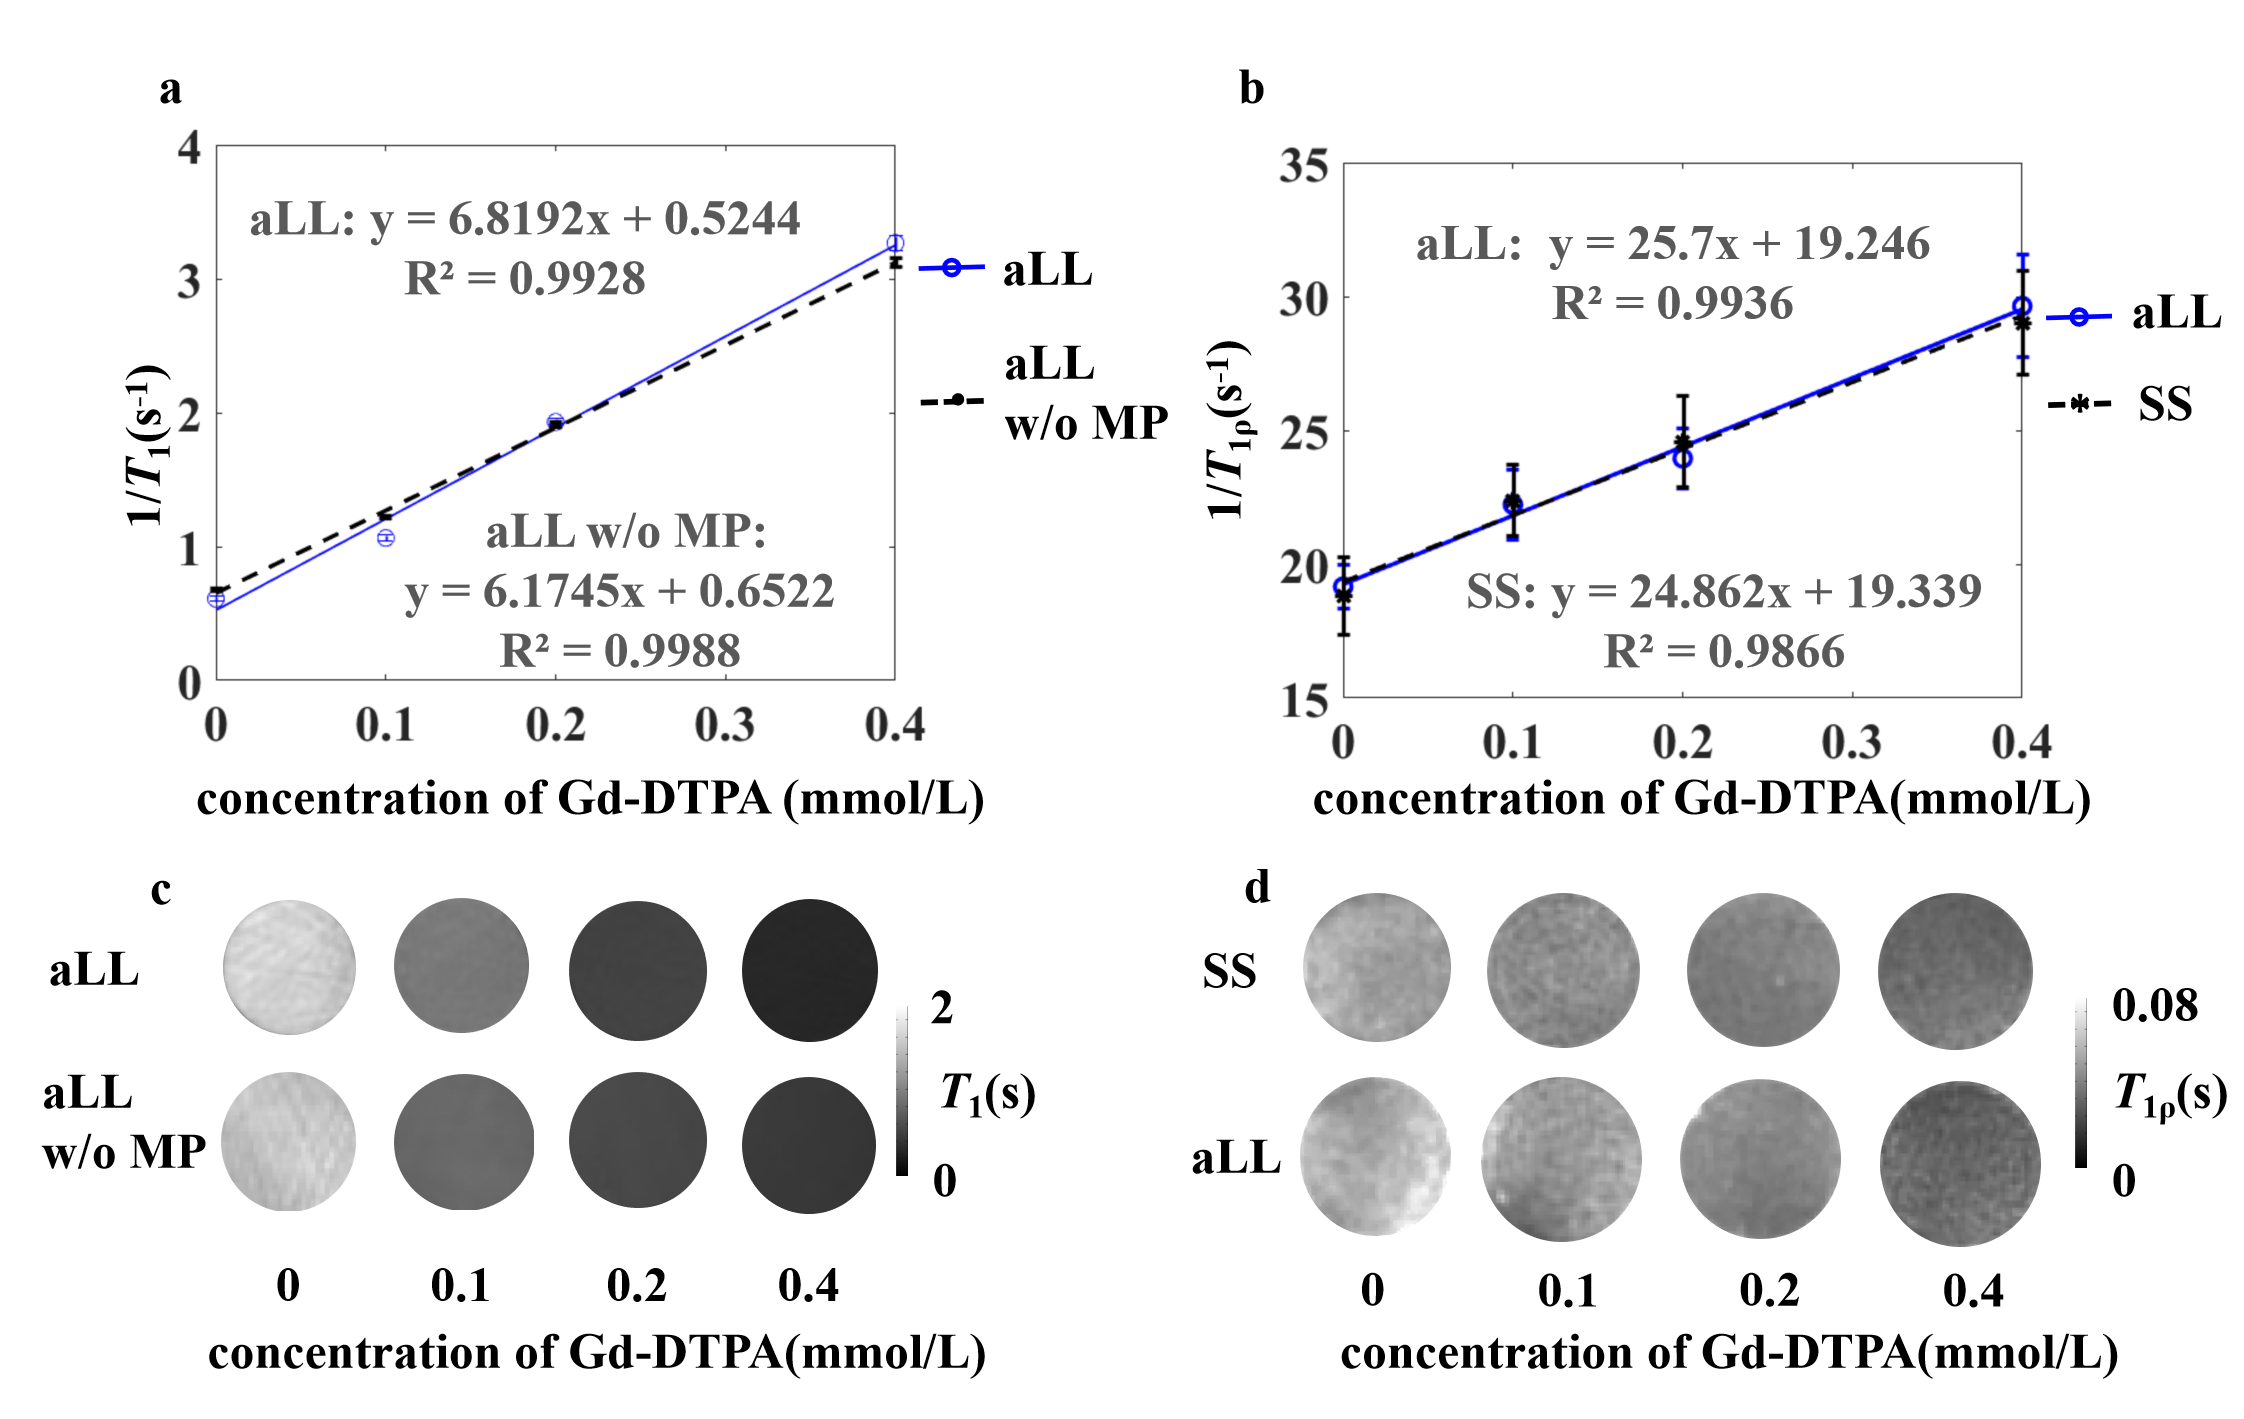
The in vivo T1ρ maps obtained with aLL and SS methods are displayed in Fig.2. The maps obtained with aLL method’ (Fig.2a) are less noisy relative to maps collected with SS method using similar set of acquisition parameters. Regions of interest (ROI) analysis revealed similar T1ρ mean values in ROIs among the two methods (Fig.3), however std in general were smaller for aLL technique as compared to SS method. The relaxograms of T1ρ values within the ROIs (Fig. 4) largely overlapped among the two methods, confirming similarity of T1ρ values. However, the relaxogram of aLL method exhibited narrower distribution in Tha and IL/PL suggesting more robust outcomes.The 1/T1ρ and 1/T1 dependencies on Gd-DTPA concentration on phantom are shown in Fig.5. The 1/T1ρ values increased linearly with concentration of Gd-DTPA [7] and both methods show similar results.
Discussion
The proposed aLL method allows simultaneous 3D T1 and T1ρ mapping, is faster than known steady-state method [4], and could be generalized to other rotating frame relaxation contrasts. Instead of MB-SWIFT, any other zero-TE sequences like ZTE or UTE could be utilized. The echo-based sequences like FLASH also could be utilized, but the spectrum of the resulting T1ρ map, in this case, would be narrower and shifted to larger relaxation times. Notably, the alternating scheme introduced in the Look-Locker method allowed improving the SNR, the fitting stability and its precision. Future acceleration can be done with a view sharing, compressed sensing or/and parallel imaging techniques.Conclusion
A new method entitled aLL has been developed. This method provides robust and efficient simultaneous T1 and T1ρ mapping in vivo and could be generalized for mapping of other relaxation contrasts.Acknowledgements
This work was supported by NIH grant P41 EB027061 (Supplement)References
1. Deichmann R, Hahn D, Haase A. Fast T1 mapping on a whole-body scanner. Magn Reson Med. 1999;42(1):206-9.
2. Look DC, Locker DR. Time Saving in Measurement of NMR and EPR Relaxation Times. Rev Sci Instrum. 1970;41(2):250-1.
3. Mangia S, De Martino F, Liimatainen T, et al. Magnetization transfer using inversion recovery during off-resonance irradiation. Magn Reson Imaging. 2011;29(10):1346-50.
4. Zhang J, Nissi MJ, Idiyatullin D, et al. Capturing fast relaxing spins with SWIFT adiabatic rotating frame spin–lattice relaxation (T1ρ) mapping. NMR Biomed. 2016;29(4):420-30.
5. Zhang J, Chamberlain R, Etheridge M, et al. Quantifying iron-oxide nanoparticles at high concentration based on longitudinal relaxation using a three-dimensional SWIFT look-locker sequence. Magn Reson Med. 2014;71(6):1982-8.
6. Garwood M, DelaBarre L. The return of the frequency sweep: designing adiabatic pulses for contemporary NMR. J Magn Reson. 2001;153:155-77.
7. Aronen HJ, Ramadan UA, Peltonen TK, et al. 3D spin-lock imaging of human gliomas. 1999;17(7):1001-10.
Figures