0249
AI-enhanced comprehensive quiet neuroimaging1GE Healthcare, Munich, Germany, 2King's College London, London, United Kingdom, 3GE Healthcare, Marietta, GA, United States, 4GE Healthcare, Houston, TX, United States, 5GE Healthcare, Calgary, AB, Canada
Synopsis
Keywords: Pulse Sequence Design, MR Value, Neuro, quiet, multicontrast, fMRI, QSM
Most of today’s MRI scans are very loud and can be challenging for patients of all ages, e.g. sleeping babies, anxious children or elderly with tinnitus. Existing quiet and/or acoustic noise reduced MRI scanning solutions are in their infancy, primarily because of their incomplete nature and associated trade-offs in terms of image quality and/or scan time. Here, we present a comprehensive quiet neuroimaging solution, including standard anatomical scans (localizer, T1w-MPRAGE, T2w-FSE, T2w-FLAIR, MRA, Diffusion), quantitative parameter mapping (ADC, T2*, QSM, PD, T1, T2) and functional BOLD-fMRI. Scan time and overall image quality was improved using DL-based image reconstruction framework.Introduction
Acoustic noise in the MRI scanner is one of the most frequent patient complaints and impedes scanning in some patient cohorts, e.g. hypersensitive autistic participants or tinnitus patients. Most MRI manufacturers support a “quiet scanning” mode, typically using standard pulse sequences but with derated gradient performance for smoother temporal changes [1] or by minimizing gradient switching using different implementations of zero TE (ZTE) pulse sequences [2]. Currently, quiet and/or acoustic noise reduced MRI scanning solutions are still in their infancy, primarily because of their incomplete nature and associated trade-offs in terms of image quality and/or scan time. Here we present a comprehensive quiet neuroimaging solution, including standard anatomical scans (localizer, T1w-MPRAGE, T2w-FSE, T2w-FLAIR, MRA and Diffusion), quantitative parameter mapping (ADC, T2*, QSM, SWI, PD, T1 and T2), functional BOLD-fMRI, as well as quiet calibration and prescan optimizations. Scan time and overall image quality was improved by complementing the quiet MR acquisition with DL-based image reconstruction framework [3].Methods
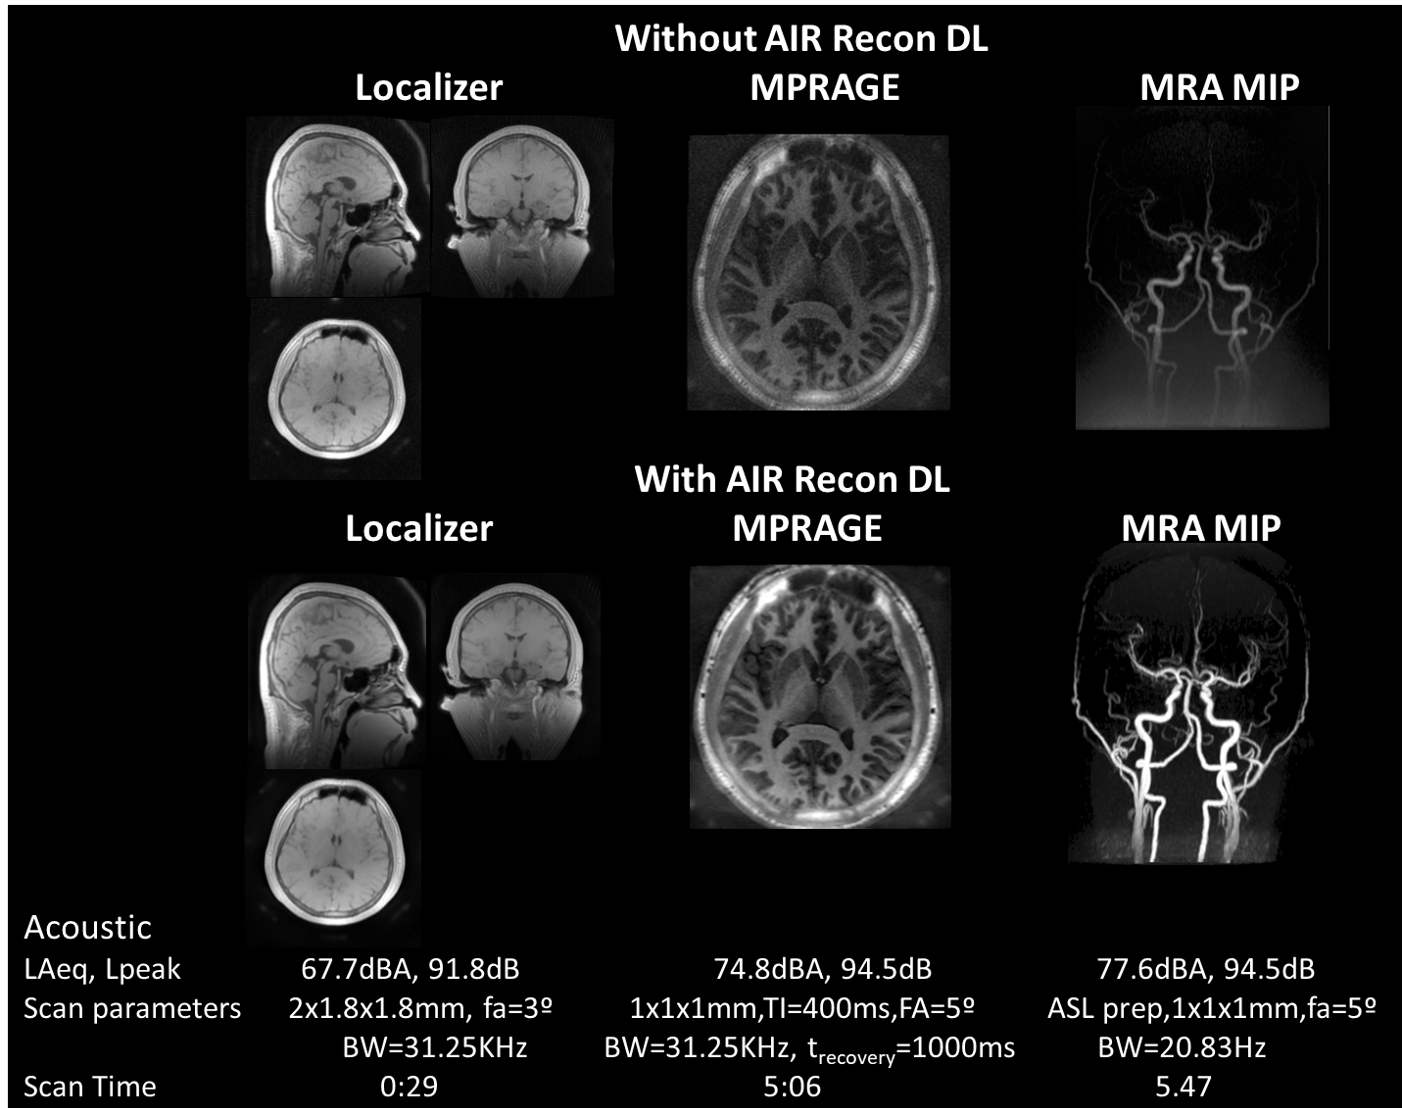
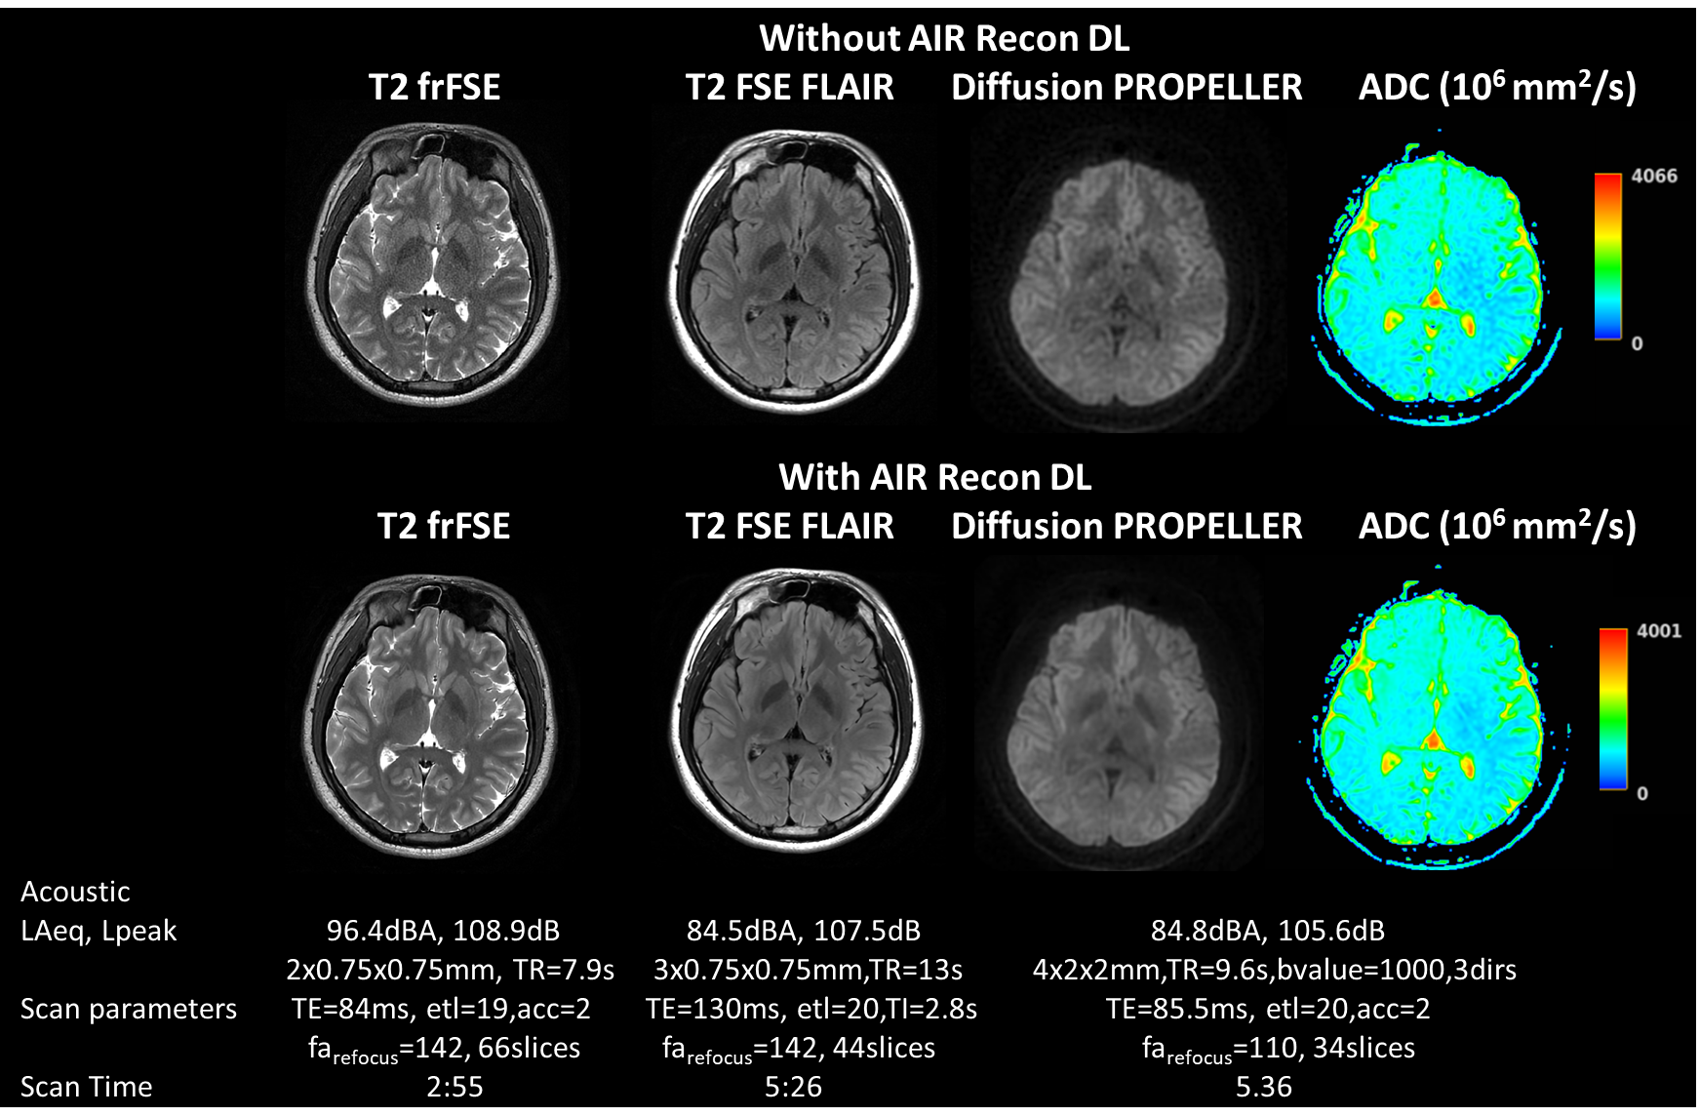
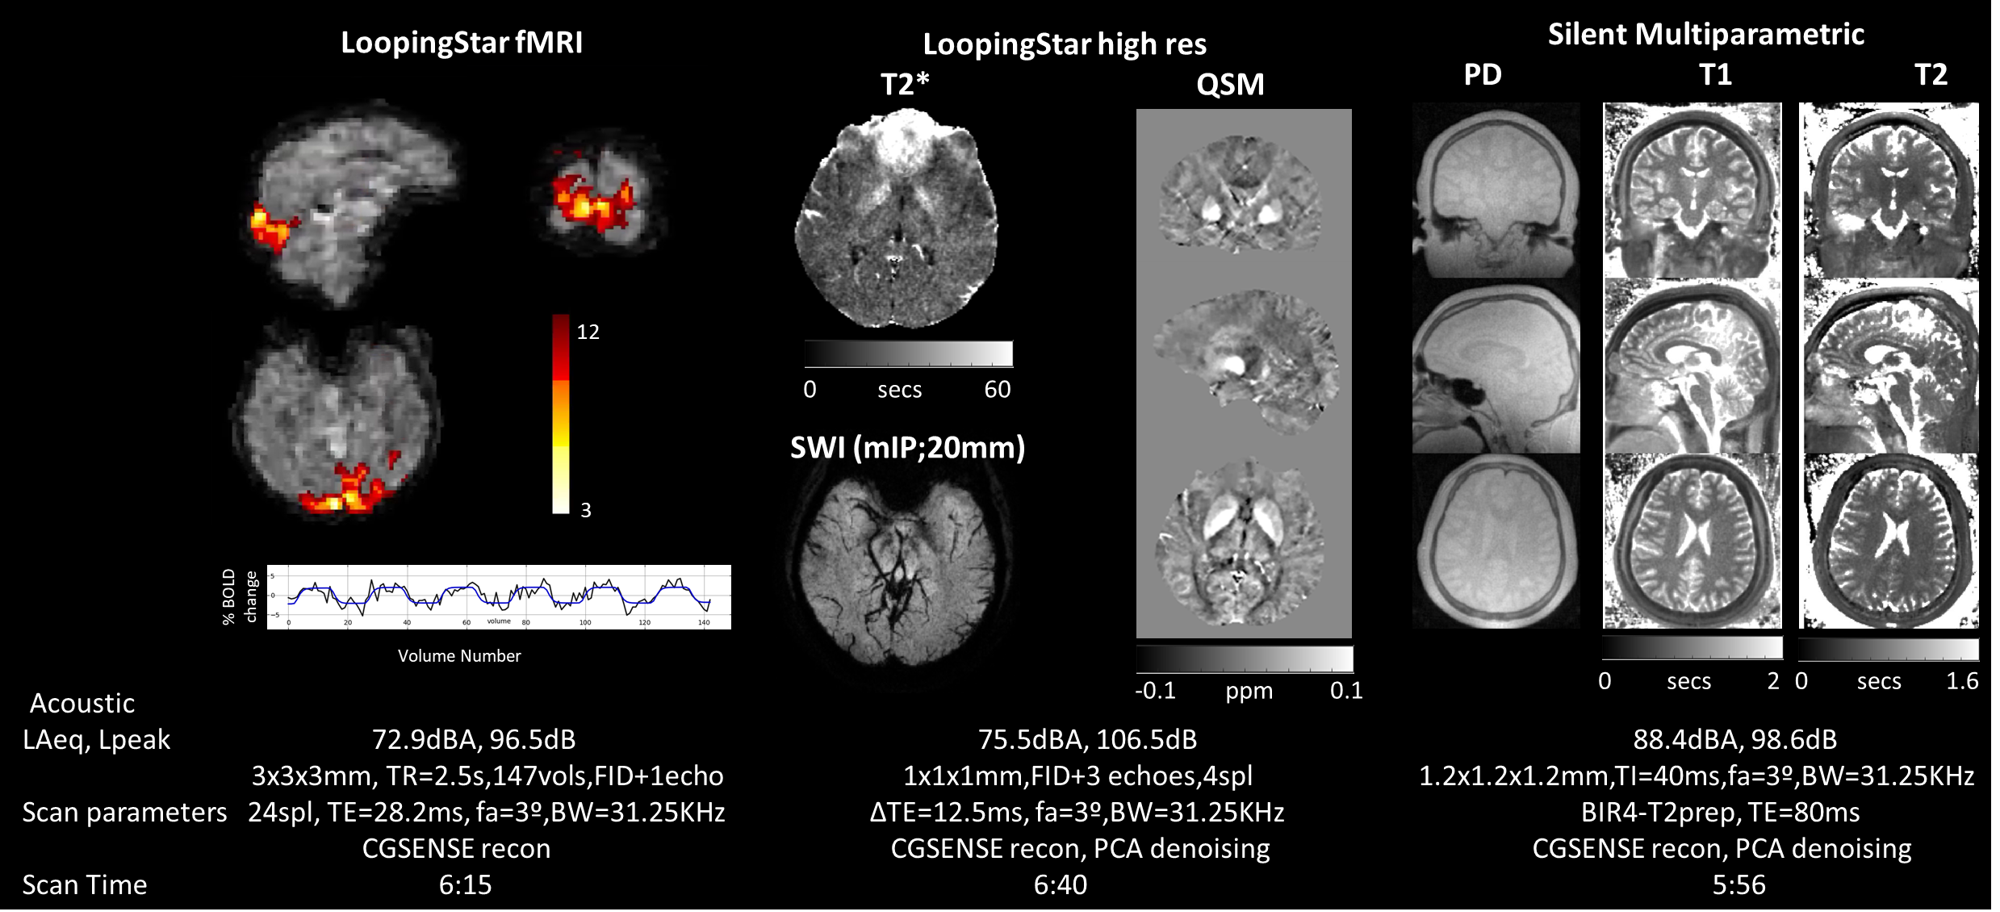
Healthy volunteer scanning was used to develop a comprehensive, quiet neuroimaging protocol at 3.0T (i.e., SIGNA MR750w, SIGNA Premier - GE Healthcare, Chicago, IL) using two different brain coils (8-channel and 48-channel). The comprehensive quiet neuroimaging protocol included: 1) 3D radial ZTE-based acquisitions (i.e., localizer, MPRAGE, MRA) [2], 2) 2D Cartesian FSE based acquisitions (i.e., T2w, T2-FLAIR), 3) 2D PROPELLER Diffusion, 4) 3D silent quantitative parameter mapping (PD, T1, T2) based on magnetization-prepared segmented ZTE acquisition [4], and 5) Looping Star for high resolution structural T2* and SWI-weighted imaging as well as function BOLD fMRI [5-7]. While the ZTE-based pulse sequences (including Parameter Mapping and Looping Star) are intrinsically silent, the 2D FSE based methods (i.e., Cartesian T2, Cartesian T2-FLAIR, and PROPELLER Diffusion) use the acoustic noise reduction technique (ART) based on gradient deration for quiet scanning [1]. Key sequence parameters and scan time are summarized in the respective figures. 2D Cartesian FSE based and 3D standard ZTE based acquisitions were processed through conventional reconstruction pipeline as well as Deep-Learning based reconstructions (AIR Recon DL, GE Healthcare) [3].The high-resolution, multi-echo Looping Star acquisition was used for quantitative T2* and QSM mapping using established processing pipelines including ROMEO (phase unwrapping and frequency fitting) and MEDI (background field removal and susceptibility calculation via the projection onto dipole fields method) [7]. Silent Looping Star fMRI was demonstrated for visual activation consisting of an 8Hz flickering checkerboard with 30s on/off block design. Standard processing pipeline and first level analyses using GLM was applied using FSL. Z-statistics were corrected by multiple comparisons z>3.1, p<0.05 at cluster level [3,4]. Silent parameter mapping was also included as previously demonstrated [7] using 3D radial phyllotaxis trajectory [8].
Acoustic noise measurements were performed with a Bruel & Kjaer (Copenhagen, Denmark) integrated sound level meter (Type 2250) and microphone (Type 4189). Peak (Lpeak [dB]) and A-weighted average (LAeq [dBA]) sound pressure levels were measured for 20 seconds in the magnet bore in the middle of each pulse sequence and without any sequence running (ambient). The microphone was placed in the position of the right ear inside the head coil.
Results
Figure 1 shows the silent 3D ZTE-based localizer, T1-weighted MPRAGE and MRA images from one volunteer before and after applying DL-based image reconstruction. Figure 2 shows representative images from one volunteer for the 2D ART FSE based. T2-weighted, T2-FLAIR and diffusion-weighted Propeller before and after DL-based image reconstruction are included. ADC was also computed from the diffusion-weighted images. Figure 3 shows the results from LoopingStar (T2*, QSM, SWI and fMRI) and the silent parameter mapping sequence (PD, T1 and T2) for one volunteer. The in-bore ambient acoustic noise in the absence of scanning was 67.2 dBA (LAeq) and 91.5 dB (Lpeak). All sequences presented lower than 100dBA mean acoustic noise (LAeq). Both participants indicated that the scan session was pleasant.Discussion & Conclusions
Here we have presented a comprehensive silent MR neuroimaging protocol and combined it with DL-based image reconstruction to boost image quality (i.e., SNR and sharpness) and/or shorten scan time. The protocol includes 2D FSE based sequences with ART (Figure 1), inherently silent 3D ZTE based-based methods (Figure 2), and novel research sequences for silent BOLD fMRI and quantitative parameter mapping (Figure 3). The selected protocols were chosen to be conservative, and we believe further scan acceleration is still possible. In a next step, the silent neuroimaging protocol can be further enhanced by adding motion robustness by extending the usage of PROPELLER (i.e., T2w, T2w-FLAIR, Diffusion) and using phyllotaxis k-space sampling for ZTE-based sequences for retrospective, self-navigated motion correction [8]. In summary, silent neuroimaging appears within reach but requires further clinical efforts to test its equivalence to conventional/loud MR neuroimaging.Acknowledgements
The authors would like to thank Prof. Gareth Barker, Dr. Fernando O. Zelaya, Dr. Emil Ljundberg and Dr. Nikou L. Damestani for their contributions to quiet scanning.References
[1] Hennel F et al (1999) “Silent” MRI with soft gradient pulses. Magn. Reson. Med., 42 (1999), pp. 6-10.
[2] Ljungberg E et al (2021) Silent zero TE MR neuroimaging: Current state-of-the-art and future directions. (2021). Progress in Nuclear Magnetic Resonance Spectroscopy. 2021, 123:73-93
[3] Lebel M (2020). Performance characterization of a novel deep learning-based MR image reconstruction pipeline. arXiv:2008.06559
[4] Wiesinger F et al (2021). 3D Silent Parameter Mapping: Further refinements & quantitative assessment. ISMRM 2021
[5] Wiesinger F et al (2019) Looping Star. MRM 2019 Jan; 81(1): 57-68
[6] Damestani NL Let al (2021). Revealing the mechanisms behind novel auditory stimuli discrimination: An evaluation of silent functional MRI using looping star. Hum Brain Mapp. 2021 Jun 15; 42(9): 2833–2850.
[7] Damestani NL et al (2022). Quiet quantitative susceptibility mapping with Looping Star. ISMRM 2022- 2468
[8] Ljungberg E et al. (2022) Motion corrected silent ZTE neuroimaging. MRM 2022 Jul 18-1:195-210
Figures