0247
Quantifying geometrical properties of the Brain Surface in Alzheimer's Disease using 3D Tortuosity1Radiology and Imaging Sciences, Emory University School of Medicine, Atlanta, GA, United States, 2Department of Neurology, Emory University School of Medicine, Atlanta, GA, United States
Synopsis
Keywords: Radiomics, Alzheimer's Disease
Alzheimer's disease causes significant gray matter loss, which leads to changes in the brain surface's shape. In this work, we used the local gyrification index (LGI) and the three-dimensional tortuosity (𝜏3𝐷) to characterize the cortical morphology, and to determine if the obtained values were significantly different amog the Alzheimer's diagnosis. The subset of MRI studies was obtained from ADNI database. For the data analyzed, the results show that the 𝜏3𝐷 has a positive correlation with brain volume and can potentially be a biomarker for AD.Introduction
Alzheimer's Disease (AD) is associated with neuronal loss, which leads to changes in the brain surface's shape in addition to volume loss [1]. Quantifying the geometrical properties of the brain surface and their changes in AD might provide new insights to the underlying disease processes. Indeed, cortical folding patterns have been a subject of interest and analysis, and some approaches have been developed in an attempt to capture its complexity and its relation with different pathologies [2]. One of the first approaches was the gyrification index, proposed in [3] for 2D and later extended to 3D [4], which aims to measure the amount of brain surface buried between the gyri. Recently, a novel method for quantifying the tortuosity of a 3D-embedded surface has been developed [5]. In this abstract, we aimed to use this method to study whether the 3D tortuosity is different between participants with different diagnoses in the Alzheimer's Disease Neuroimaging Initiative (ADNI). As a comparison, we also performed analyses on the gyrification index from the same dataset.Method
We used a subset of MRI studies from ADNI, which contains clinical, imaging, genetic, and biochemical biomarkers for the early detection of AD. A total of 133 subjects were included, comprised of 34 cognitively normal subjects (CN), 58 early mild cognitively impaired patients (EMCI), 19 late mild cognitively impaired patients (LMCI), and 8 AD dementia (AD). Image pre-processing includes the segmentation of the cortical surface using the FreeSurfer's recon-all pipeline. Both the three-dimensional tortuosity (𝜏3𝐷) and the local gyrification index (LGI) were calculated for each of the 34 cortical regions of interest (ROI) defined in the Desikan-Killiany atlas. The calculation of the LGI was performed as part of FreeSurfer's pipeline, according to Marie Schaer et al. [4]. It uses meshes to model the brain surface and computes the area of the cortical mesh models as an extension of the perimeters. We calculated the average value of the LGI for each ROI. We used a recently developed method based on the slope chain code to measure the 𝜏3𝐷, [5]. More specifically, we segmented and voxelized the ROIs and computed the 𝜏3𝐷 values. First, we summed the slope changes of every contour for each slice, we divided the total by the number of slices and repeated the process for each direction (X,Y, and Z). We first performed correlation analysis between the 𝜏3𝐷 and the LGI for each region to study the relationship between them. Then we used general linear models to study whether the 𝜏3𝐷 and the LGI were different in subjects with different AD diagnoses, as well as their relationships with age and sex. Finally, we performed correlation analyses between the brain volume, the 𝜏3𝐷, and the LGI.Results
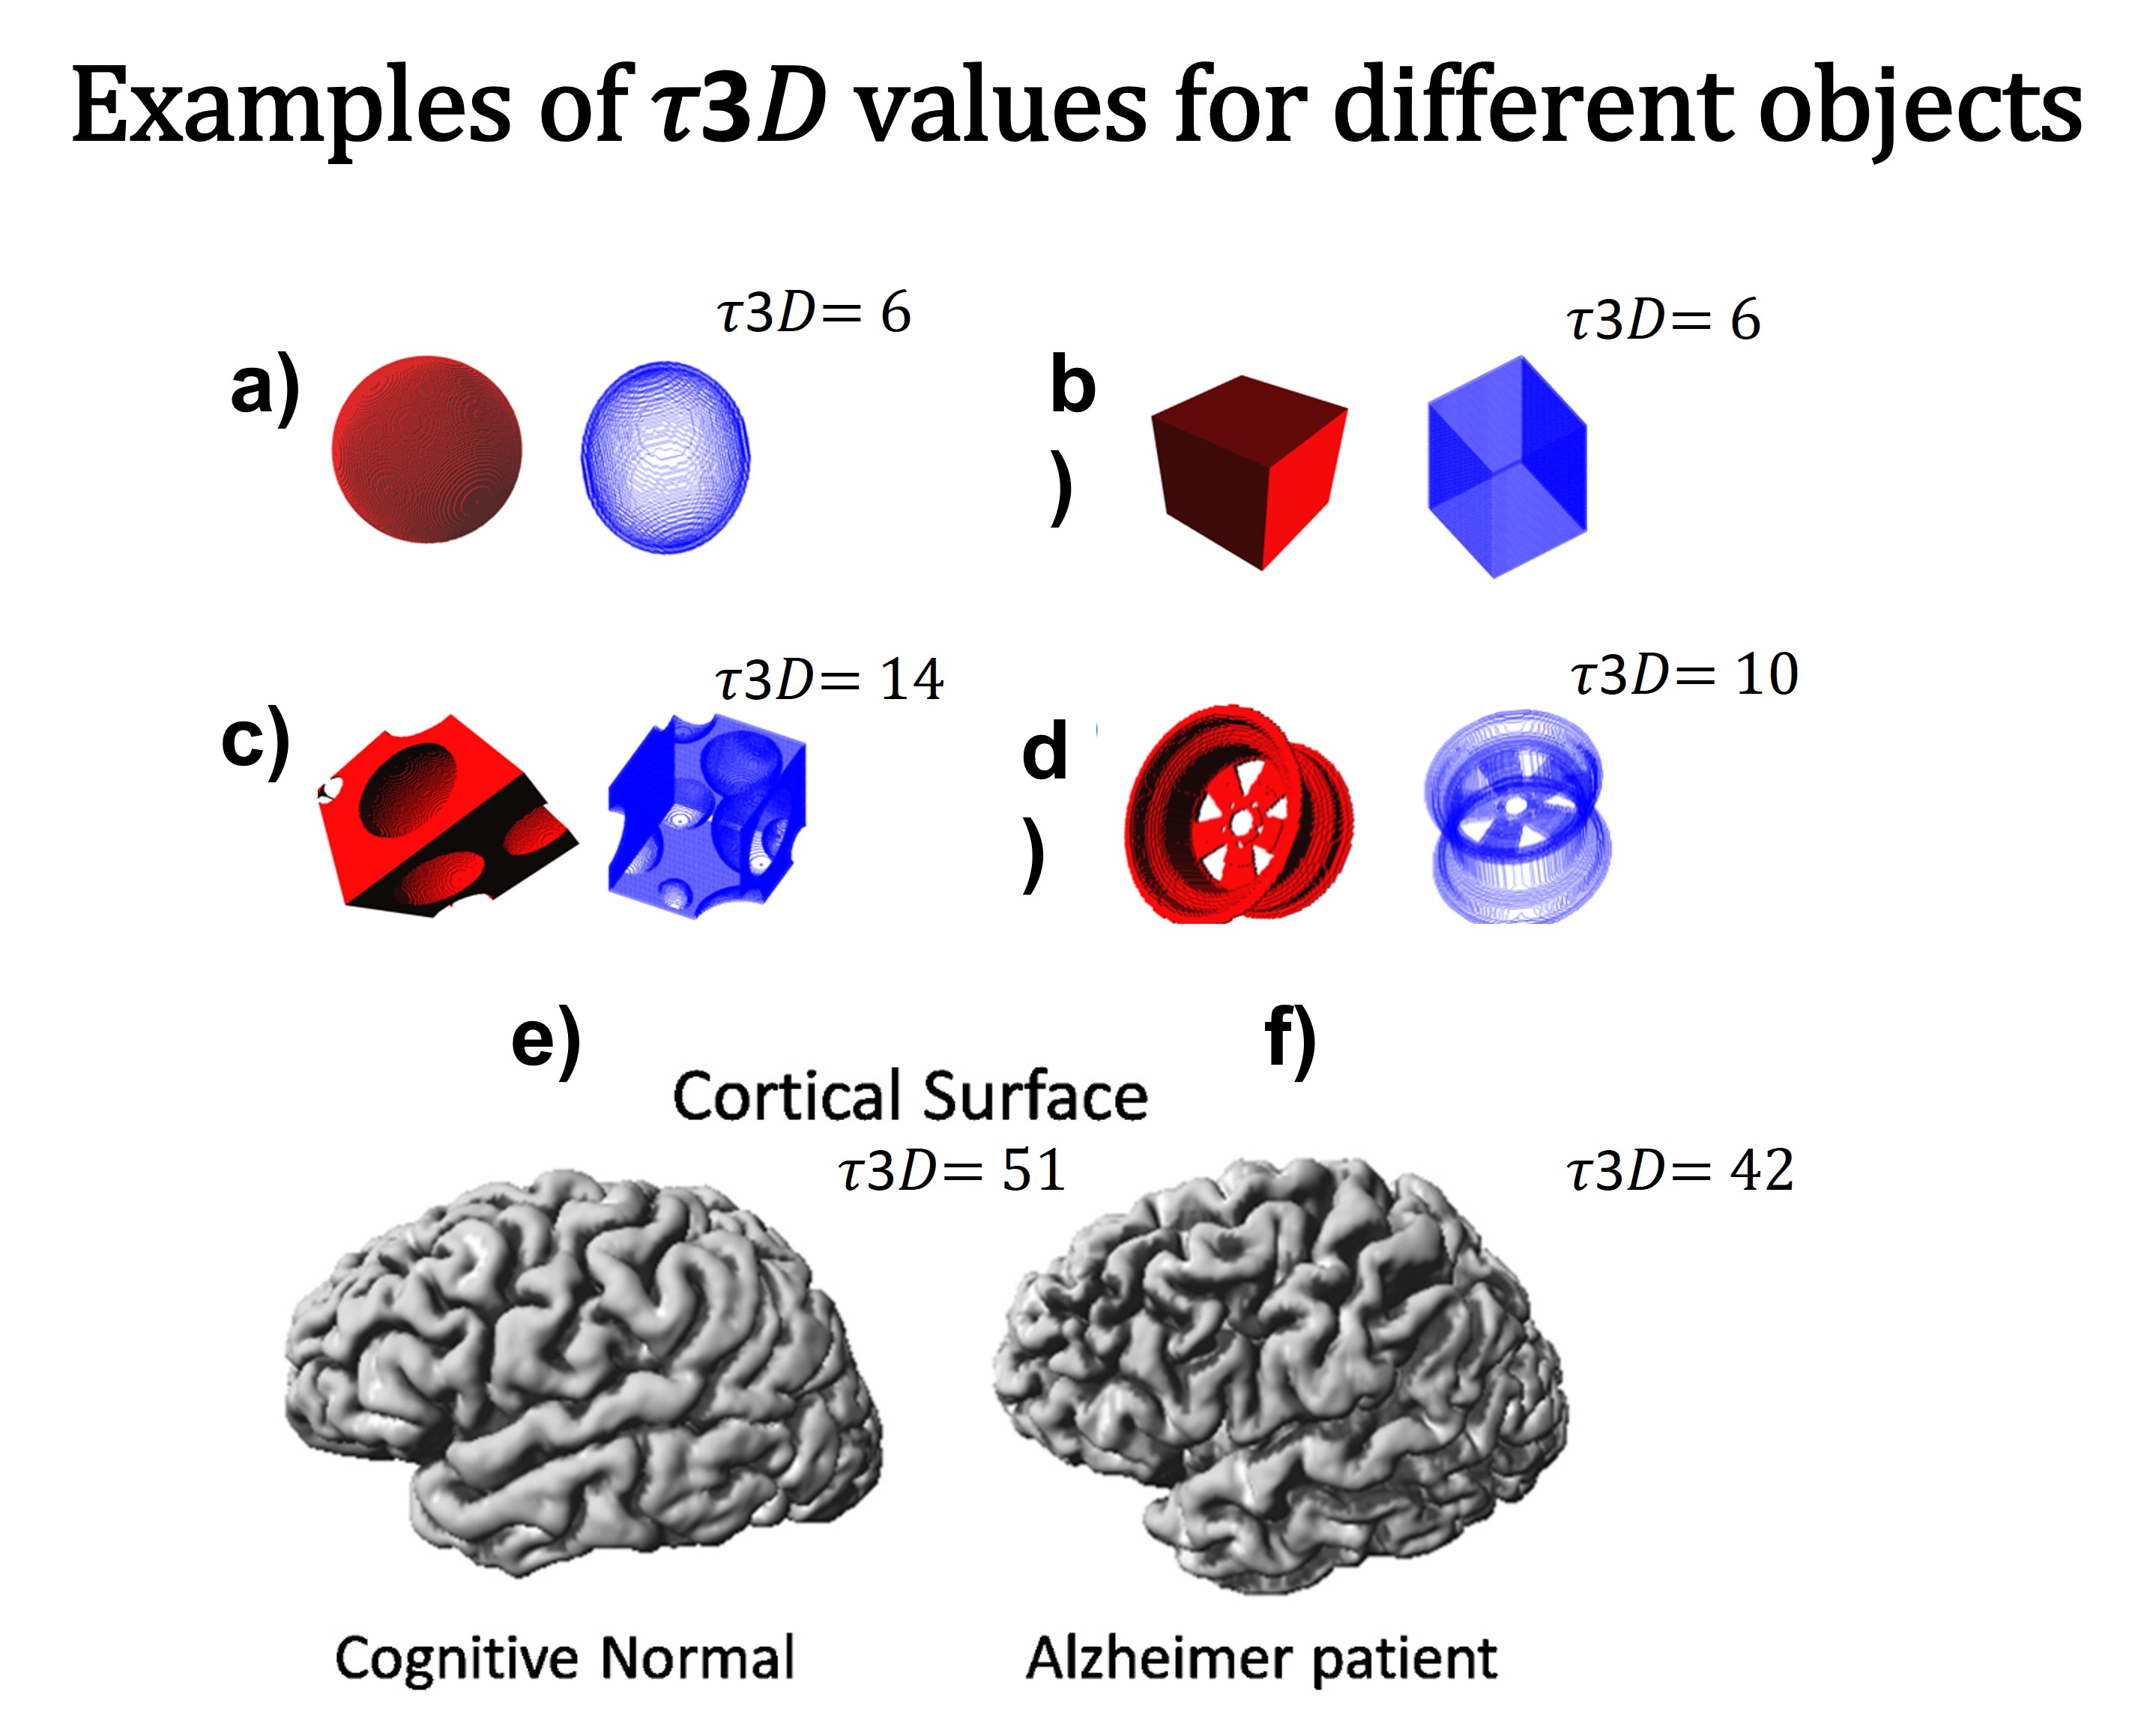
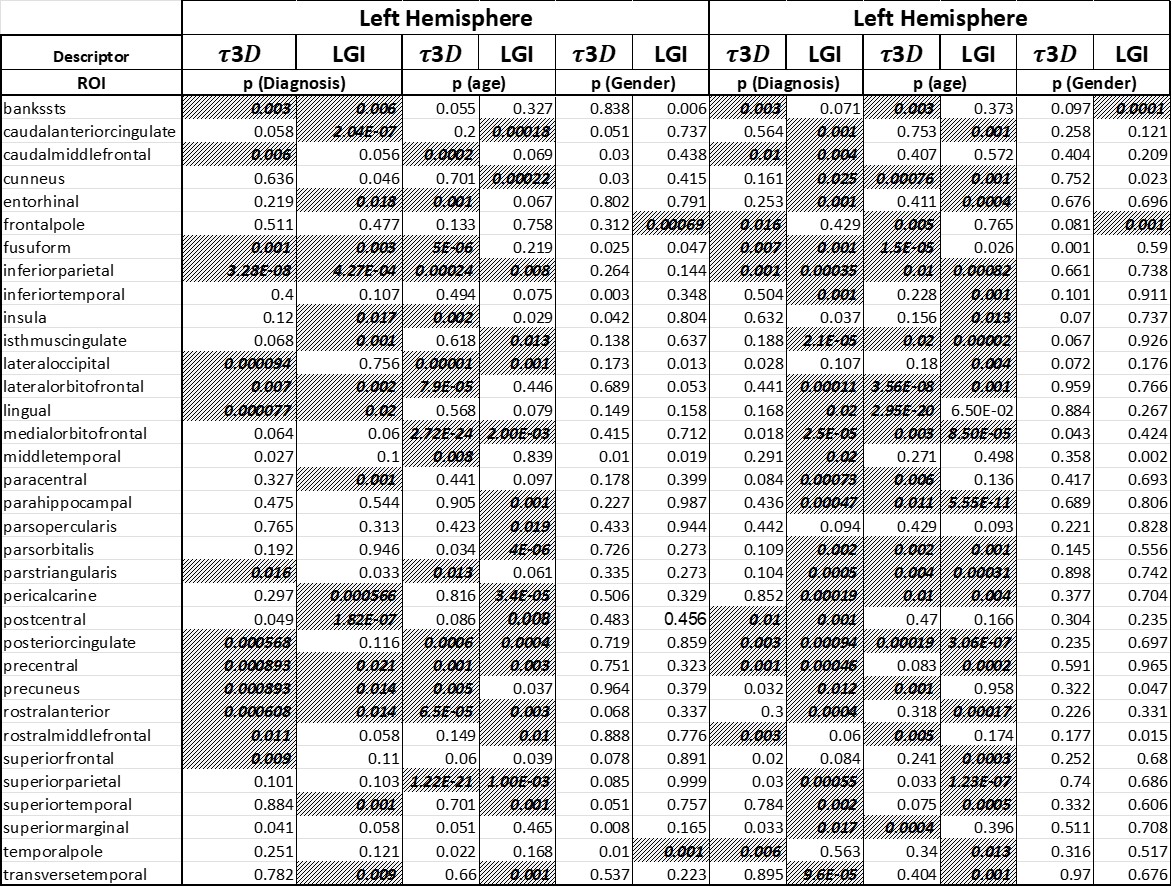
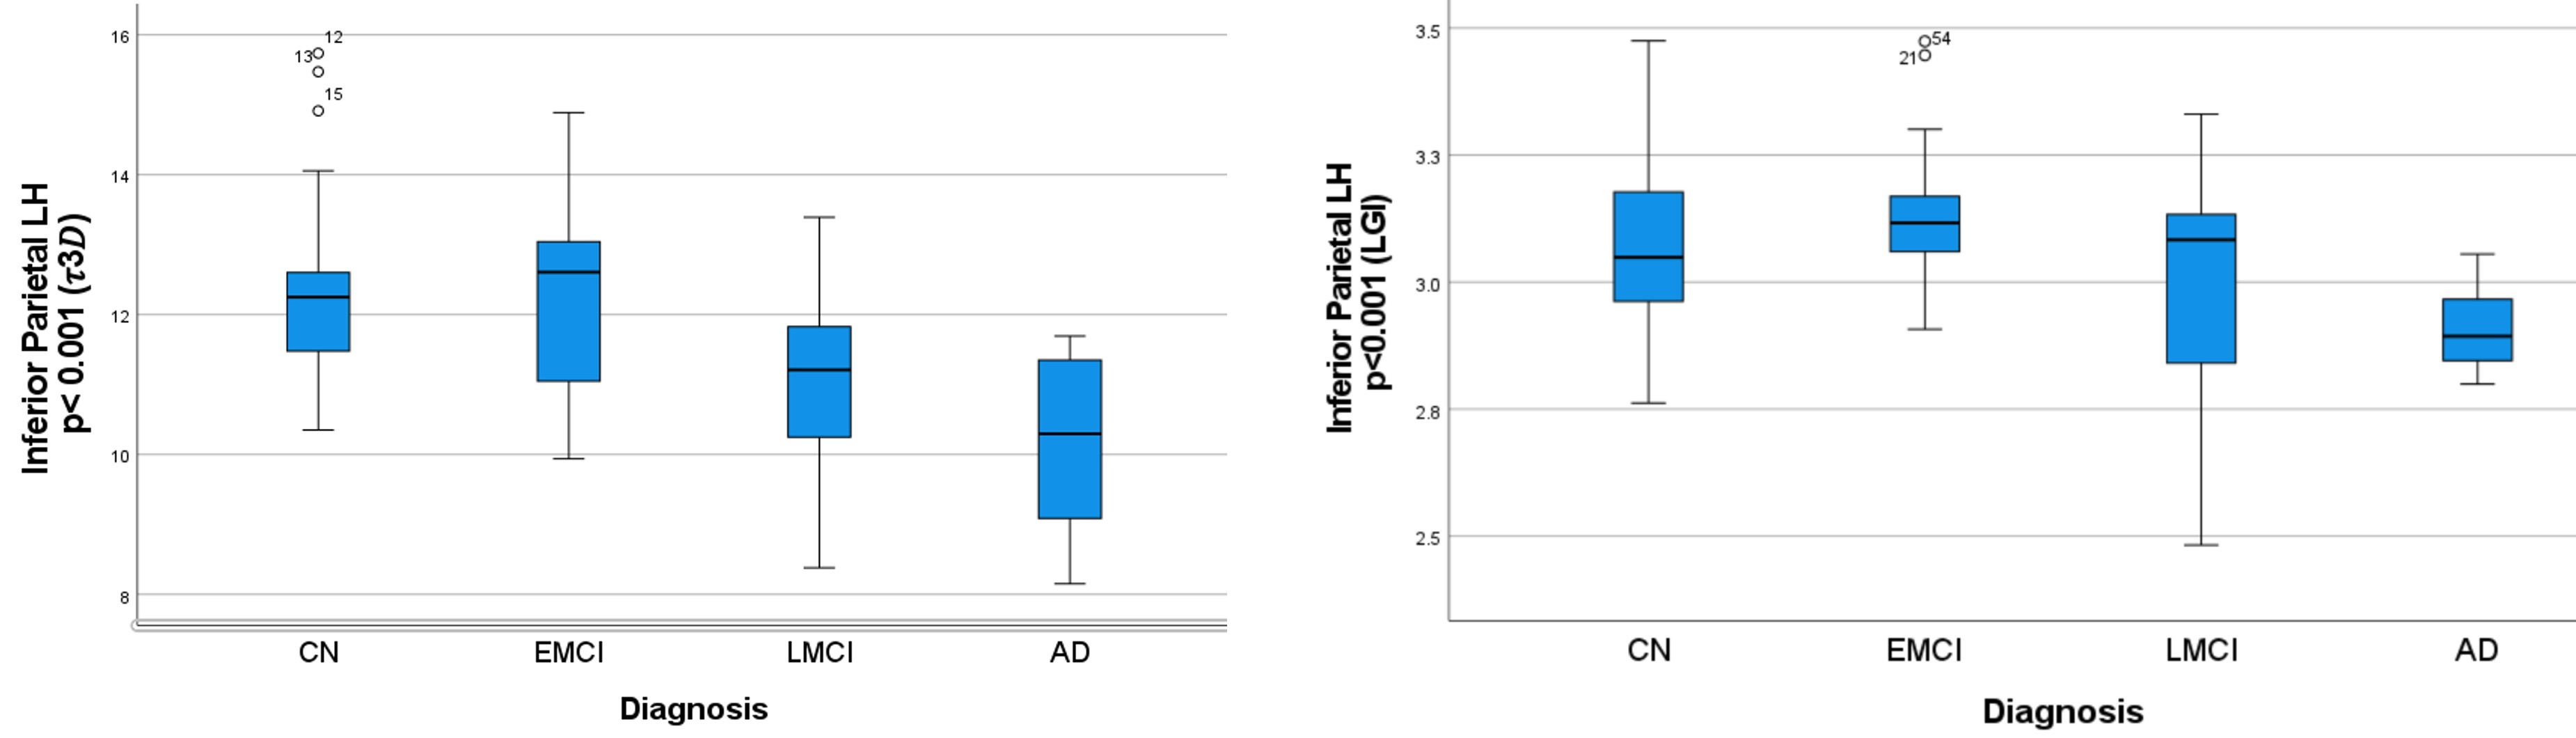
Figure 1 shows toy 3D objects and their corresponding 𝜏3𝐷, as well as cortical surfaces and 𝜏3𝐷 values of a cognitively normal subject and an AD patient respectively. It is noteworthy that this method produces 𝜏3𝐷=6 for all closed convex objects. Analyzing the values of LGI and 𝜏3𝐷 for each segmented region, no significant correlation was found between them, which suggests that 𝜏3𝐷 provides quantification of the geometry of brain surfer that is independent from the LGI. We used the general linear model to study the differences among AD stages for the LGI and 𝜏3𝐷 values of each region, with age and gender used as covariants. Significant differences in 𝜏3𝐷 and LGI values between subjects with different AD stages (CN, EMCI, LMCI vs AD) were found for a number of brain regions, and showed their potential to be used as a biomarker for diagnosis (Table 1). While there were brain regions that showed differences in both 𝜏3𝐷 and LGI, 𝜏3𝐷 was more sensitive than LGI to different diagnosis in some brain regions, e.g. the left inferior parietal gyrus and the left lingual gyrus, and vice versa. As expected, we found significant effects of age on both 𝜏3𝐷 and LGI in a number of brain regions. Finally, we found that the volume of the brain was positively correlated with the 𝜏3𝐷 and LGI values for some brain regions.Conclusions
Employing novel and specially designed descriptors of geometrical properties to quantify the shape of the brain cortex has the potential to lead to a better understanding of the structural organization and its relation with some pathologies, particularly Alzheimer's Disease. Both descriptors evaluated in this study, 𝜏3𝐷 and LGI, attempt to capture the shape of the brain cortex, even though no significant correlation was found between them. We found significantly different 𝜏3𝐷 values between different AD stages in a number of brain regions, and it had a higher effect size than LGI in some regions. Further studies are needed to evaluate whether including 𝜏3𝐷 as a novel cortical shape measure could improve the performance of automated algorithms for the diagnosis of AD stages.Acknowledgements
National Institutes of Health Grants: P30AG066511, R01AG072603, R01AG070937 and R21AG064405.References
[1] G. B. Karas et al., "Global and local gray matter loss in mild cognitive impairment and Alzheimer's disease," Neuroimage, vol. 23, no. 2, pp. 708–716, Oct. 2004. [2] M. J. Nitzken, M. F. Casanova, G. Gimel'farb, T. Inanc, J. M. Zurada, and A. El-Baz, "Shape analysis of the human brain: a brief survey," IEEE J. Biomed. Heal. informatics, vol. 18, no. 4, pp. 1337–1354, 2014. [3] K. Zilles, E. Armstrong, A. Schleicher, and H. J. Kretschmann, "The human pattern of gyrification in the cerebral cortex," Anat. Embryol. (Berl)., vol. 179, no. 2, pp. 173–179, Nov. 1988. [4] M. Schaer, M. Cuadra, … L. T.-I. transactions on, and undefined 2008, "A surface-based approach to quantify local cortical gyrification," ieeexplore.ieee.org. [5] M. J. Mateos, J. Márquez, and E. Bribiesca, "3D Tortuosity: A Morphological Characterization of the Central Sulcus to Differentiate Patients with Alzheimer's Disease and Controls," in 2020 IEEE Nuclear Science Symposium and Medical Imaging Conference, NSS/MIC 2020, 2020.
Figures