0245
Multiparametric MRI radiomic model for diagnosing focal cortical dysplasia and laterality
Shiqi Chen1, Yawen Xiao1, Zhaotao Zhang1, Jiankun Dai2, Yifei Gui1, and Xinlan Xiao1
1Department of Radiology, The Second Affiliated Hospital of Nanchang University, Nanchang, China, 2GE Healthcare, MR Research China, Beijing, China
1Department of Radiology, The Second Affiliated Hospital of Nanchang University, Nanchang, China, 2GE Healthcare, MR Research China, Beijing, China
Synopsis
Keywords: Radiomics, Epilepsy
Focal cortical dysplasia (FCD) is the most common epileptogenic developmental malformation which remains challenging to diagnose. This study aimed to investigate the possibility of diagnosing FCD and laterality in epilepsy patients using the multiparametric MRI radiomics model. Radiomic features were extracted from the preoperative MRI images of 86 patients. Multivariable logistic regression was used to develop the diagnosis model. The performance of radiomic model was evaluated with general evaluation metrics and was compared with that of inexperienced radiologists.We concluded that radiomics features derived from the combined of T1WI, T2WI and FLAIR might help diagnosing FCD and laterality.Background or Purpose
Focal cortical dysplasia (FCD) is the most common epileptogenic developmental malformation in epilepsy patients[1 2]. Scalp electroencephalography and magnetic resonance imaging (MRI), including structure, diffusion, and function MRI, have been used to detect the FCD and laterality[3-5]. However, accurate diagnose of FCD remains challenging. MRI radiomic model used high-throughput quantitative features extracted from MRI images to characterize tissue and showed promising results in improving the diagnosis accuracy than using the images directly [6 7]. T1-weighted imaging (T1WI), T2-weighted imaging (T2WI), and fluid-attenuated inversion recovery(FLAIR) are routinely used MRI methods to visually inspect the FCD in clinic. In this study, we investigated the performance of MRI radiomic models basing on T1WI, T2WI and FLAIR for diagnosing the FCD and laterality. The MRI radiomic features which helped to characterize FCD and laterality were also incorporated into a nomogram model, a graphical way to present the predictors and computation of complex mathematical function[8]. We also investigated the correlation between MRI radiomic features and the duration of epilepsy.Materials and Methods
SubjectsForty-three patients(17 female , 22 left, mean ± SD age = 25.6 ± 8.9 years, mean ± SD duration = 12.7 ± 7.8 years) treated between July 2017 and May 2022 with histopathologically confirmed FCD were retrospectively enrolled. The contralateral unaffected hemispheres(17 female , mean ± SD age = 25.6 ± 8.9 years) were used as the control group. So 86 subjects were included finally. Using January 2021 as the time cutoff, those admitted after January 2021 were included in the external validation set (n=20). A computer algorithm was used to randomly (8:2 ratio) separate the remaining patients into training (n=55) and validation (n=11) sets.
MRI experiment
Preoperative and postoperative MRI data were obtained for forty-three FCD patients using a 3.0 Tesla MR scanner (Discovery MR 750W; GE Healthcare, Milwaukee, WI, USA) with a 24-channel head coil. Three sequences were acquired with the following parameters:(1)Brain volume imaging (BRAVO): TR/TE 8.2/3.1 ms; field of view 256 × 256, section thickness 1 mm, matrix 256 × 256, flip angle 12°.(2)Axial T2w imaging: TR/TE 9786/108.7 ms; field of view 260 × 260, section thickness 3 mm, matrix 240 × 240, flip angle 142°.(3)Axial T2FLAIR imaging: TR/TE 8000/142.3 ms; field of view 260 × 260, section thickness 3 mm, matrix 256× 256, flip angle 160°.
Development and testing of the radiomics model(Figure 1)
All preoperative and postoperative MR images, including T1-weighted (T1w), T2-weighted (T2w), fluid-attenuated inversion recovery (FLAIR), and combined sequences (T1w+T2w+ FLAIR), were included. The least absolute shrinkage and selection operator (LASSO) was used to select features. Multivariable logistic regression analysis was used to develop the diagnosis model as a radiomic nomogram. Internal validation and external validation were performed. The performance of the radiomic nomogram was evaluated with an area under the curve (AUC), net reclassification improvement (NRI), integrated discrimination improvement (IDI), calibration and clinical utility.
Results
Four radiomics models based on T1w, T2w, and T2-FLAIR images and their combination were developed to diagnose FCD. We discovered that Model-Combination had the highest performances in all models and showed better diagnostic performance than inexperienced radiologists in the training (AUCs: 0.847 VS. 0.664, p =0.008), validation (AUCs: 0.618 VS. 0.521, p =0.155), and external validation sets(AUCs: 0.828 VS. 0.571, p = 0.080)(Figure 2). The positive values of NRI(0.679,1.143,1.192) and IDI(0.158,0.264,0.264) in three sets indicated that the diagnostic performance of Model-Combined improved significantly. The nomogram was constructed based on the model-based combined sequences(Figure3). The radiomics nomogram fitting well in calibration curves (p > 0.05) and decision curve analysis further confirmed the clinical usefulness of the nomogram(Figure 4).In terms of the performance of models based on the single sequence, we discovered model-T2 performed best.
In terms of the radiomics features derived from combined sequences, the feature of T2 _correlation, T2_Contrast,T2_DependenceVariance,T1_ZoneVariance,T1_ LargeDependenceLowGrayLevelEmphasis,T2FLAIR_Median were significantly related to FCD lesions. These six features consist of both histogram features that reflect the voxel intensity distribution of the lesion and texture features that reflect the local relationship between pixels or voxels. And the contrast (the radiomics feature belonging to texture features) of the FCD lesions was a novel feature that not only played a crucial role in the classifier but also had a significant correlation with the duration of FCD(Figure 5).
Discussion and Conclusions
The radiomics nomogram was generated by logistic regression model-based multiparametric MRI and facilitated the diagnosis of FCD. When surgical treatment was chosen, our model could be used to further determine the laterality of the lesion to aid in preoperative evaluation. Our study represents an important advance in the diagnosis and treatment of FCD.Acknowledgements
No acknowledgement found.References
1. De Vito A, Mankad K, Pujar S, Chari A, Ippolito D, D'Arco F. Narrative review of epilepsy: getting the most out of your neuroimaging. Transl Pediatr. Apr 2021;10(4):1078-1099. doi:10.21037/tp-20-2612. Blumcke I, Thom M, Aronica E, et al. The clinicopathologic spectrum of focal cortical dysplasias: a consensus classification proposed by an ad hoc Task Force of the ILAE Diagnostic Methods Commission. Epilepsia. Jan 2011;52(1):158-74. doi:10.1111/j.1528-1167.2010.02777.x3. Middlebrooks EH, Lin C, Westerhold E, et al. Improved detection of focal cortical dysplasia using a novel 3D imaging sequence: Edge-Enhancing Gradient Echo (3D-EDGE) MRI. Neuroimage Clin. 2020;28:102449. doi:10.1016/j.nicl.2020.1024494. Rosenow F, Klein KM, Hamer HM. Non-invasive EEG evaluation in epilepsy diagnosis. Expert Rev Neurother. Apr 2015;15(4):425-44. doi:10.1586/14737175.2015.10253825. Verma A, Radtke R. EEG of partial seizures. J Clin Neurophysiol. Aug 2006;23(4):333-9. doi:10.1097/01.wnp.0000228497.89734.7a6. Lambin P, Leijenaar RTH, Deist TM, et al. Radiomics: the bridge between medical imaging and personalized medicine. Nat Rev Clin Oncol. Dec 2017;14(12):749-762. doi:10.1038/nrclinonc.2017.1417. Lambin P, Rios-Velazquez E, Leijenaar R, et al. Radiomics: extracting more information from medical images using advanced feature analysis. Eur J Cancer. Mar 2012;48(4):441-6. doi:10.1016/j.ejca.2011.11.0368. Iasonos A, Schrag D, Raj GV, Panageas KS. How to build and interpret a nomogram for cancer prognosis. J Clin Oncol. Mar 10 2008;26(8):1364-70. doi:10.1200/JCO.2007.12.9791Figures
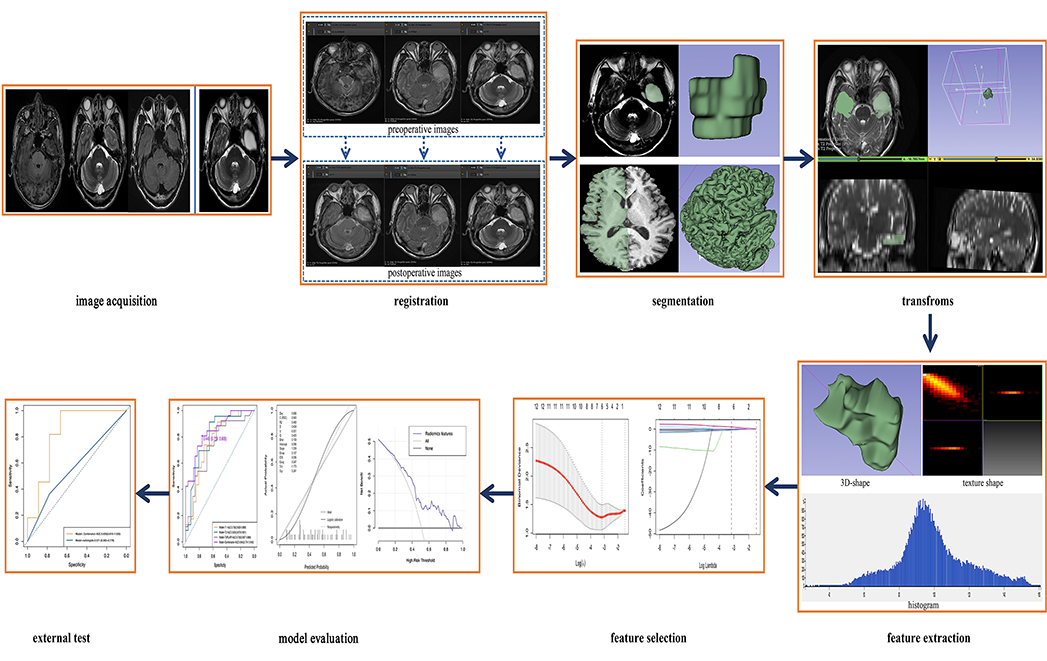
Figure.1First, the preoperative and postoperative images were registered. The bottom row shows the pre-and postoperative images after registration with 50% transparency overlap, and it can be seen that the images overlap well. Second, ROIs were segmented manually, mirrored, and transformed to the contralateral hemisphere. Then, radiomics features were extracted and selected. The multivariate logistic model was established. Finally, ROC curves, calibration plots, decision curve, and external validation analysis were used to evaluate the performance of the models.
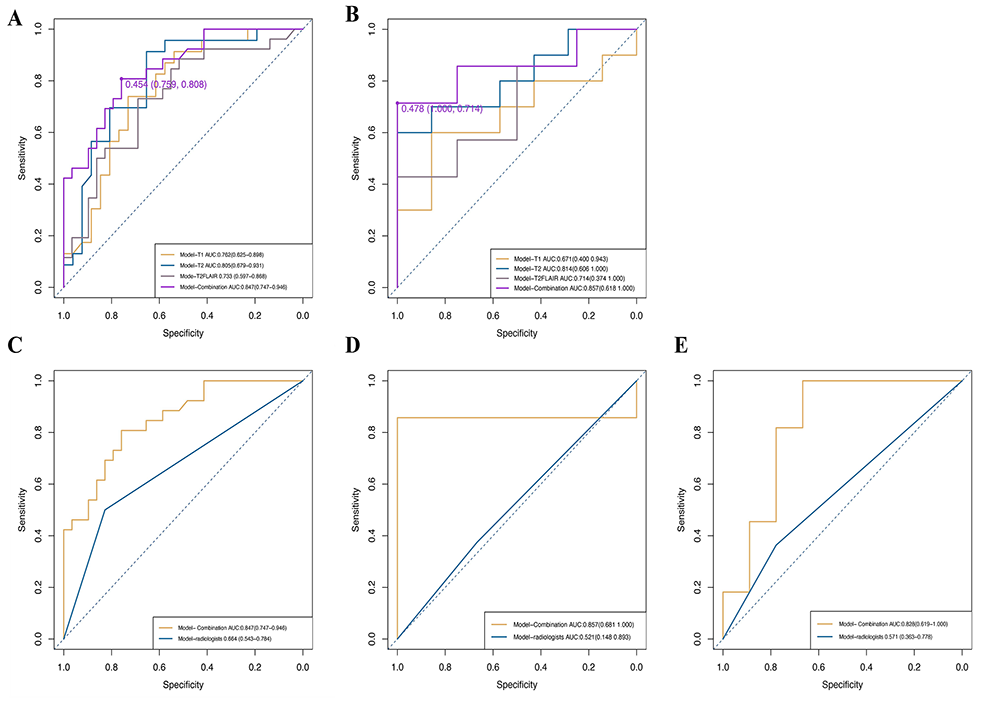
Figure.2(A, B) ROC curves of the four diagnostic models in the training and validation sets: the yellow curve represents Model-T1, the blue curve represents Model-T2, and the gray curve represents Model-T2FLAIR, the purple curve representsModel- Combination.
(C, D, E) ROC curves of Model-Combination and Model-radiologist in the training, validation, and external validation sets: the yellow curve represents Model-Combination and the blue curve represents the Model-radiologists.
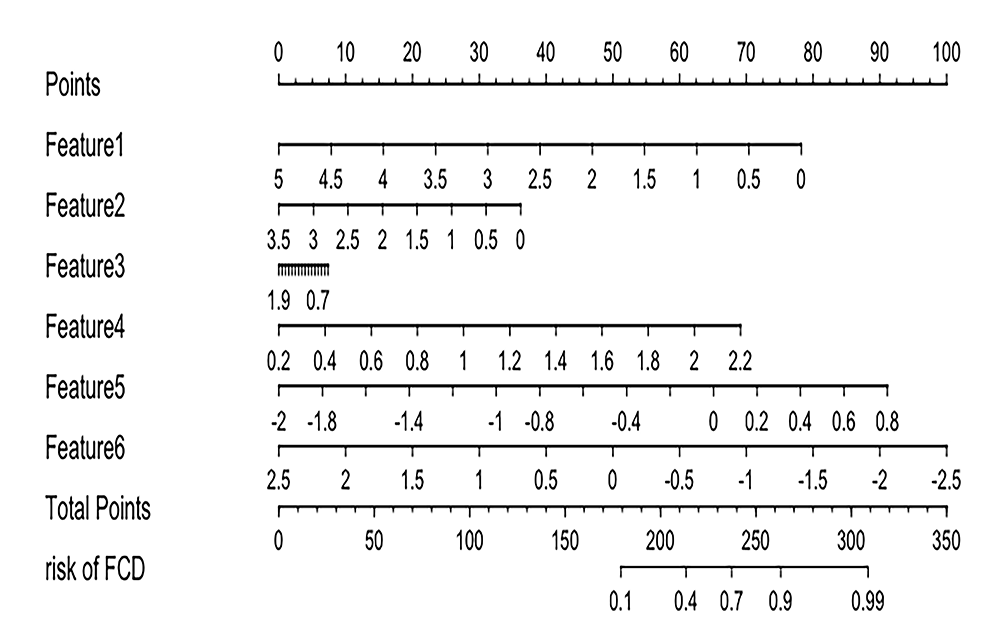
Figure.3The Model-Combination radiomics nomogram integrated the six features extracted and selected from combined sequences (T1w+T2w+ FLAIR) images. Feature 1: T1_wavelet-HLLgldm_LargeDependenceLowGrayLevelEmphasis;Feature 2: T1_wavelet-HLLglszm_ZoneVariance;Feature 3: T2_log-sigma-1-0-mm-3D_gldm_DependenceVariance;Feature 4:T2_log-sigma-1-0-mm-3D_ngtdm_Contrast;Feature 5:T2_wavelet-HHL_glcm_Correlation; Feature 6: T2FLAIR_log-sigma-0-5-mm-3D_firstorder_Median
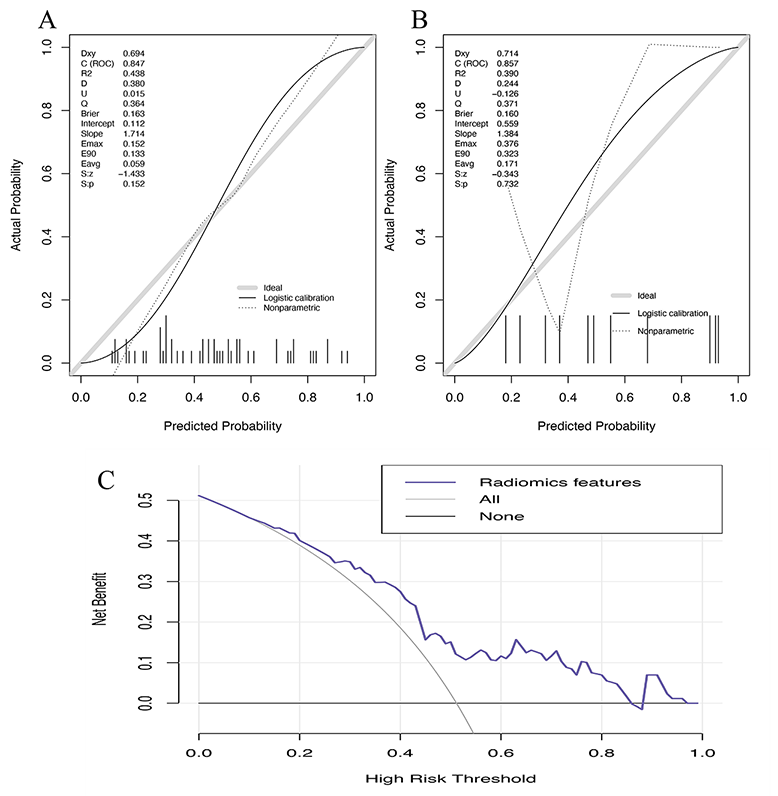
Figure.4Calibration curves of Model-Combination in the training set(A) and validation set(B). The diagonal grey line represents a perfect diagnosis by an ideal model. The black solid line represents the diagnostic performance of Model-Combination; the closer the black line is to the grey line, the better the diagnostic performance of the model.(C)Decision curve for the nomogram diagnosing the FCD in the overall patients.
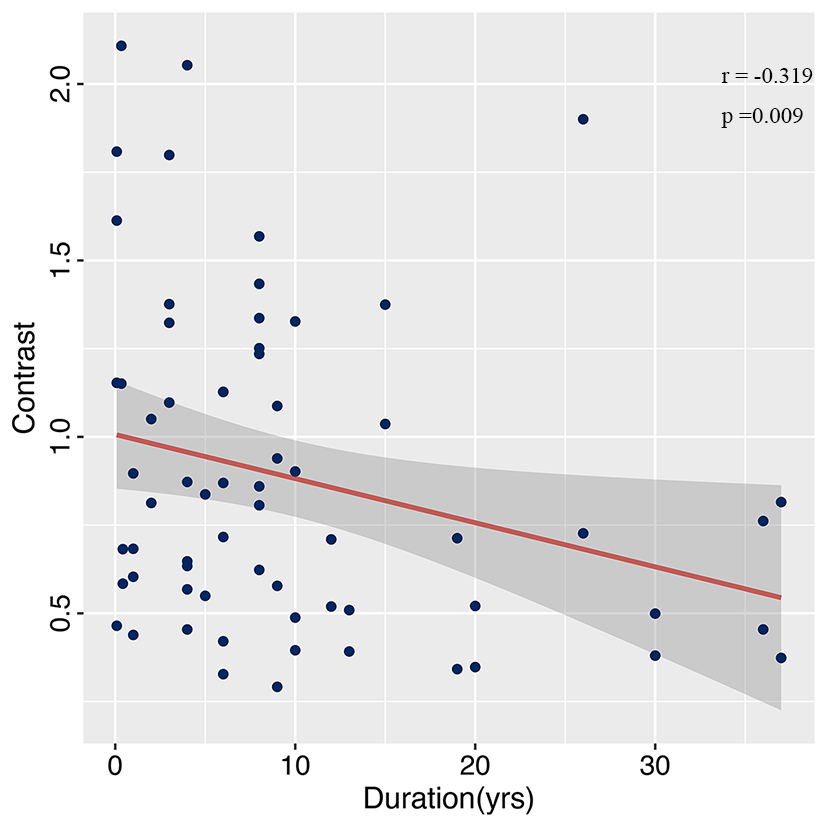
Figure.5Correlation analysis between the Contrast (the radiomics feature belong to texture features) and duration of FCD. The blue dots represent data, the red curve represents the fitted curve and the grey areas represent the 95% confidence interval (CI).
DOI: https://doi.org/10.58530/2023/0245