0240
Prediction of immune status and overall survival of glioblastoma based on immune-related lncRNA signature and radiomics signature1China-Japan Friendship Hospital, Chinese Academy of Medical Sciences & Peking Union Medical College, Beijing, China, 2Department of Radiology, Liaocheng People's Hospital, Shandong First Medical University & Shandong Academy of Medical Sciences, Liaocheng, China
Synopsis
Keywords: Radiomics, Brain, GBM
In this study, we aimed to investigate the correlation between immune-related lncRNA signature and radiomics signature and immune cell infiltration and immune checkpoint blockade in glioblastoma multiform (GBM), and to develop a prognostic model to predict the overall survival of patients. We found that immune-related lncRNA signature and radiomics signature can better predict the immune status and overall survival of GBM patients, which can help clinical prognosis determination and immunotherapy selection.Introduction
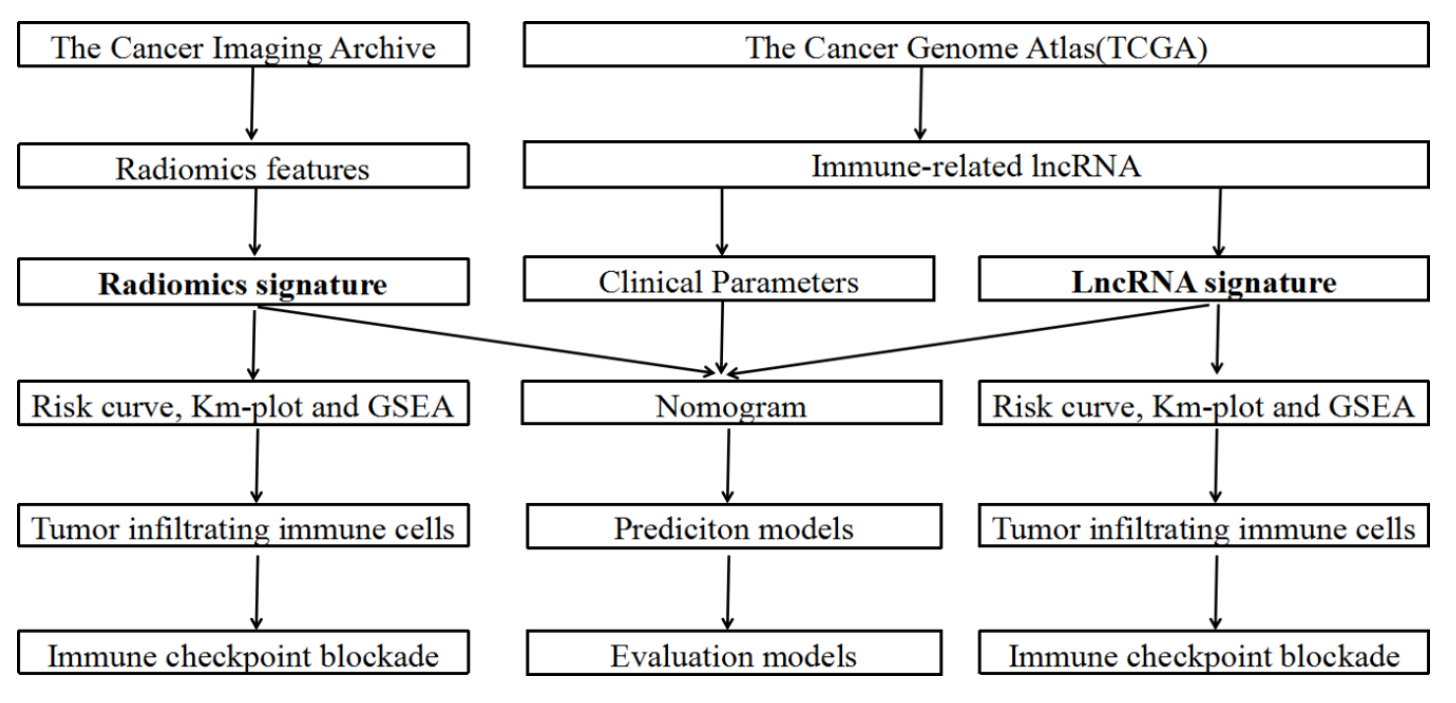
Glioblastoma multiforme (GBM), the most common malignant tumor in the central nervous system, nowadays has the poorest prognosis in the clinic. For patients with GBM, the 5-year overall survival (OS) rate is 6-22% [1]. Long non-coding RNA (lncRNA) plays a crucial role in all phases of GBM immunity [2]. However, the correlation between lncRNA and immune cell infiltration and immune checkpoint blockade (ICB) in GBM is unknown. Radiomics is currently an essential frontier in the development of medical imaging [3]. Studies have shown that CD8 cell score-based radiomics signature can effectively predict the efficacy of immunotherapy [4]. However, the correlation between radiomics, immune cell infiltration, and immune checkpoint blockade in GBM is unknown. Therefore, in this study, based on The Cancer Genome Atlas (TCGA) and The Cancer Imaging Archive (TCIA), we constructed immune-related lncRNA signature and radiomics signature to explore the relationship between the two signatures and GBM immune cell infiltration. A multifactorial prognostic model is then constructed by integrating the two signatures. Clinical risk factors and a refined model validation can determine the immune status of GBM and provide an individualized probability of survival for each patient.Materials and Methods
Transcription profiles of GBM were downloaded from the TCGA database, including 57 GBM tumor samples and five normal controls. Using the limma package calculates Pearson correlation coefficients for immune genes and lncRNAs. The absolute value of the correlation coefficient (|cor|) ≥ 0.4 and P < 0.01 were immune-related lncRNAs. In addition, the corresponding fluid attenuated inversion recovery (FLAIR) MRI data and clinical information were collected from TCIA datasets. We use ITK-SNAP (www.itk-snap.org) software to segment the FLAIR images of patients in 3D. Univariate and multivariate Cox regressions were performed on the above features, respectively, and features with P<0.05 were used to construct immune-related lncRNA signature and radiomics signature and calculate risk patients were divided into high and low-risk groups according to the median risk score, and risk curves and survival curves were plotted to explore the prognostic value of the two signature for GBM. Gene enrichment analysis (GSEA) and CIBERSORT algorithm were used to obtain the signaling pathways and the proportion of different immune cells enriched in high-risk and low-risk patients, and the correlation between immune checkpoint inhibitor target genes and immune-related lncRNA signature and radiomics signature was analyzed. A multifactorial prognostic model was developed by integrating immune-related lncRNA signature, radiomics signature, and clinical data, and its performance was compared with that of prognostic models constructed based on clinical risk factors in terms of discrimination, calibration, and clinical effectiveness. The flow chart of the study is shown in Fig.1.Results
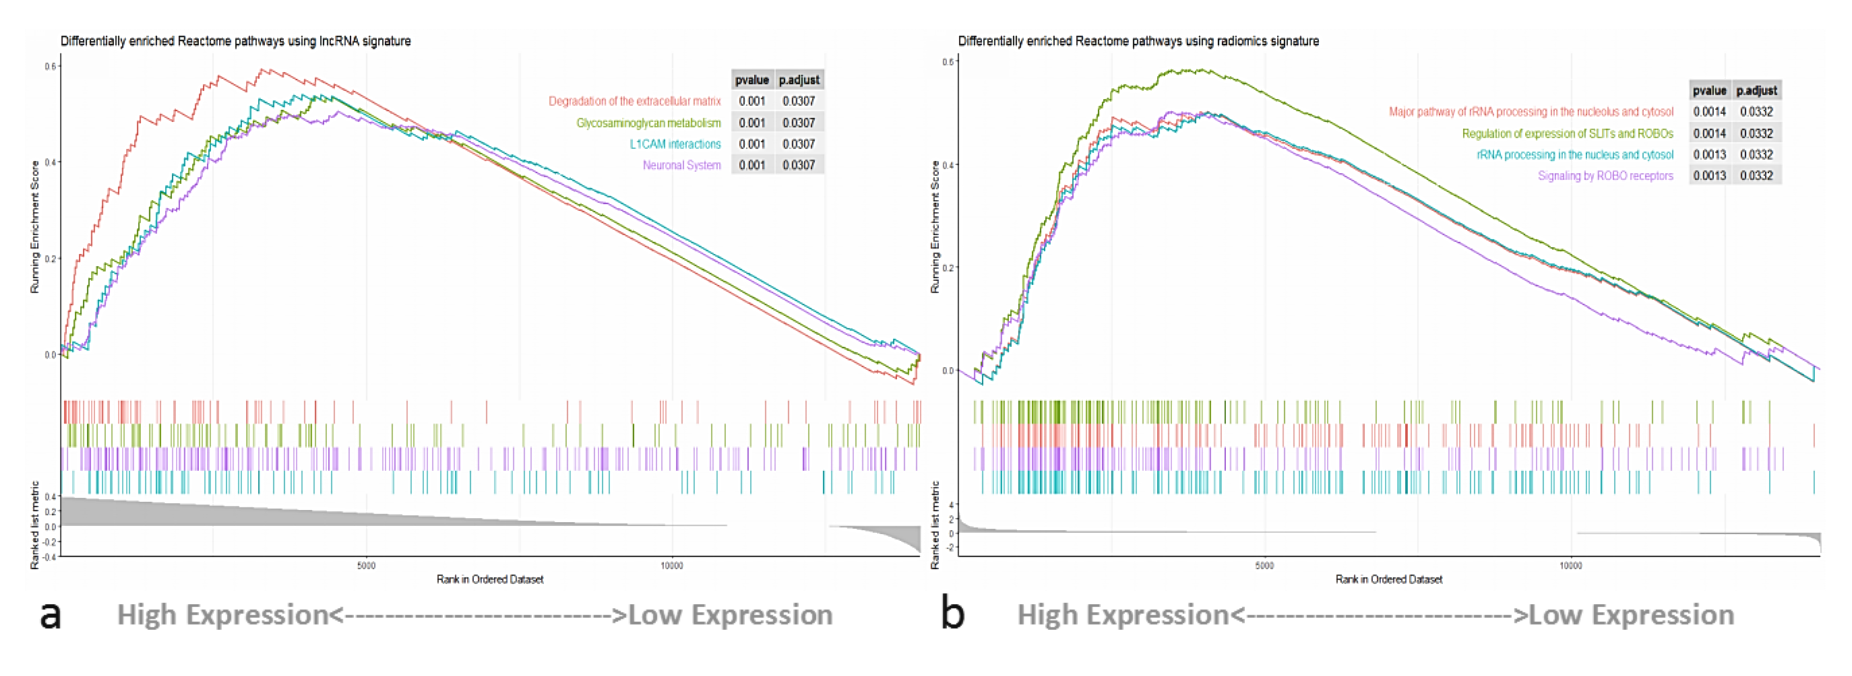
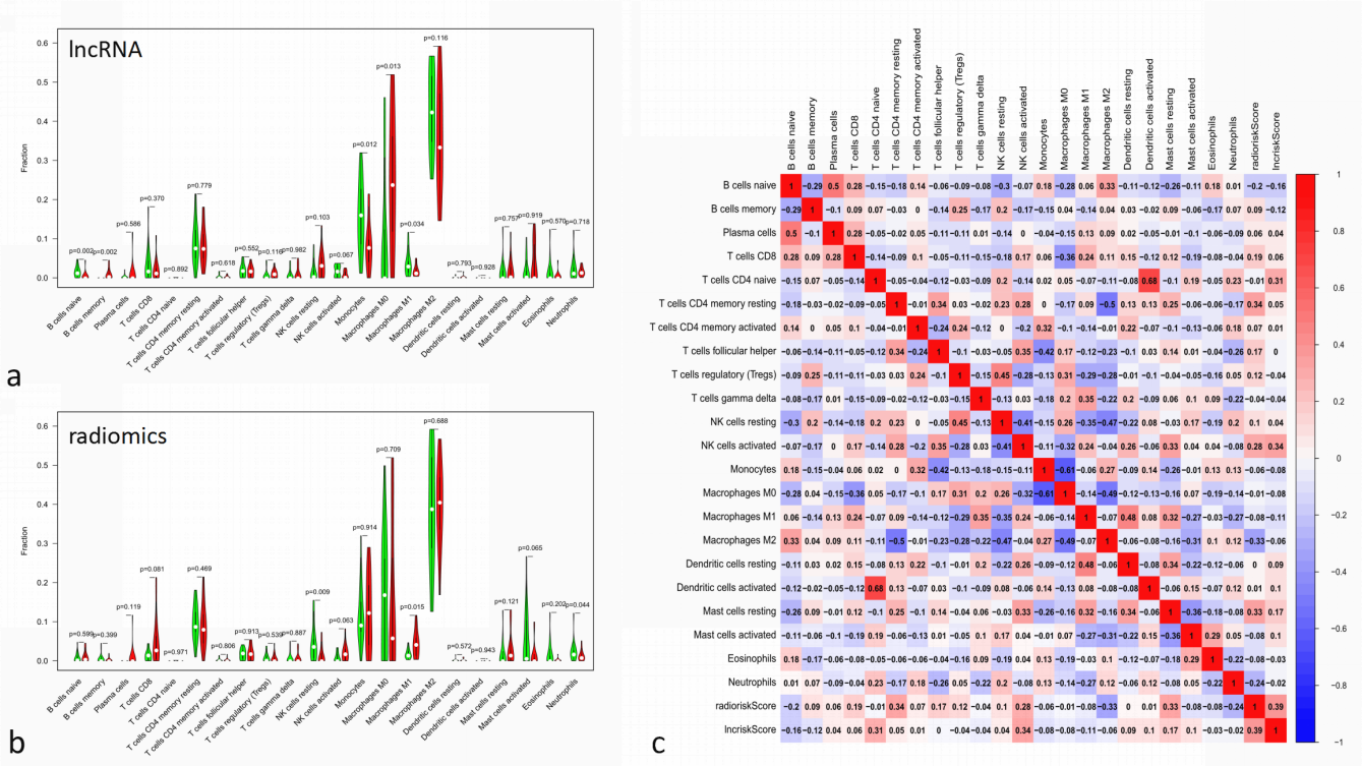
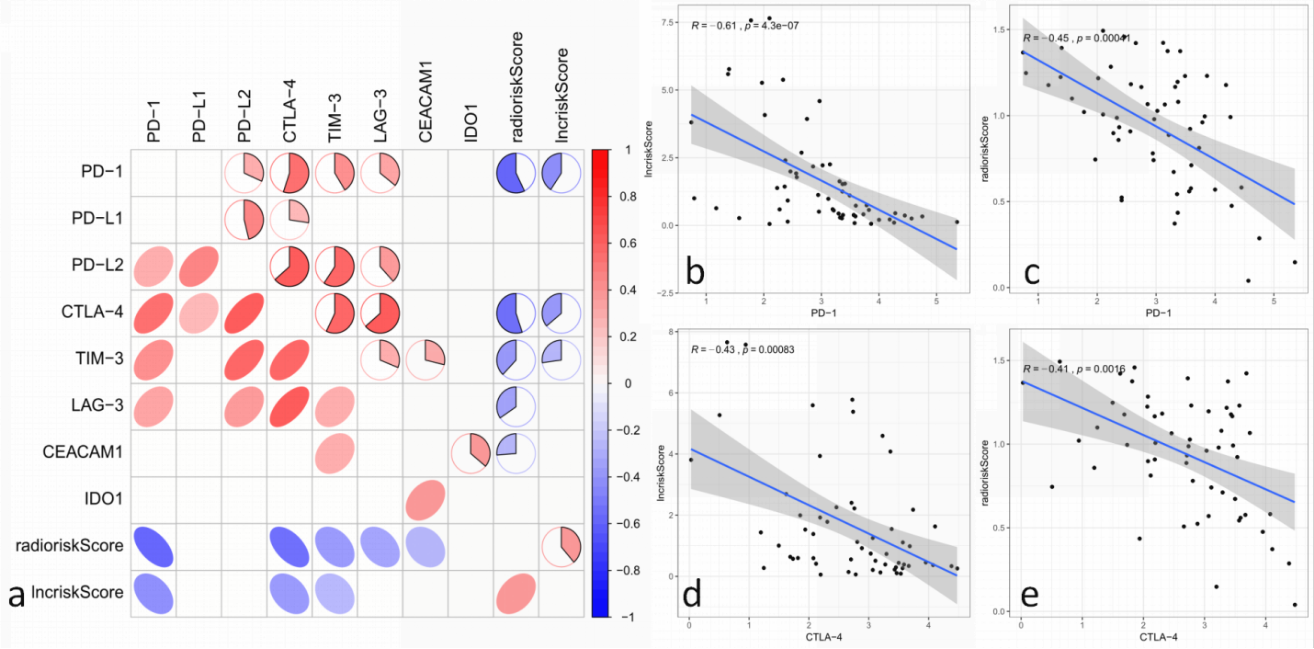
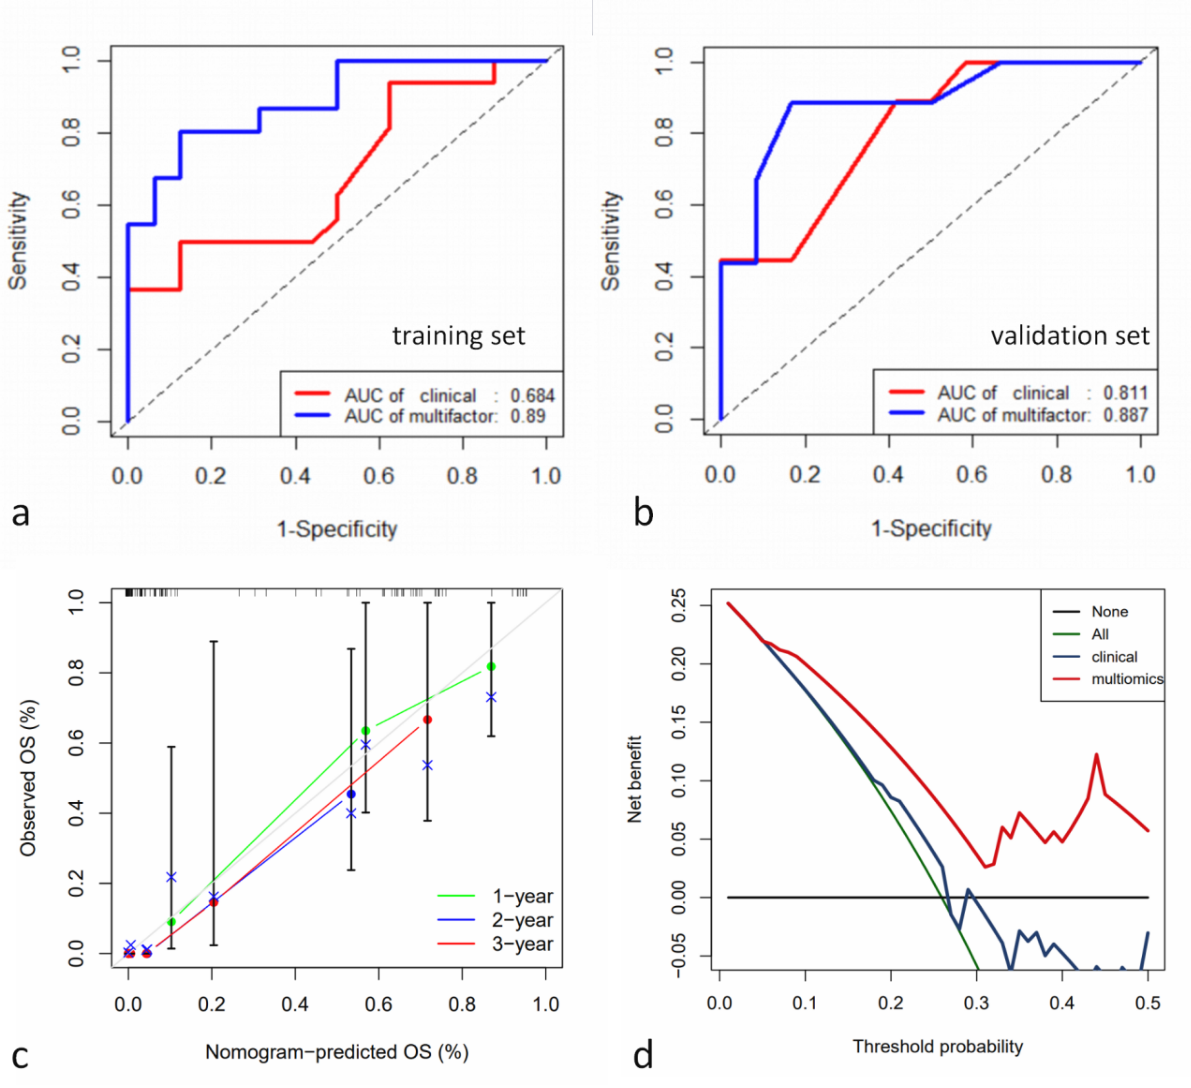
The analysis yielded 1286 immune-related lncRNAs and 851 radiomics features, and univariate and multivariate Cox regression screening yielded four immune-related lncRNAs and two radiomics features that were used as a prognostic signature. In the high-risk group signature with immune-related lncRNAs, genes were mainly enriched in L1CAM interaction, neurological and other pathways (Fig. 2); in the high-risk group signature with radiomics, genes were mainly enriched in the signaling of ROBO receptors, regulation of expression of SLITs and ROBOs and other pathways (Fig. 2). The immune-associated lncRNA signature and the radiomics signature were associated with immune cell infiltration (e.g., activated NK cells versus non-activated T cells CD4 memory T cells) (Fig. 3). Both signatures were closely associated with immune checkpoint inhibitor target genes (e.g., PD-L1 and CTLA-4) (Fig. 4). The area under the curve (AUC) was 0.811 and 0.887 for the training and validation sets of the multifactorial prognostic model, respectively; the AUC was 0.684 and 0.890 for the clinical prognostic model, respectively. Finally, the calibration plots of this model showed better calibration performance, and the DCA curves yielded larger net benefits than the traditional clinical prognostic model (Fig. 5).Discussion and Conclusion
In this study, based on the TCGA and TCIA databases, this study identified an immune-related lncRNA signature consisting of four lncRNAs and a radiomics signature consisting of two radiomics features, both of which were associated with the progression and prognosis of GBM, as well as with immune cell infiltration and potential immunotherapy-related genes, in addition to developing and validating a two-signature and clinical information-based GBM prognostic model based on both signatures and clinical information, which showed excellent performance in terms of discrimination, calibration, and clinical effectiveness. Thus, this study provides a possible approach for individualized prognostic assessment of GBM and detection of ICB immunotherapeutic response, which has critical clinical applications in tumor immunotherapy.In conclusion, based on the TCGA and TCIA databases, immune-related lncRNA signature and radiomics signature can better predict the immune status and overall survival of GBM patients, which can help clinical prognosis determination and immunotherapy selection.
Acknowledgements
The authors thank Dr. Lizhi Xie from GE Healthcare for help in solving MR technical problems.References
1. Ostrom Q T, Cioffi G, Gittleman H, et al. CBTRUS Statistical Report: Primary Brain and Other Central Nervous System Tumors Diagnosed in the United States in 2012-2016[J]. Neuro Oncol, 2019, 21(Suppl 5): v1-v100.
2. Yu W D, Wang H, He Q F, et al. Long noncoding RNAs in cancer-immunity cycle[J]. J Cell Physiol, 2018, 233(9): 6518-6523.
3. Lambin P, Rios-Velazquez E, Leijenaar R, et al. Radiomics: Extracting more information from medical images using advanced feature analysis[J]. European Journal of Cancer, 2012, 48(4): 441-446.
4. Sun R, Limkin E J, Vakalopoulou M, et al. A radiomics approach to assess tumour-infiltrating CD8 cells and response to anti-PD-1 or anti-PD-L1 immunotherapy: an imaging biomarker, retrospective multicohort study[J]. Lancet Oncol, 2018, 19(9): 1180-1191.
Figures