0238
A comparison of multi-echo and single-echo fMRI resting state mapping in neurosurgical patients1Department of Imaging and pathology, Translational MRI, KU Leuven, Leuven, Belgium, 2Department of Radiology, University Hospitals Leuven, Leuven, Belgium, 3Department of Neurosciences, Research Group Experimental Neurosurgery and Neuroanatomy, KU Leuven, Leuven, Belgium, 4Department of Neurosciences, Laboratory for Cognitive Neurology, KU Leuven, Leuven, Belgium
Synopsis
Keywords: Brain Connectivity, fMRI (resting state), multi-echo fMRI, Neurosurgery
We compared multi-echo (mTE) resting-state (rs) fMRI to single-echo (sTE) fMRI for seed-based mapping of seven canonical resting state networks (RSN) in 69 pre-surgical patients. Acquisition parameters were identical except for TE and statistical analyses were constrained by group-specific RSN masks. mTE-rsfMRI showed significantly higher functional-connectivity (fc) for all RSNs, while sTE showed comparatively fewer RSNs with areas of significantly higher fc (PFWE<0.05). Our results suggest that mTE-rsfMRI may be more sensitive than sTE-rsfMRI for mapping of the sensory-motor, default mode, salience, frontoparietal, dorsal attention, language and visual networks in a neurosurgical setting.Introduction
Blood-oxygen level dependent (BOLD) functional MRI (fMRI) is routinely used for functional brain mapping, both in clinical and research practice. Resting-state fMRI (rsfMRI) functional connectivity (fc) can be used to map the brain's functional organisation without the need for task performance during the scan. Multi-echo (mTE) acquisitions are known to be more robust to motion artefacts, and more sensitive to true neuronal BOLD signal changes 1–3, however, the differences between single echo (sTE) and mTE resting-state network (RSN) mapping with seed-based analysis (SBA) have yet to be investigated in clinical patients. BOLD fMRI in clinical patients is more likely to be degraded by motion artefacts, and pathology, or treatment related distortion (e.g. from bleeding, calvarial fixation screws, plates, etc), thus mTE scanning could be expected to improve functional mapping results compared to sTE scanning. This study compared the RSNs mapped using sTE- and mTE-rsfMRI mapping in a group of 69 neurosurgical patients.Material and Methods
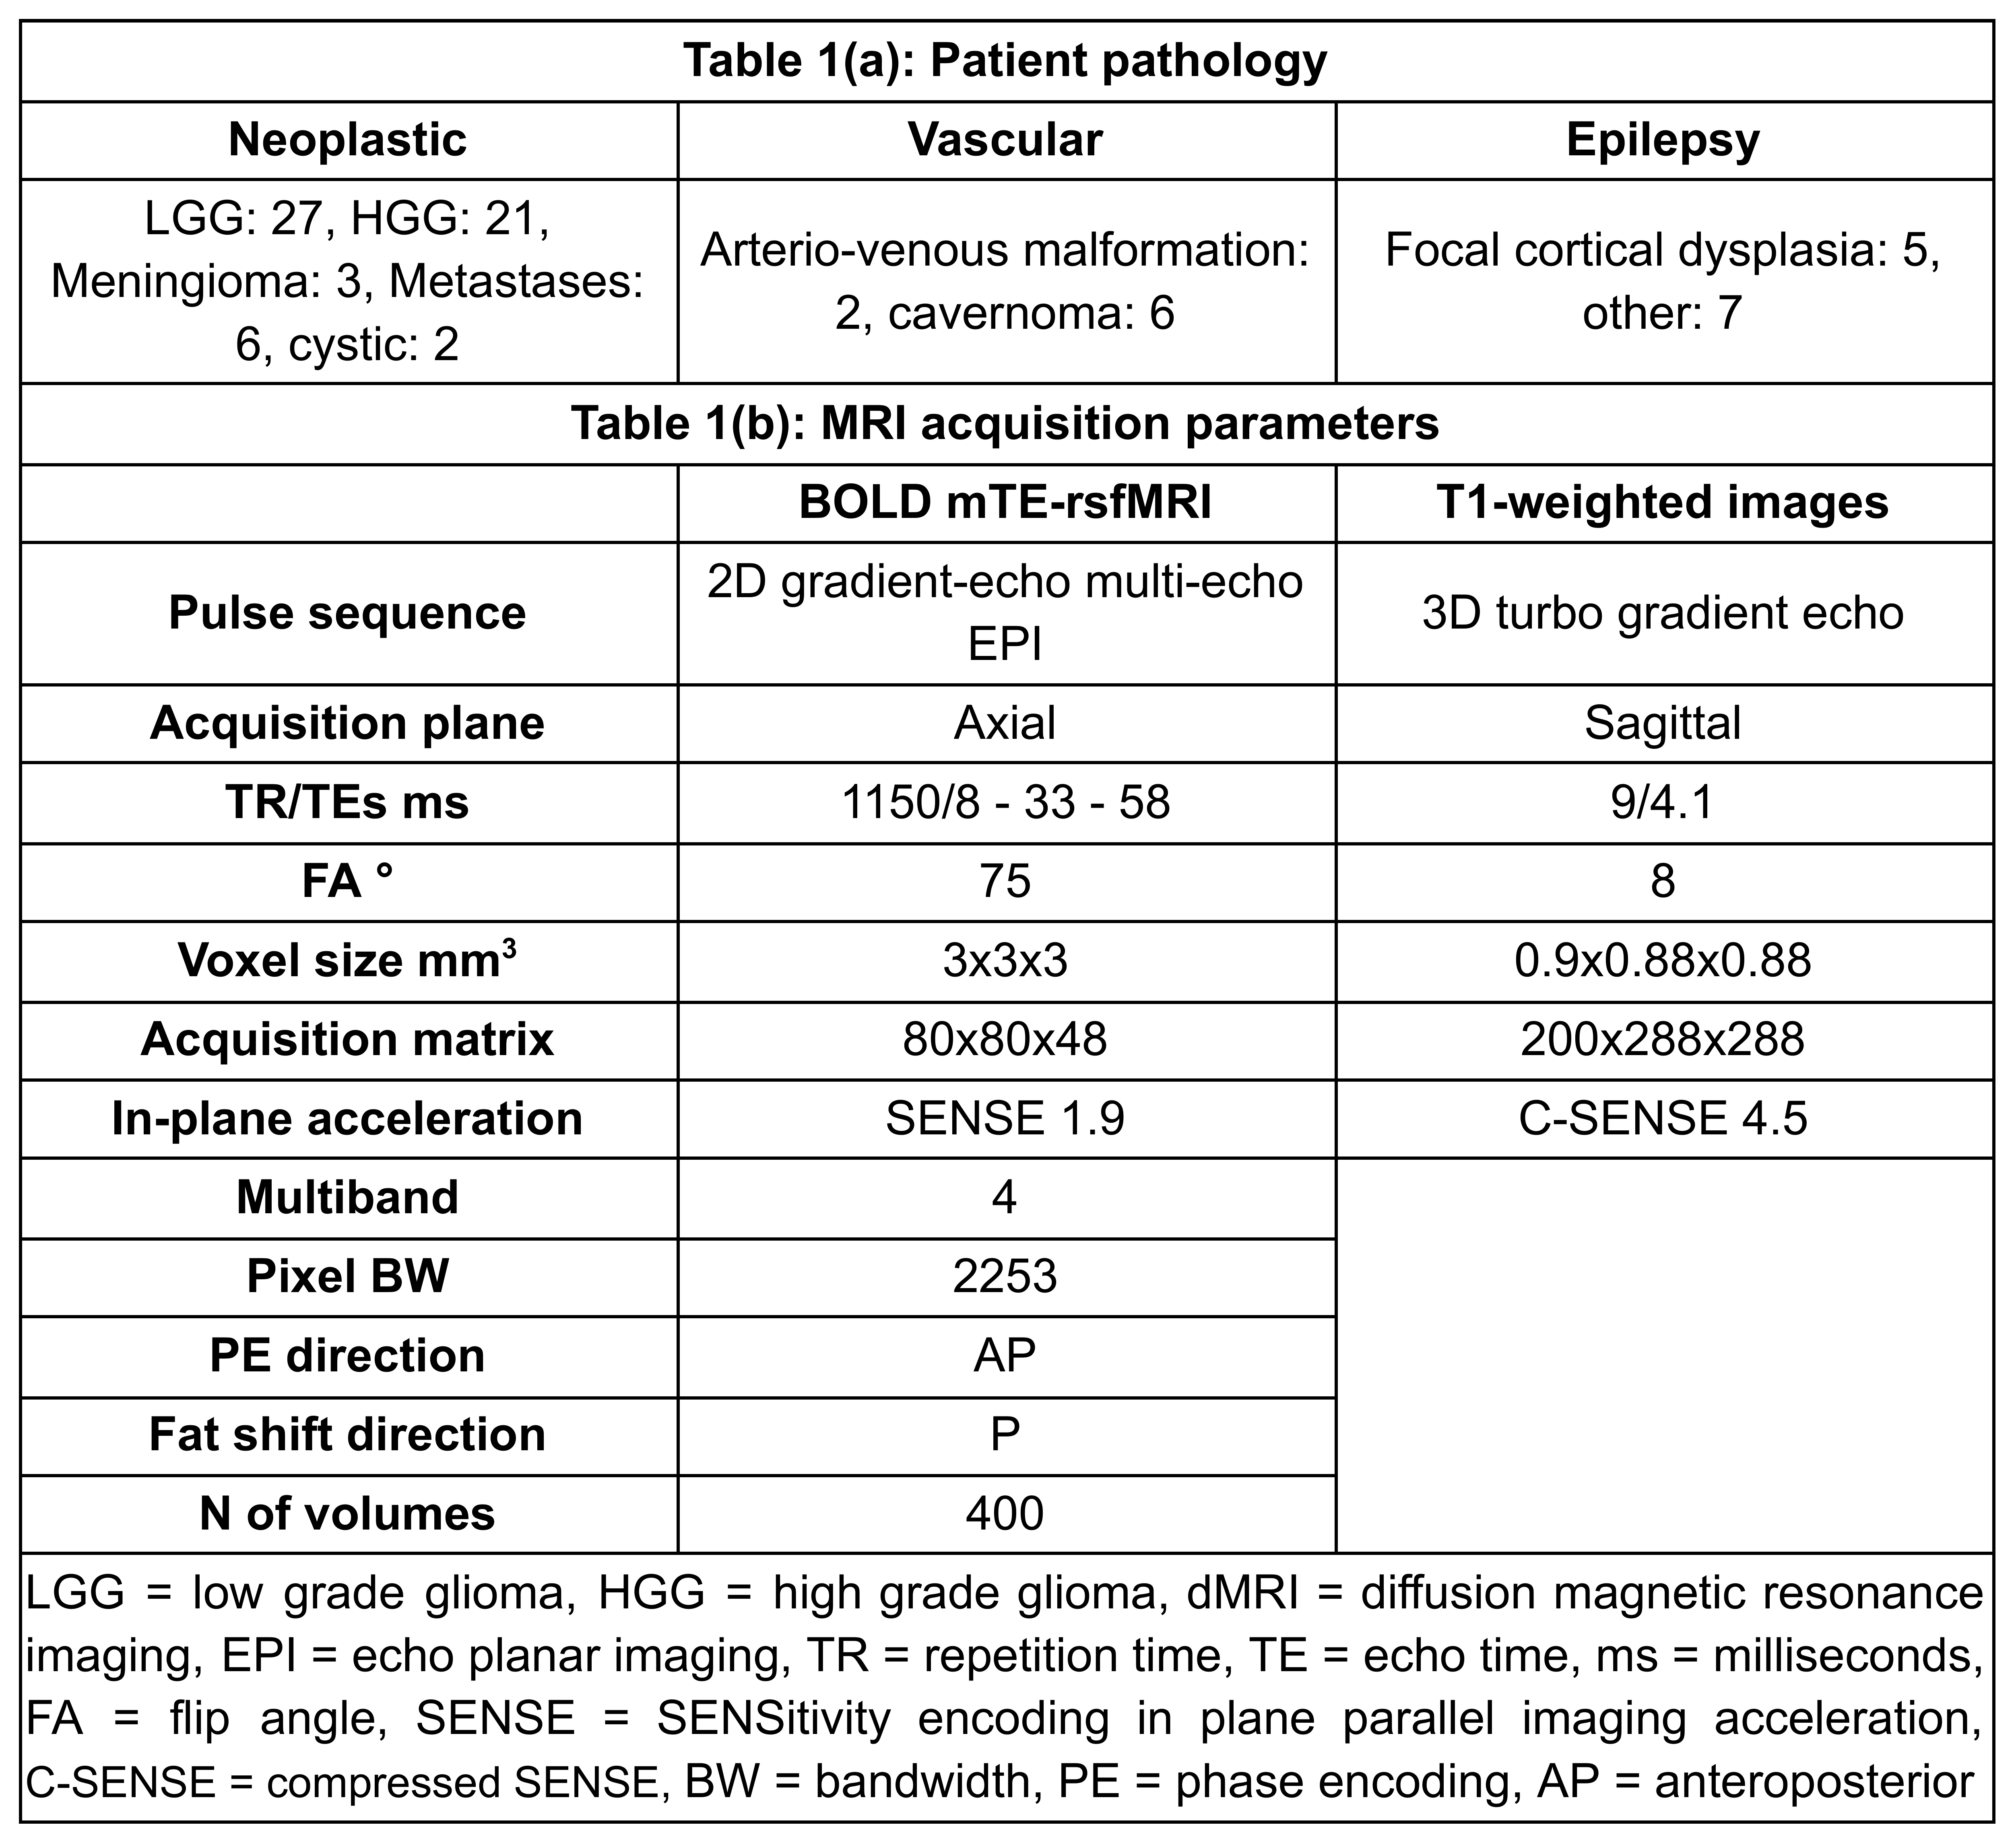
Seventy-nine clinical surgically-naive neurosurgical patients (median age=39, IQR=25.5, range = 8 - 72 years, 38/41 females/males) were recruited, all of whom received oral and written information and provided oral and written consent. Table 1(a) lists a summary of types of pathology. Ten patients were excluded due to lack of multi-echo rsfMRI (mTE-rsfMRI). The study was performed in accordance with the declaration of Helsinki with approval by the institutional ethical committee.MRI data was acquired using two 3-Tesla scanners with 32-channel phased-array receive only head-coils. Imaging included sagittal 3D T1-weighted structural images, and BOLD mTE-rsfMRI images, detailed in Table 1(b). The middle echo (TE=33 ms) images of the mTE-rsfMRI series were used separately as the single-echo rsfMRI (sTE-rsfMRI), and the two rsfMRI datasets were treated as different scan sessions.
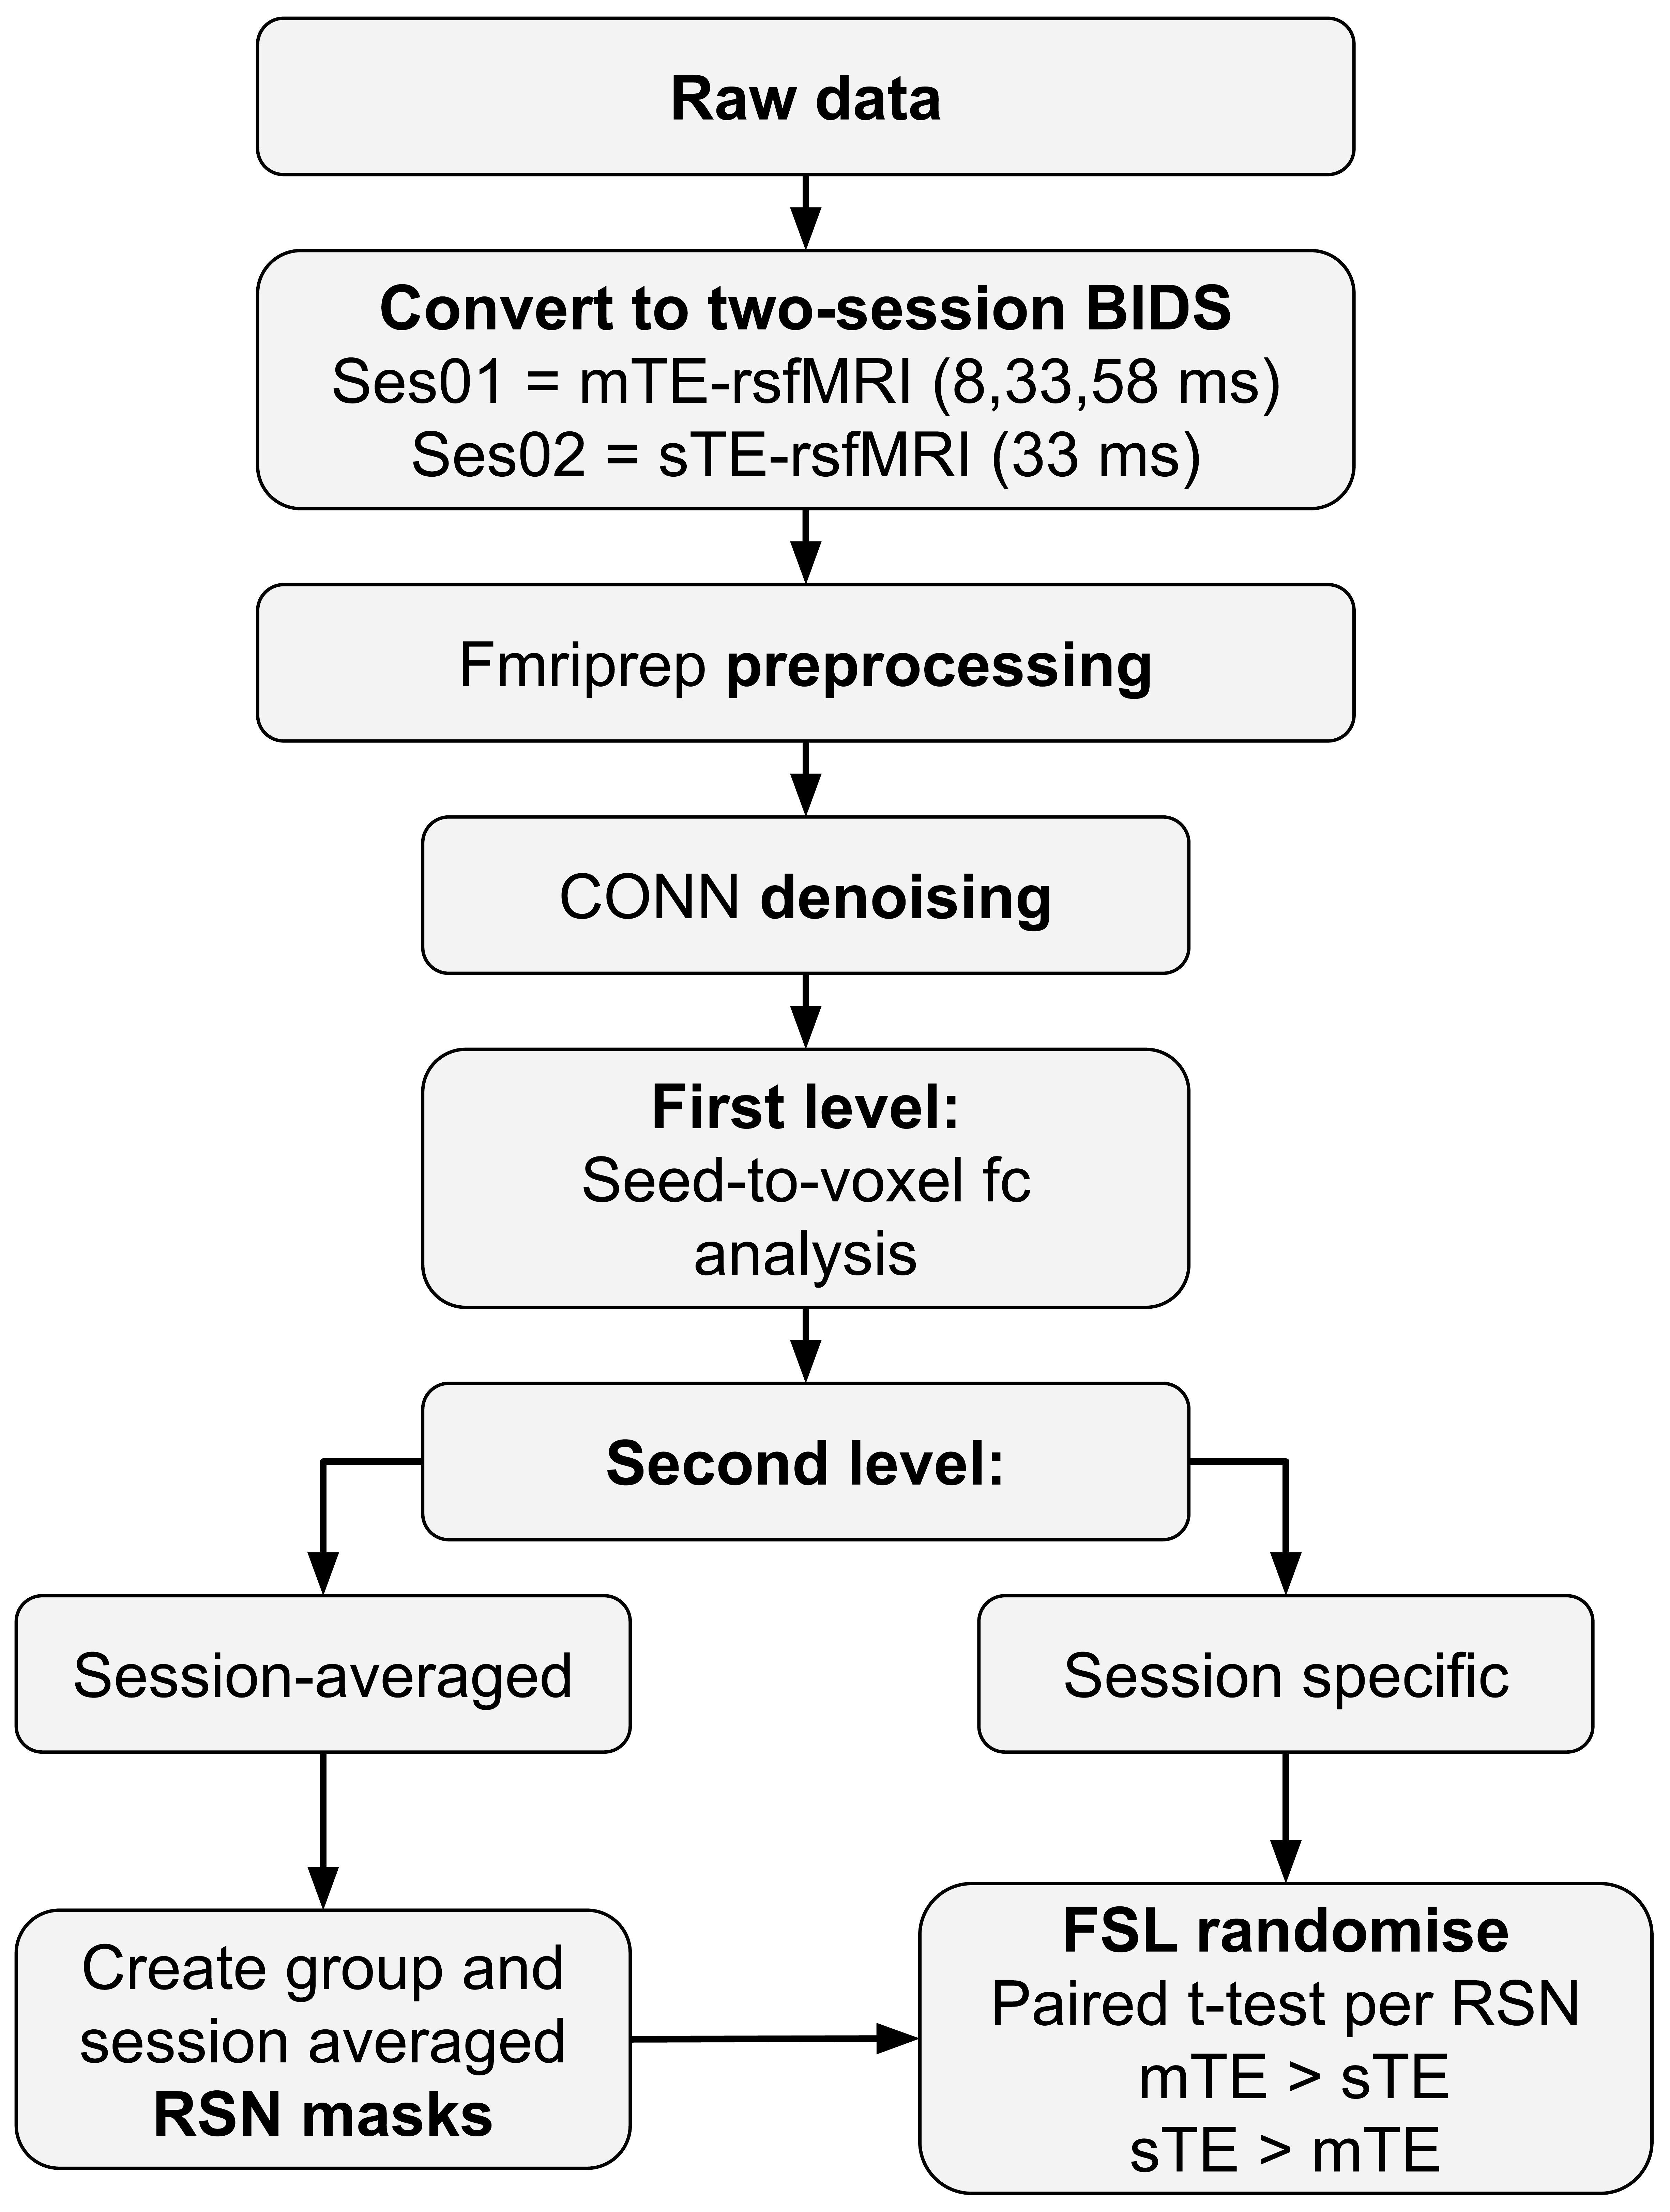
Figure 1 shows a schematic of the data analysis. BOLD rsfMRI data was preprocessed using fmriprep v. 20.2.6 4, to correct for the effects of motion, slice-timing and geometric distortion, coregister BOLD data to native 3D-T1s, and normalise to the MNI152NLIN2009 template, and to optimally-combined BOLD timeseries maps from the mTE-rsfMRI data 5,6. Preprocessed data was imported to CONN 7 and spatially smoothed with a 6 mm 3D Gaussian kernel, denoised, and band-pass filtered with default settings. Seed-to-voxel first- and second-level analyses were used to generate average connectivity maps by computing the average for all regions of each cerebral resting state network (RSN) from the Networks atlas included in CONN. Average connectivity maps were generated for each session (rsfMRI method) separately. RSNs were also generated using data from both sessions (methods) and used to derive RSN binary masks for constraining the t-tests.
FSL 8 randomise 9 with threshold-free cluster enhancement (tfce) was used to run a paired t-test comparing the data between sTE and mTE. Significance was set at p<0.05 corrected for family-wise error (FWE) rate. Comparison was constrained by a mask for each network derived from the two-session average RSNs after thresholding using K-means at k=35%.
Results & Discussion
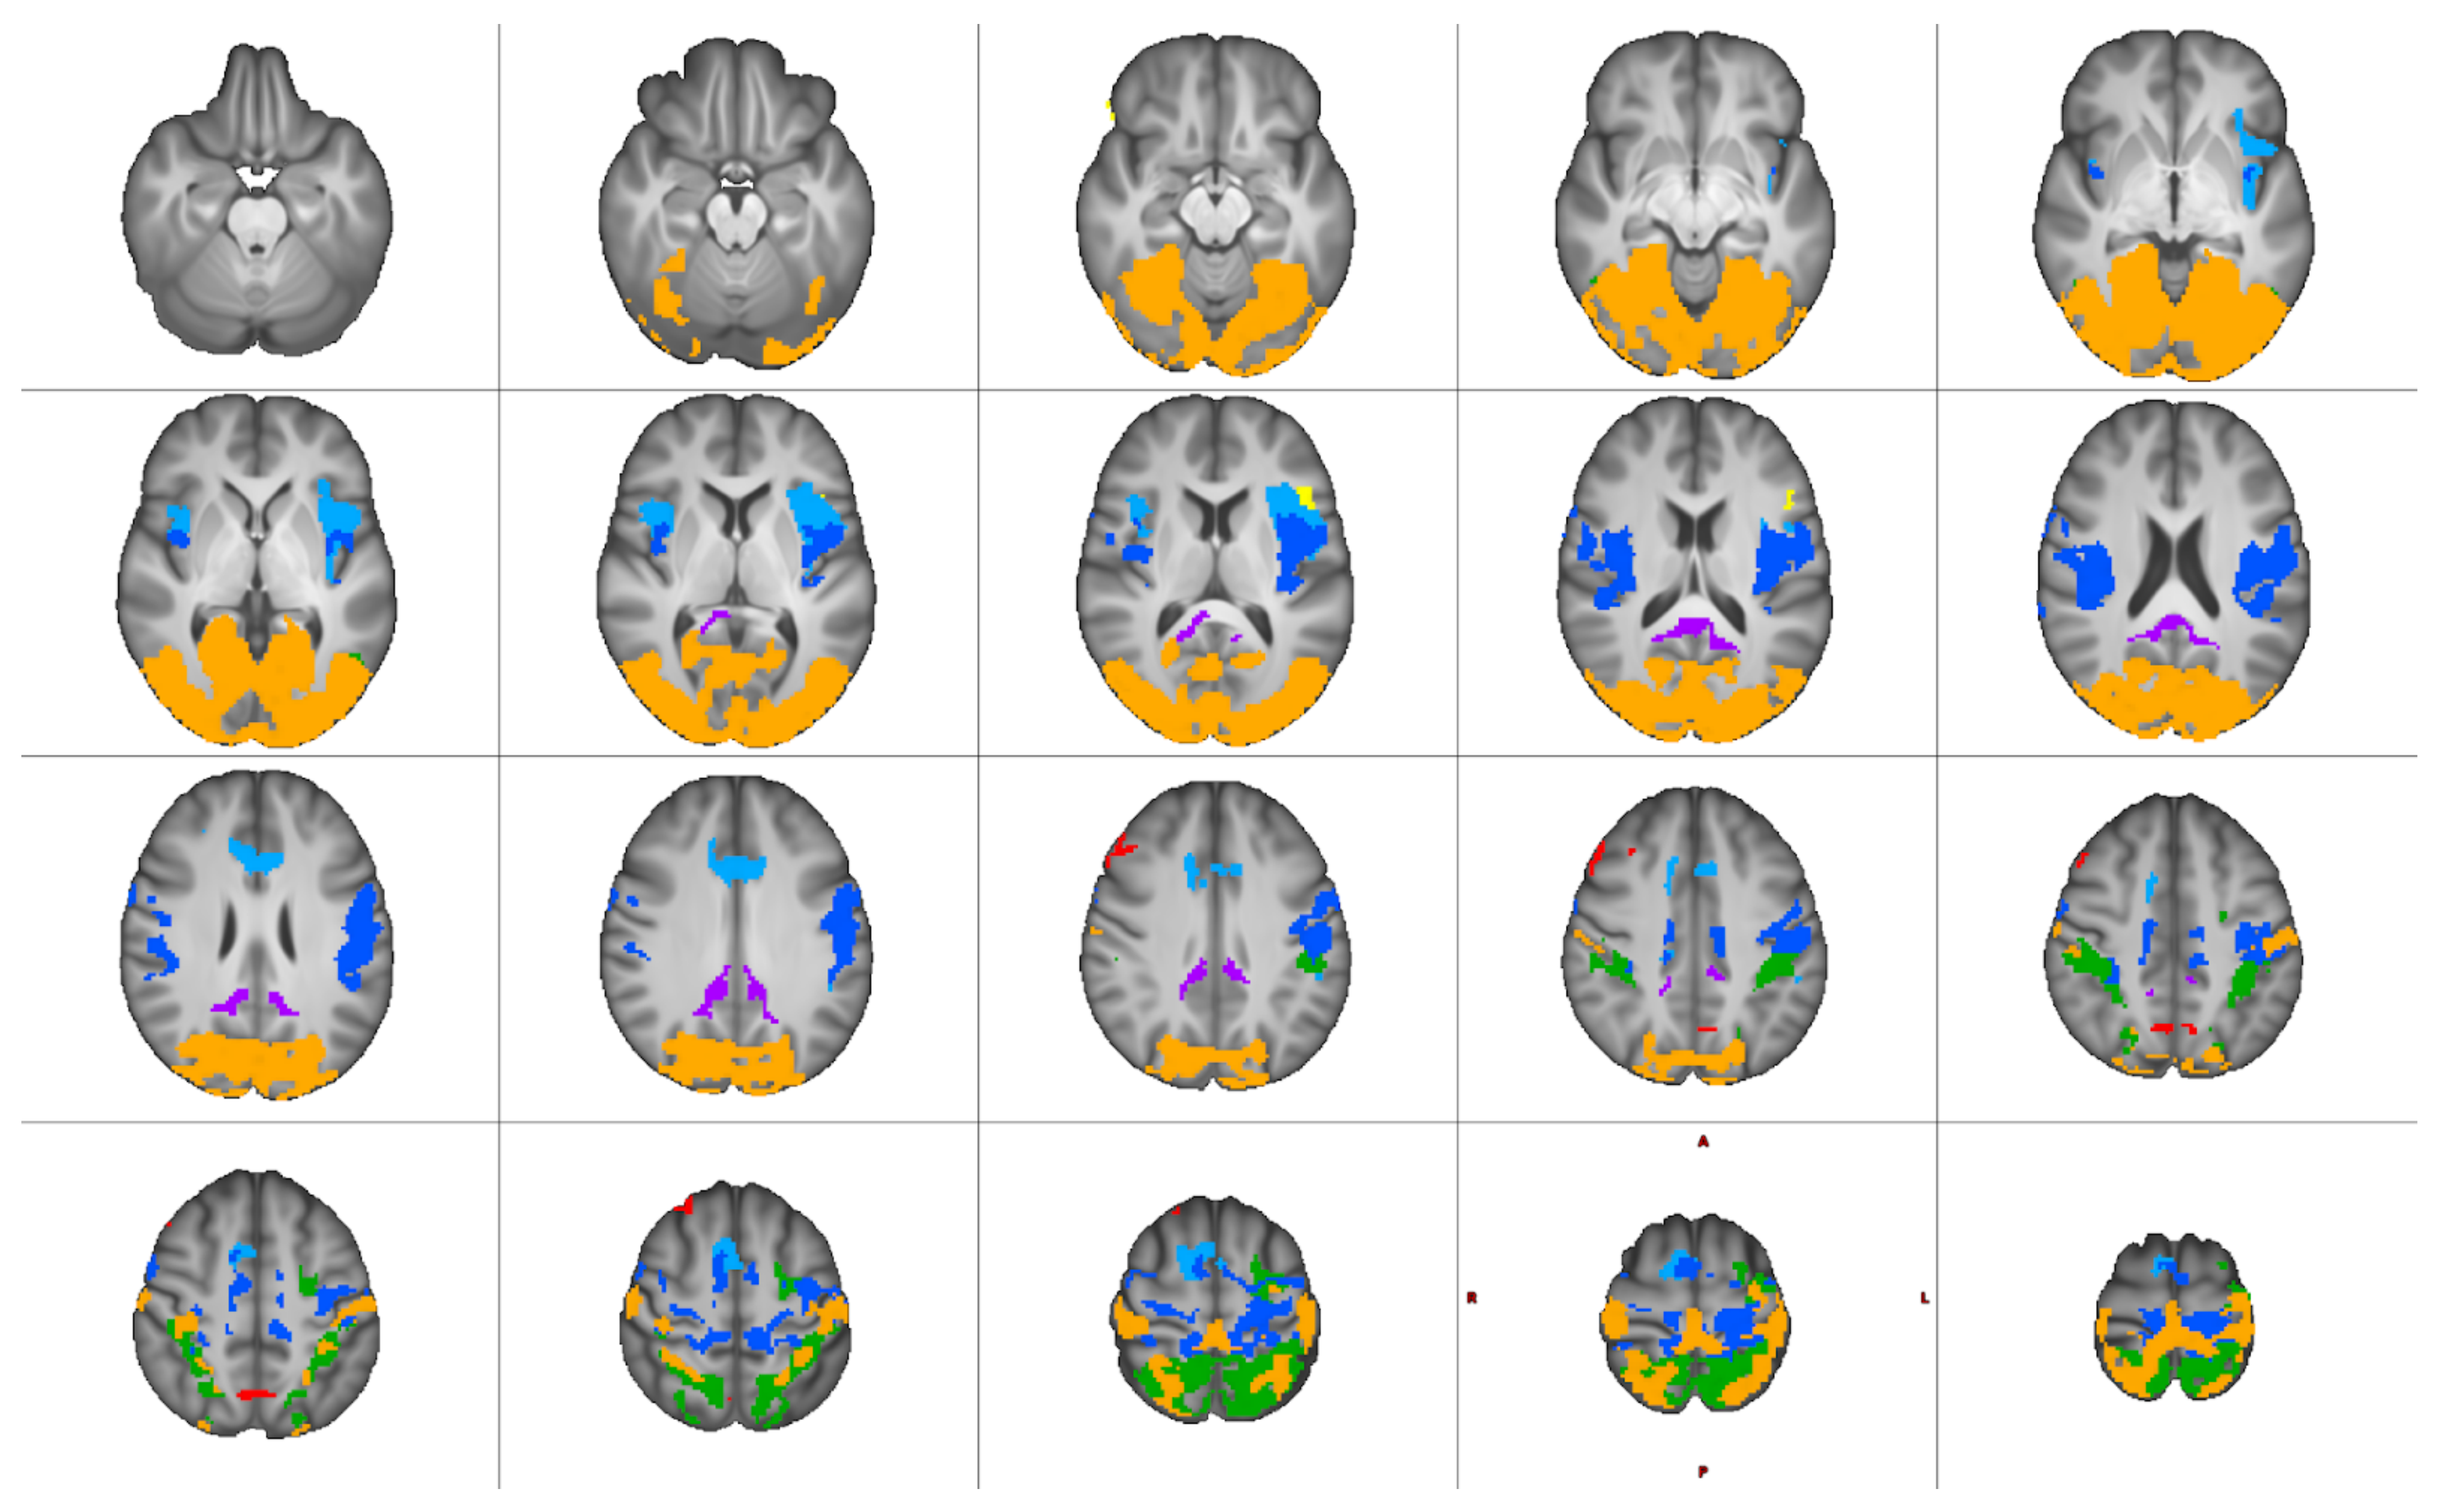
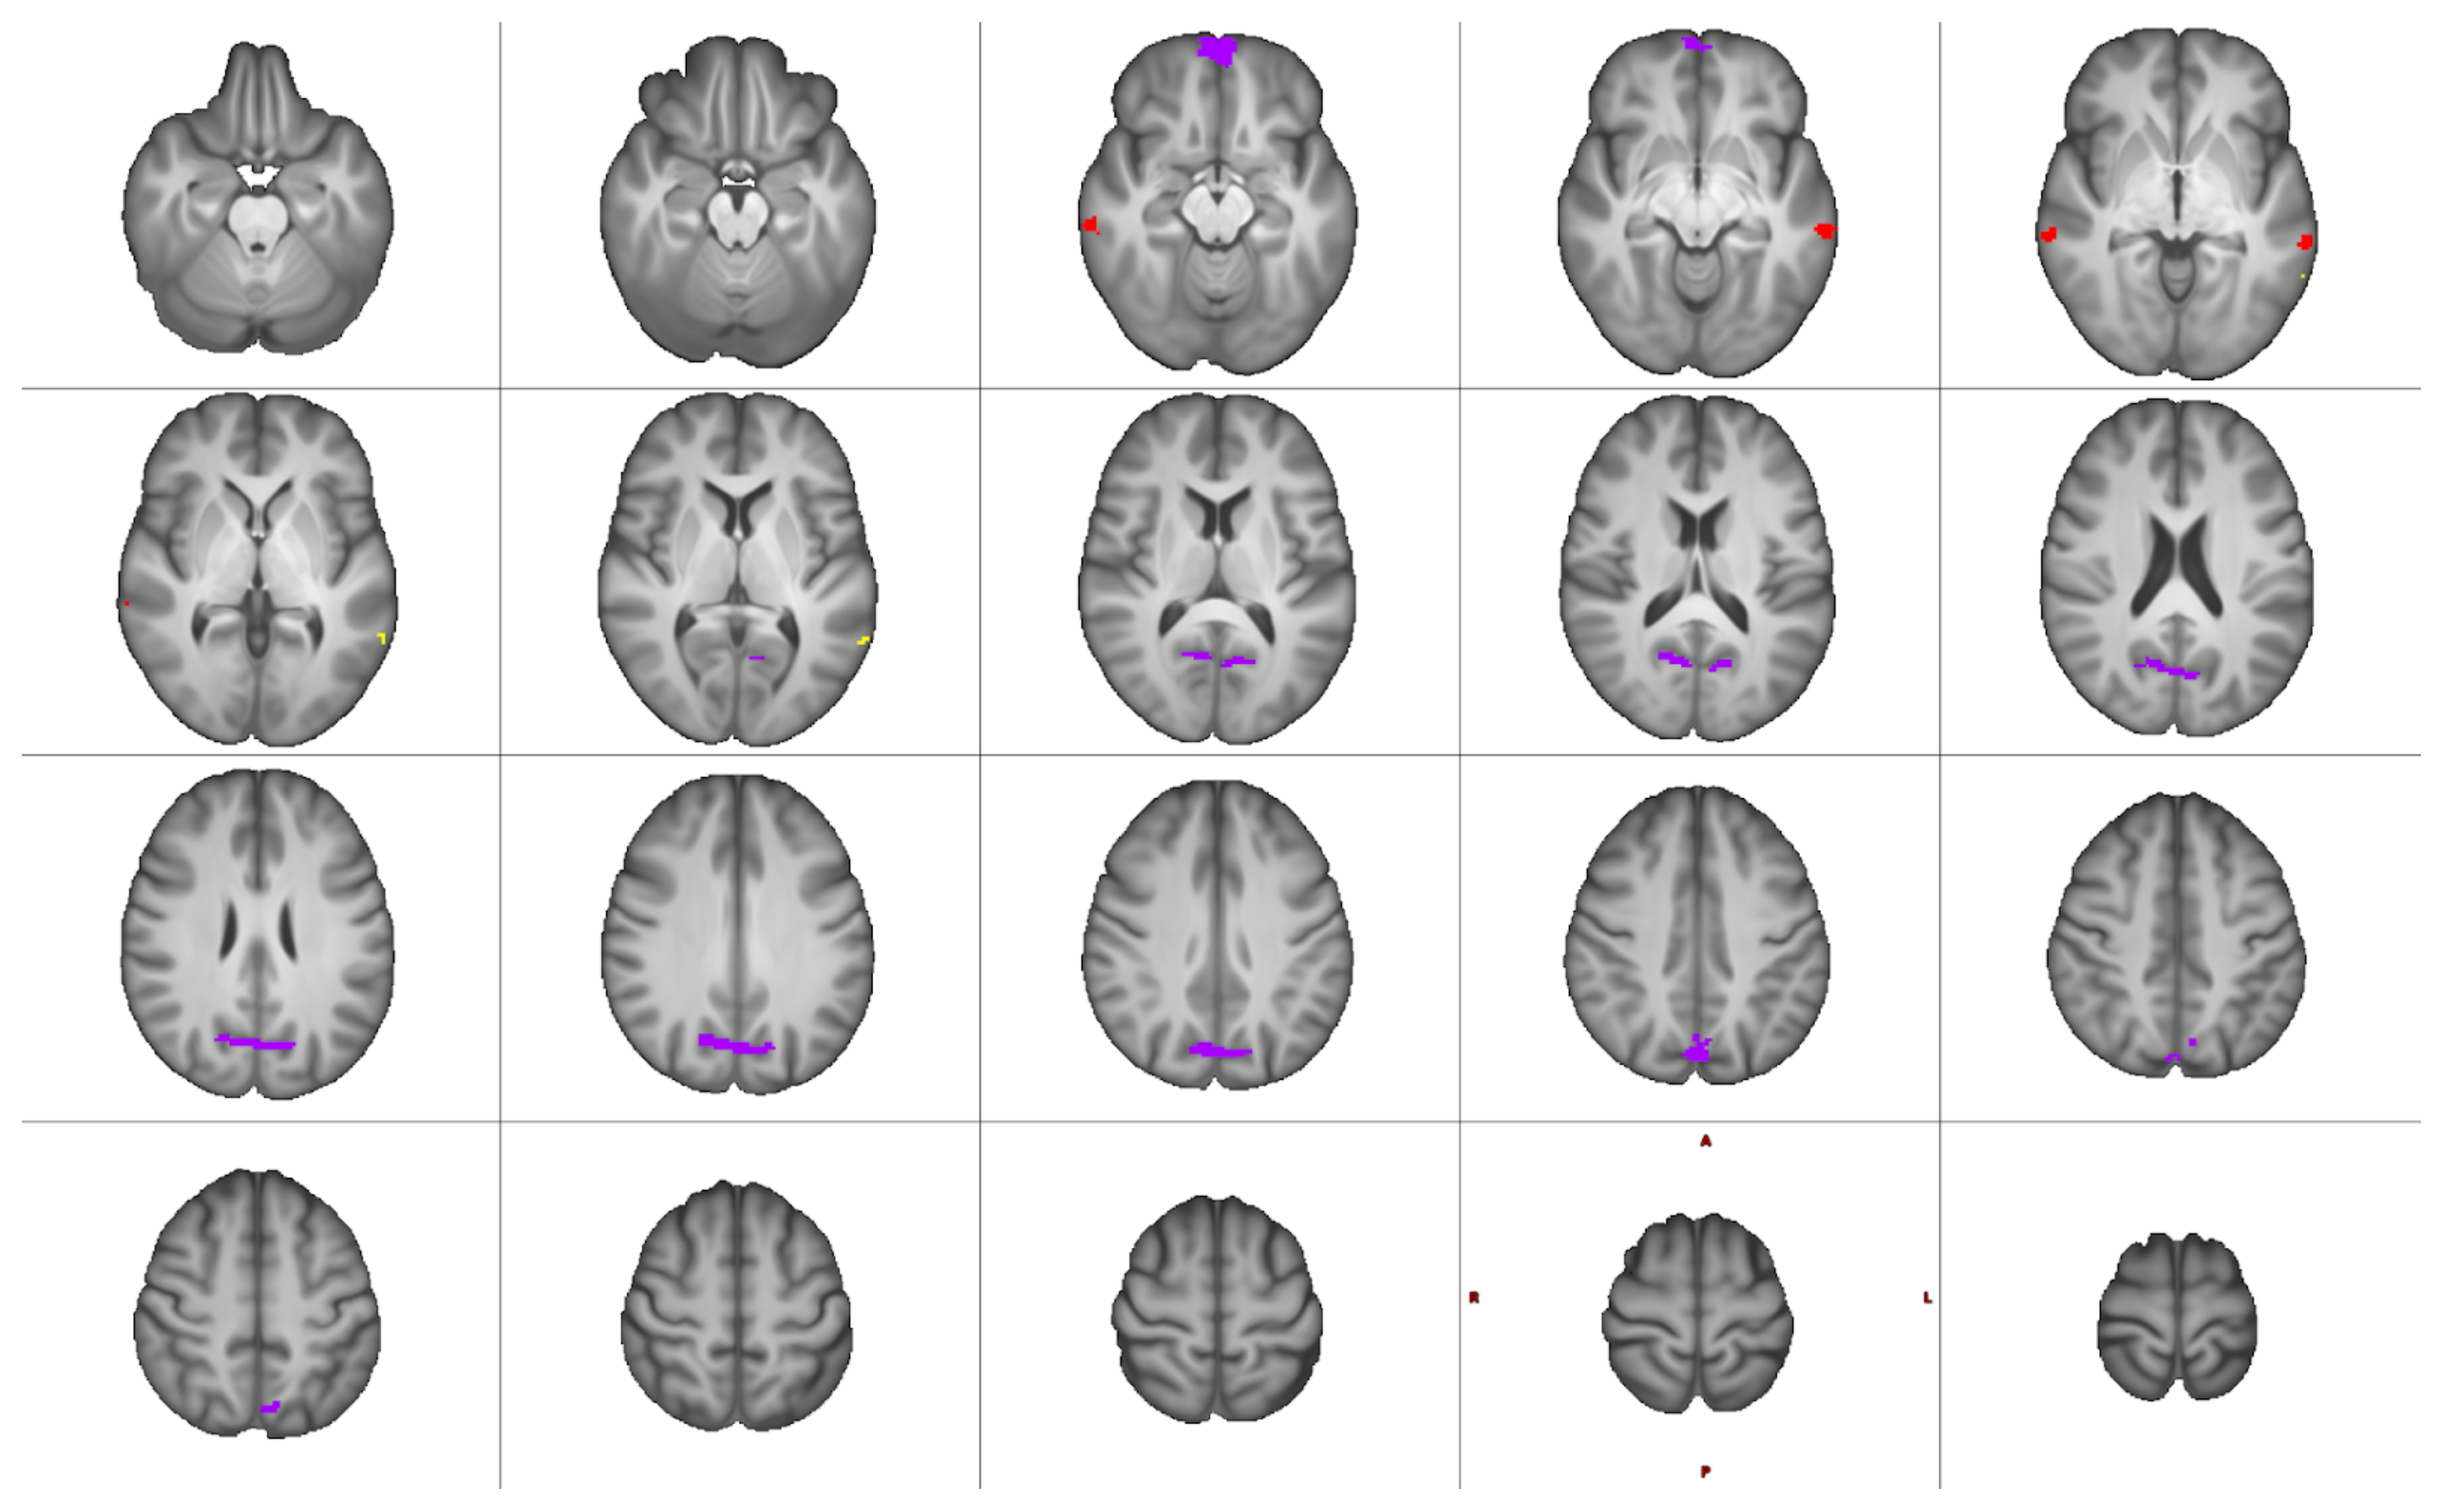
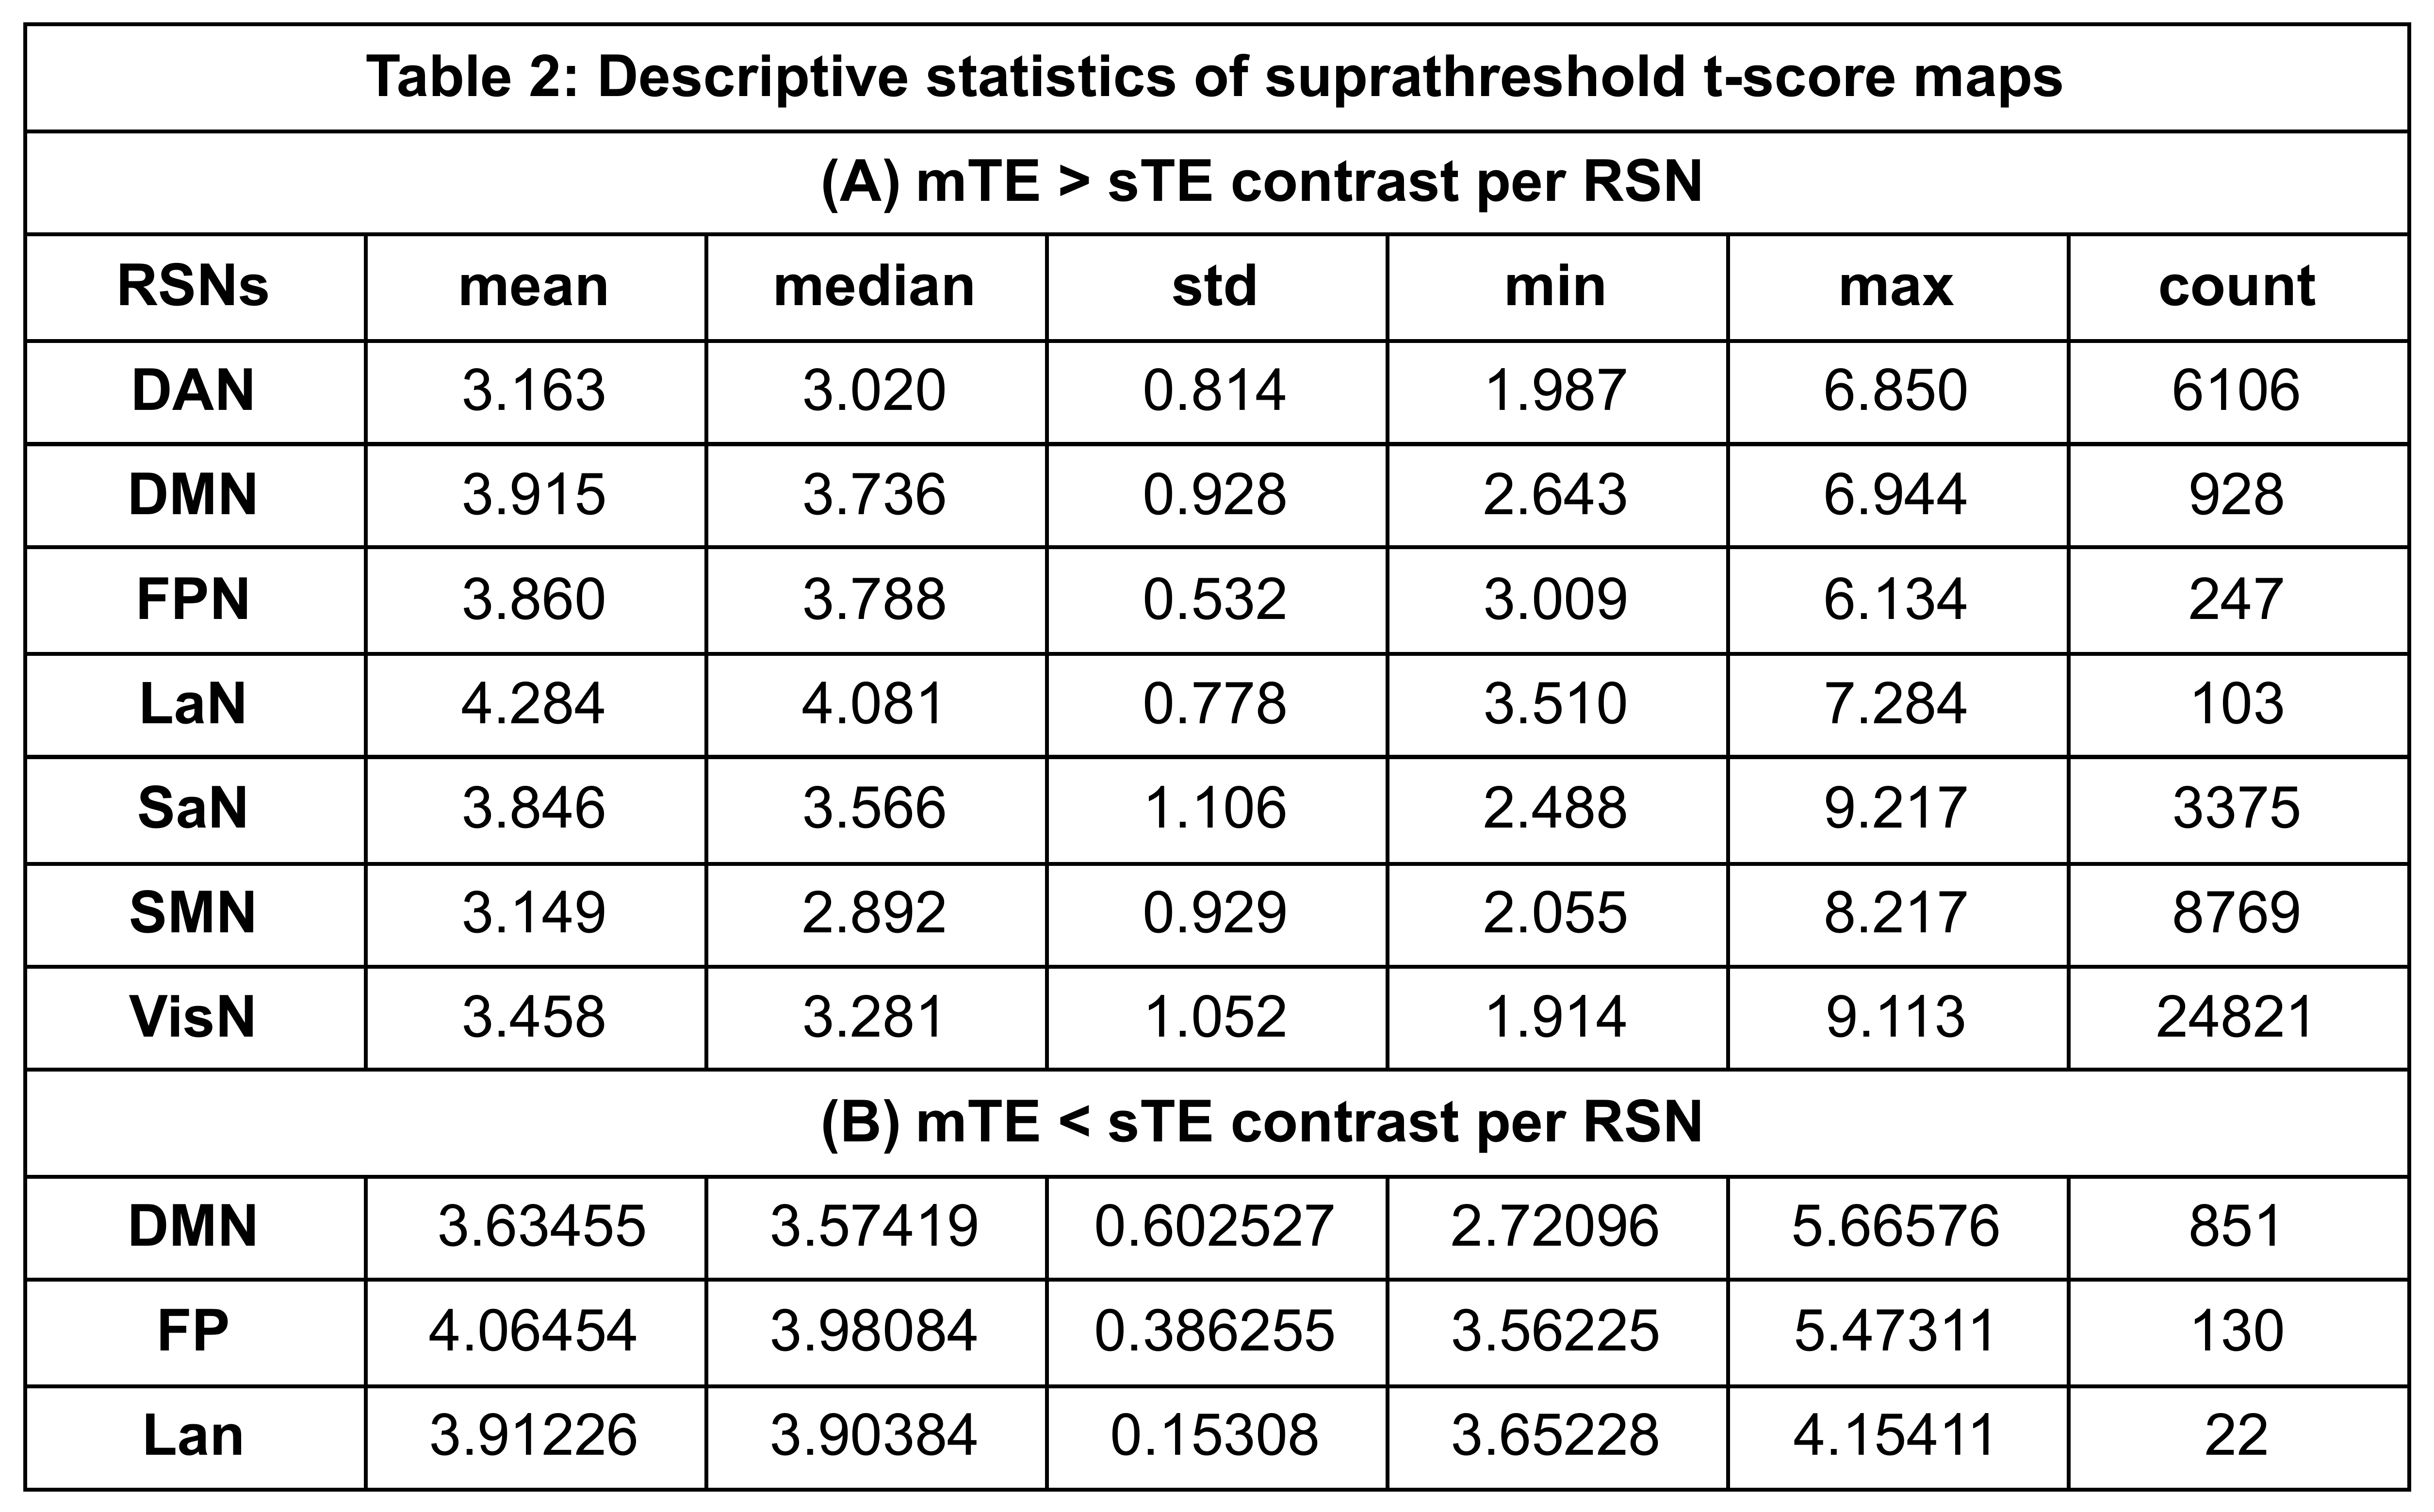
Significantly higher mTE fc was found for the sensory-motor (SMN), default mode (DMN), salience (SaN), frontoparietal (FPN), dorsal attention (DAN), language (LaN), and visual (VisN) networks at pFWE<0.05. Figures 2 and 3 show the results for all RSNs thresholded at pFWE<0.05. These differences were largest in volume for the SMN, VisN, and DAN, while the DMN, LaN, and FPN showed smaller differences.Table 2 lists the descriptive statistics of the supra-threshold t-score maps resulting from the contrast mTE- < sTE-rsfMRI per RSN.
RSN mapping using mTE-rsfMRI showed more extensive results compared to sTE-rsfMRI for all networks. However, in a few RSNs (DMN, LaN, and FPN) sTE-rsfMRI appears to show higher fc compared to mTE-rsfMRI in different areas. Interestingly, this involved the frontal pole for the DMN, an area commonly affected by susceptibility induced geometric distortion, and could potentially indicate a higher tendency of false positive results in this area when sTE-rsfMRI mapping is used. The mTE > sTE-rsfMRI contrast showed more extensive and widespread higher fc compared to the mTE < sTE-rsfMRI contrast. This was particularly notable in the SMN, where the gain from mTE spanned most of the primary and supplementary sensory-motor cortices, and the language network where the difference overlapped with the left inferior frontal gyrus.
These results may also be relevant for presurgical mapping, where single-echo task-based fMRI is typically used and may suffer from imaging artefacts, e.g., in postoperative patients. Additionally, these differences can also affect the concordance between preoperative and intraoperative functional mapping.
This analysis did not specifically account for the presence of lesions, and relied on the default Networks atlas for SBA without correction. In addition, the optimally-combined timeseries data were generated using a single method without tuning or optimization. Further analysis will therefore investigate the within-subject similarity of RSNs generated with the two approaches using more subject specific parcellation maps corrected for lesions.
Acknowledgements
No acknowledgement found.References
1. Kundu, P. et al. Multi-echo fMRI: A review of applications in fMRI denoising and analysis of BOLD signals. NeuroImage 154, 59–80 (2017).
2. Kundu, P., Inati, S. J., Evans, J. W., Luh, W.-M. & Bandettini, P. A. Differentiating BOLD and non-BOLD signals in fMRI time series using multi-echo EPI. NeuroImage 60, 1759–70 (2012).
3. Posse, S. et al. Enhancement of BOLD-contrast sensitivity by single-shot multi-echo functional MR imaging. Magn. Reson. Med. 42, 87–97 (1999).
4. Esteban, O. et al. fMRIPrep: a robust preprocessing pipeline for functional MRI. Nat. Methods 16, 111–116 (2019).
5. DuPre, E. et al. TE-dependent analysis of multi-echo fMRI with *tedana*. J. Open Source Softw. 6, 3669 (2021).
6. Kundu, P. et al. Integrated strategy for improving functional connectivity mapping using multiecho fMRI. Proc. Natl. Acad. Sci. U. S. A. 110, 16187–92 (2013).
7. Whitfield-Gabrieli, S. & Nieto-Castanon, A. Conn: a functional connectivity toolbox for correlated and anticorrelated brain networks. Brain Connect. 2, 125–141 (2012).
8. Jenkinson, M., Beckmann, C. F., Behrens, T. E. J., Woolrich, M. W. & Smith, S. M. FSL. NeuroImage 62, 782–790 (2012).
9. Winkler, A. M., Ridgway, G. R., Webster, M. A., Smith, S. M. & Nichols, T. E. Permutation inference for the general linear model. NeuroImage 92, 381–397 (2014).
10. Gorgolewski, K. J. et al. The brain imaging data structure, a format for organizing and describing outputs of neuroimaging experiments. Sci. Data 3, 1–9 (2016).
Figures