0237
Disrupted vein-dominated connectivity and increased CSF involvement in ischemic stroke human brain
Jianyu Yuan1, Chaogang Tang2, Lei Zhang2, and Yi He1
1Guangdong Provincial Key Laboratory of Biomedical Imaging and Guangdong Provincial Engineering Research Center of Molecular Imaging, The Fifth Affiliated Hospital, Sun Yat-sen University, Zhuhai, China, 2Department of Cerebrovascular Disease, The Fifth Affiliated Hospital, Sun Yat-sen University, Zhuhai, China
1Guangdong Provincial Key Laboratory of Biomedical Imaging and Guangdong Provincial Engineering Research Center of Molecular Imaging, The Fifth Affiliated Hospital, Sun Yat-sen University, Zhuhai, China, 2Department of Cerebrovascular Disease, The Fifth Affiliated Hospital, Sun Yat-sen University, Zhuhai, China
Synopsis
Keywords: Brain Connectivity, fMRI (resting state)
High-resolution resting-state (rs) fMRI enables the functional mapping of vein-dominated connectivity, correlated with neuronal calcium signals. Here, we performed high-resolution rs-fMRI to examine 30 ischemic stroke patients with binocular isotropic hemianopia and 10 healthy controls. The results of seed-based and independent component analysis (ICA) demonstrated the reduced vein-dominated correlation patterns. Interestingly, ICA also found increased correlations between cerebrospinal fluid (CSF) and ischemic lesions in stroke patients, showing ultra-slow oscillation frequencies up to 0.04 Hz. Our findings suggest that ischemic lesions are associated with CSF, prompting disruption of vein-dominated connectivity.Introduction
Stroke is a fatal disease with high morbidity, disability and recurrence rates, closely related to a focal or widespread loss of blood flow [1]. Our previous work performed high-resolution single-vessel fMRI to map spatiotemporal correlations of venous BOLD fMRI fluctuations, demonstrating the vein-dominated connectivity correlated with neuronal intracellular calcium signals [2]. Here, we used high-resolution resting-state functional magnetic resonance imaging (fMRI) to investigate how ischemic lesions affect vessel-specific connectivity in the human stroke brain.Methods
All MR images were acquired on a 3T GE MRI scanner with a 32-channel head coil. We examined 30 ischemic stroke patients with homonymous hemianopia (male/female: n=23/7; mean±SD: 60.5 ± 8.8 years) and 9 healthy controls (male/female: n=3/6; mean±SD: 64.4 ± 6.8 years).High-resolution Resting-state fMRI images: we obtained resting-state fMRI images covering the occipital lobe in the coronal orientation with the following parameters: TR=4500 ms, TE=30 ms, FA=90°, matrix = 256 × 256, FOV = 256 ×256 mm2, in-plane resolution = 1×1 mm2 and 21 slices with thicknesses of 1.5 mm.
Diffusion MRI (dMRI) images: a diffusion-weight EPI sequence was employed in the same range with fMRI using b=1000 and 2000 s/mm2, TR = 5600 ms, TE = 100 ms, matrix = 128×128, FOV = 256 × 256 mm2, in-plane resolution = 2 x 2 mm2, and 16 slices with thickness = 4.5 mm. All data were processed and analyzed by AFNI, MRtrix3, and Independent Component Analysis (ICA) Toolbox (GIFT 4.0).
Results
Disrupted vein-dominated connectivity in stroke patients. As our previous work, the seed-based correlation maps of healthy controls demonstrated vein-dominated correlation spatial patterns (Fig. 1 B-E). However, when we selected individual veins around the infarct as seeds, the seed-based analysis exhibited weak connectivity with other veins (Fig. 1G-H). Furthermore, the seed-based correlation maps show similar venule-specific correlation patterns only in the hemisphere without lesions (Fig. 1I-J).To avoid selection bias in seed-based analysis, we performed an ICA analysis in stroke patients. The first component (Com1) maps of ICA demonstrated vein-dominated patterns in the normal hemisphere while dysconnectivity in the hemisphere with lesions, which are consistent with the seed-based analysis in stroke patients (Fig. 2). The 3D reconstruction clearly showed the decreased vessel-specific connectivity induced by infarcts in stroke patients. (Fig. 3A). The mean power spectrum density (PSD) of the ICA-Com1 (n=30) indicated the ultra-slow oscillation up to 0.04 Hz (Fig. 3B-C). The venous component ratios in ROI-Infarct are significantly lower than that in ROI-normal (*, p<0.05, n = 10, Fig. 3D-E).
The increased functional connectivity between CSF and ischemic lesions in stroke patients. We also found one interesting ICA component in stroke patients, showing the correlation patterns between ischemic lesions and CSF (Fig. 4). The 3D ICA reconstruction showed CSF-dominated correlation patterns (ICA-Com2) overlaid with lesions (Fig. 5A). BOLD fMRI from the CSF and the lesions fluctuated at the ultra-slow frequency to 0.04 Hz (Fig. 5B-C). Furthermore, the CSF component ratios in ROI-Infarct are significantly higher than that in ROI-normal (*, p < 0.05, n = 10, Fig. 5D-E).
Discussion
Mestre et al. [3] implemented multimodal in vivo imaging in rodents and demonstrated that CSF rushes into the rodents' brains, causing swelling after a stroke. There is still no in-vivo human study to support it. Here, we used high-resolution rs-fMRI to further confirm that ischemic lesions are associated with CSF in the human brain, prompting disruption of vein-dominated connectivity.Conclusion
We performed high-resolution rs-fMRI to reveal brain connectivity dysfunction in stroke patients. We found reduced vessel-specific connectivity induced by infarcts but increased functional connectivity between CSF and ischemic lesions in stroke patients. CSF and lesions shared similar ultra-slow oscillation up to 0.04 Hz, suggesting that ischemic lesions are associated with CSF, prompting disruption of vein-dominated connectivity. The study demonstrated the feasibility of high-resolution rs-fMRI in the functional assessment of stroke, opening the way for vessel-specific connectivity in stroke assessment.Acknowledgements
We thank the Analysis of Functional NeuroImages (AFNI) team for software support. This work was supported by grants from the National Natural Science Foundation of China (No. 82201447), the Department of Science and Technology of Guangdong Province (2018B030322006), the Hundred Talents Program of Sun Yat-sen University (The Fifth Affiliated Hospital, 202101).References
1. Silasi G, Murphy TH: Stroke and the connectome: how connectivity guides therapeutic intervention. Neuron 2014, 83(6):1354-1368.
2. He Y, Wang M, Chen X, Pohmann R, Polimeni JR, Scheffler K, Rosen BR, Kleinfeld D, Yu X: Ultra-Slow Single-Vessel BOLD and CBV-Based fMRI Spatiotemporal Dynamics and Their Correlation with Neuronal Intracellular Calcium Signals. Neuron 2018, 97(4):925-939 e925.
3. Mestre H, Du T, Sweeney AM, Liu G, Samson AJ, Peng W, Mortensen KN, Staeger FF, Bork PAR, Bashford L et al: Cerebrospinal fluid influx drives acute ischemic tissue swelling. Science 2020, 367(6483)
Figures
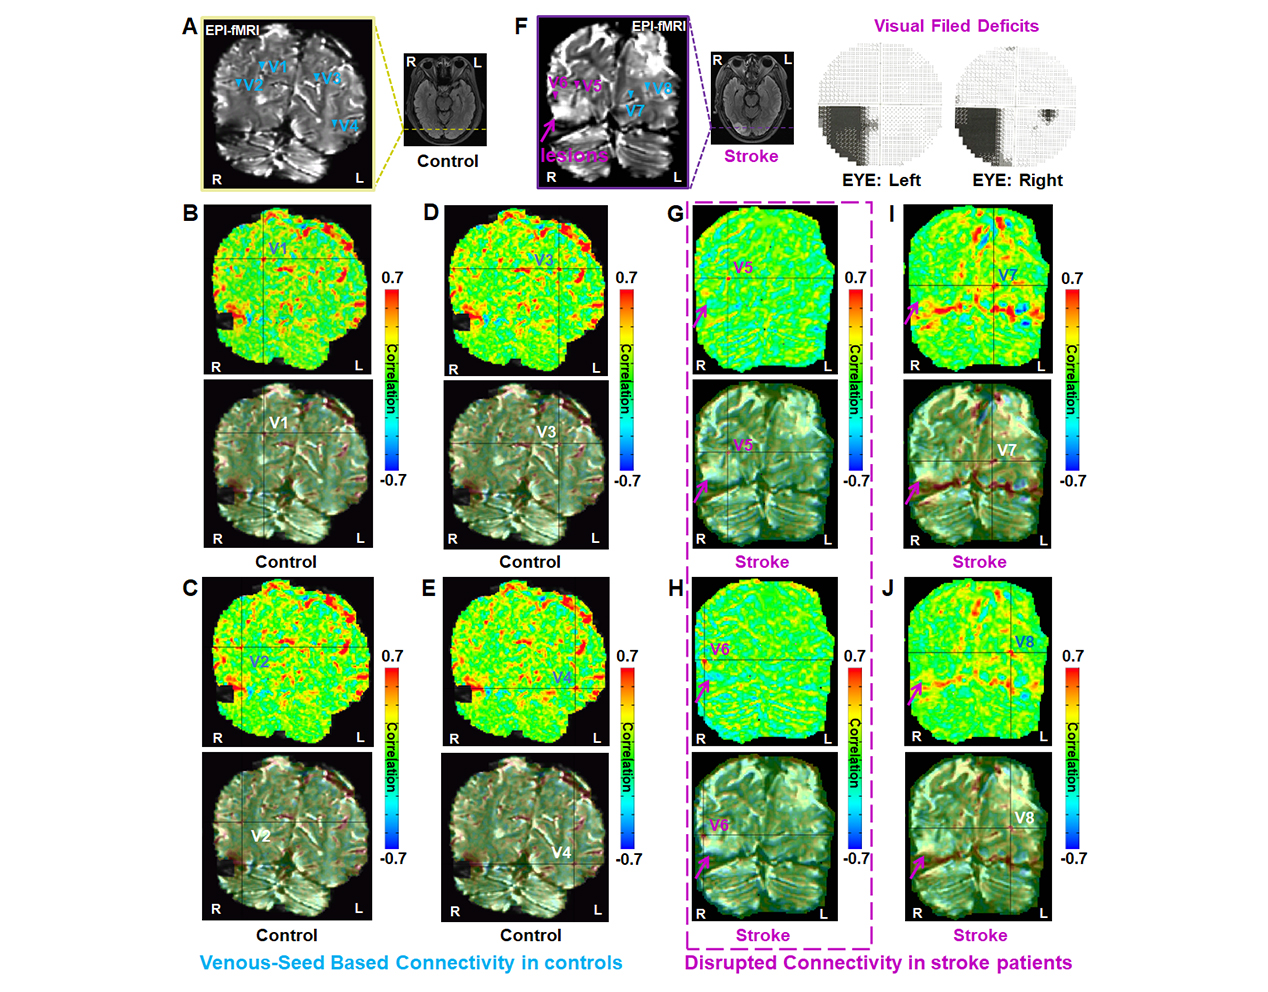
Figure 1. Disrupted venous seed-based connectivity
in ischemic stroke patients. A. The high-resolution
EPI map shows sulcus veins in the occipital lobe of healthy control (blue
arrowheads: vein 1 (V1)-V4). B-E. The seed-based correlation
maps from resting-state fMRI demonstrated vein-dominated correlation spatial
patterns (Seeds: V1-V4). F. A stroke patient
with visual field deficits. G-H. The disrupted vein-specific correlation
when vein-seed is located near lesions (Seeds: V5&V6). I-J. The
vein-dominated connectivity in the hemisphere without lesions (Seeds: V7&V8)
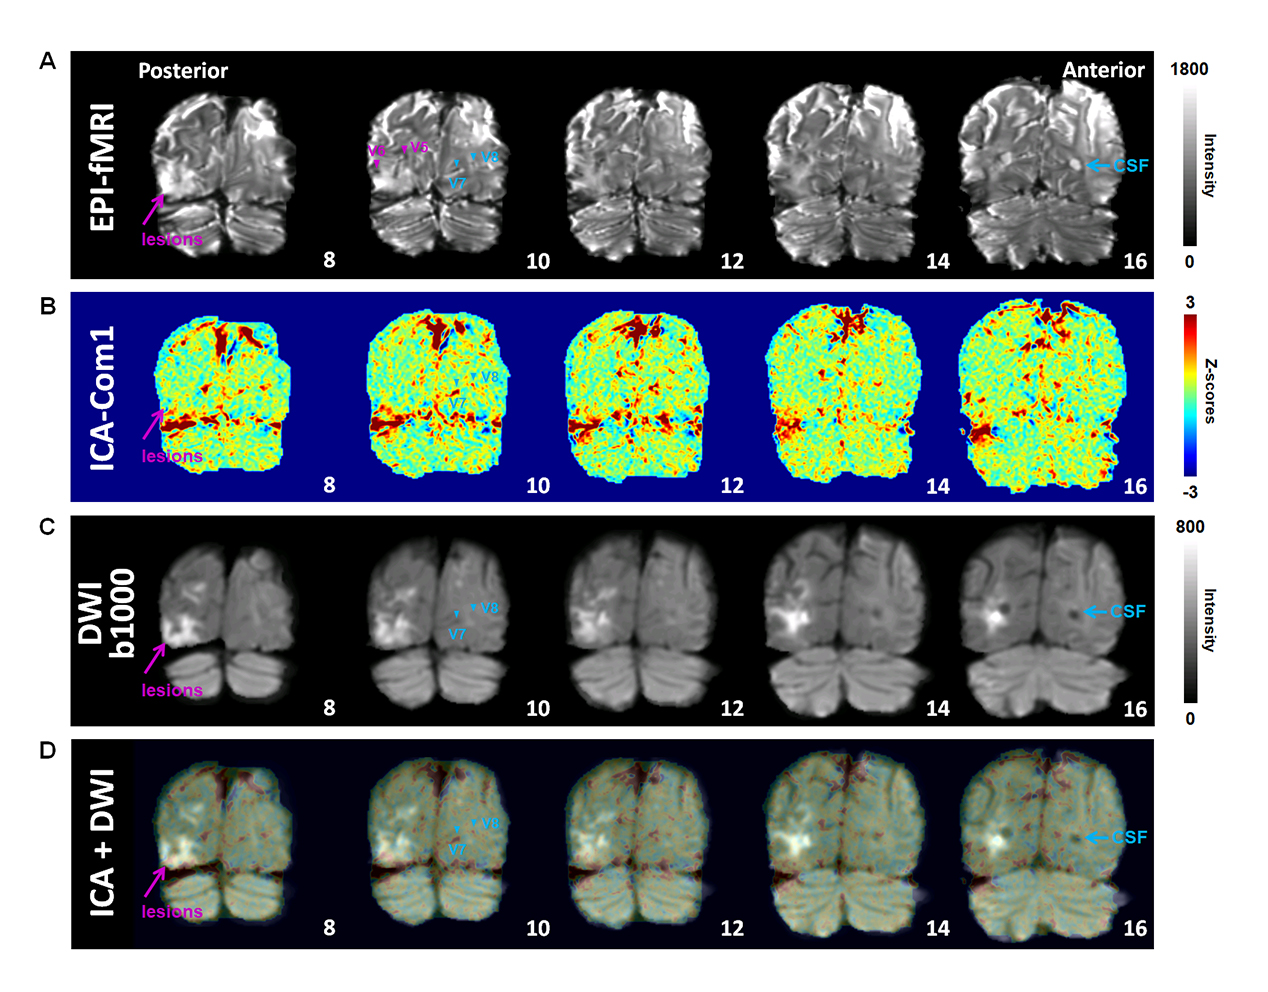
Figure 2. The ICA results are consistent
with the seed-based analysis in stroke patients. A. The EPI images displayed ischemic lesions, V5&V6, V7&V8,
and ventricles with CSF. B. The first component (Com1) maps of ICA
demonstrated vein-dominated patterns in the normal hemisphere, while dysconnectivity
in the hemisphere with lesions. C. DWI images with b = 1000 s/mm2.
D. The ICA-Com1 maps (B) overlaid with DWI (C).
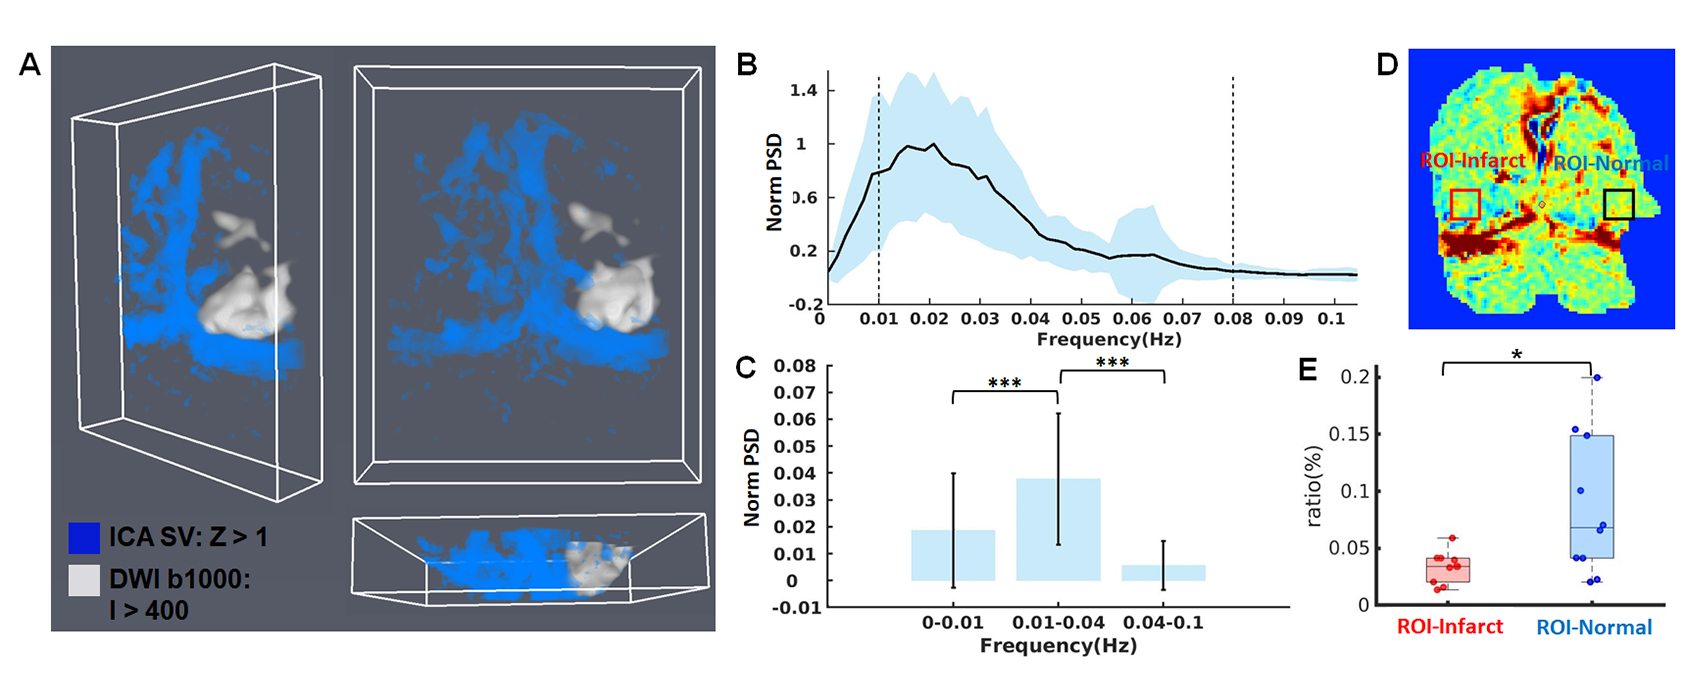
Figure 3. The decreased vessel-specific connectivity
induced by infarcts in stroke patients. A. The ICA reconstruction showed a 3D vascular correlation structure disrupted by infarcts. B. The normalized power spectral density (PSD)
of the ICA-Com1 (n=30). C.
The mean PSD of the low-frequency range (0.01–0.04 Hz) is significantly higher
than that of the frequency ranges (< 0.01 Hz & 0.04-0.1 Hz: ***, p<0.01)).
D. One ICA-Com1 slice shows the ROI-Infarct and the ROI-Normal. E. The
venous component ratios in ROI-Infarct are significantly lower than that
in ROI-normal (*, p<0.05, n = 10).
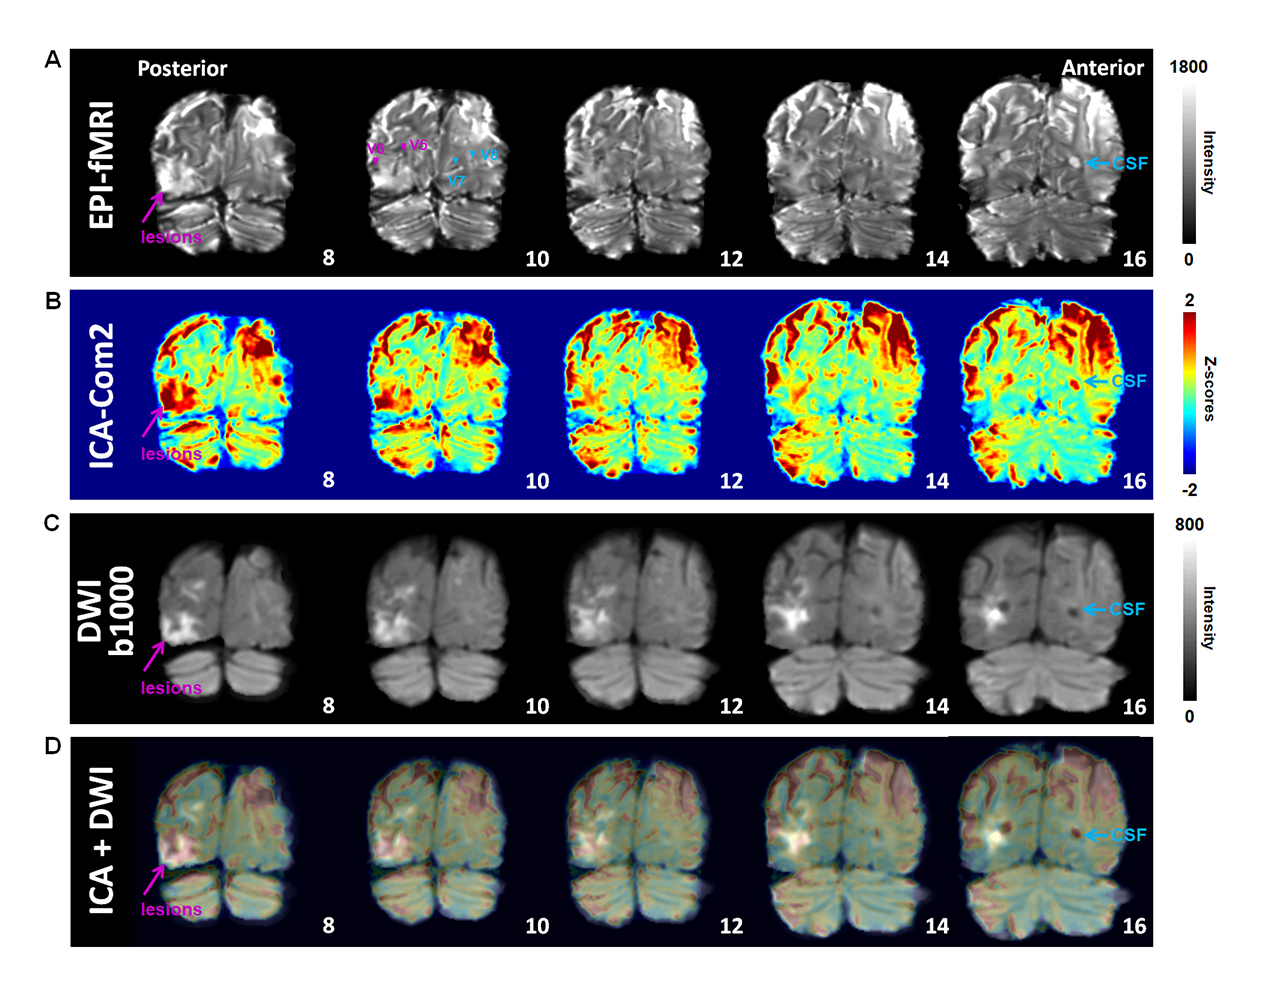
Figure 4. The correlation patterns between ischemic lesions and CSF in stroke patients. A. The EPI images exhibited ischemic lesions and ventricles with CSF. B. The second component (Com2) maps of ICA demonstrated the connectivity between ischemic lesions and CSF. C. DWI images with b = 1000 s/mm2. D. The ICA-Com2 maps (B) overlaid with DWI (C).
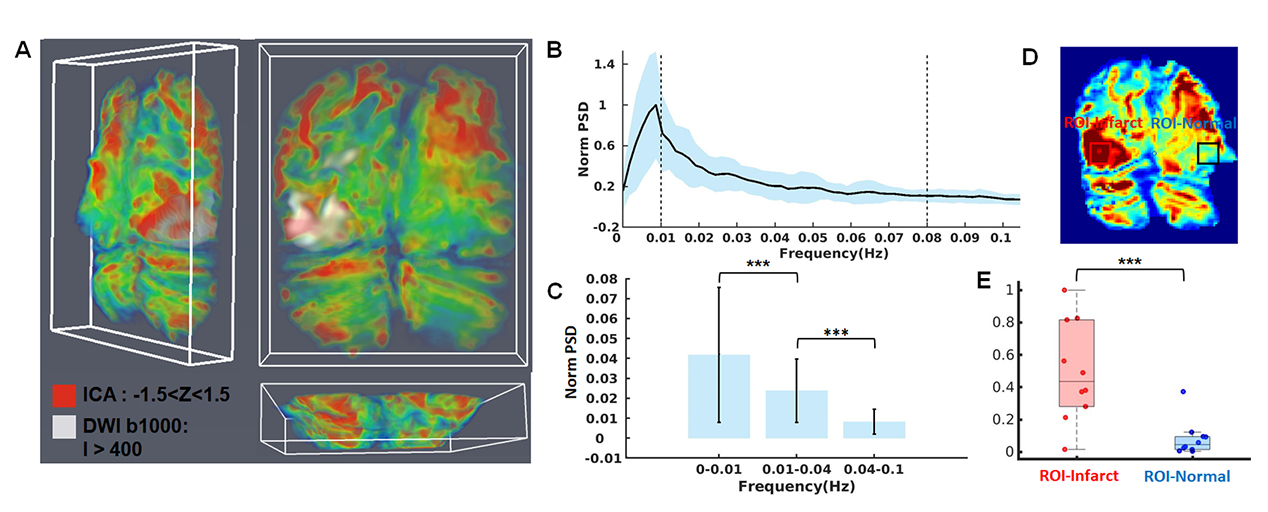
Figure 5. The increased functional connectivity between CSF and ischemic lesions in stroke patients. A. The 3D ICA reconstruction showed CSF-dominated correlation patterns (ICA-Com2) overlaid with lesions. B. The PSD of the ICA-Com2 from stroke patients (n=30). C. The mean PSD of the low-frequency range (0.01–0.04 Hz) is significantly higher than that of the frequency ranges (0.04-0.1 Hz: ***, p < 0.01)). D. One ICA-Com2 slice displays the ROI-Infarct and the ROI-Normal. E. The CSF component ratios in ROI-Infarct are significantly higher than that in ROI-normal (*, p < 0.05, n = 10).
DOI: https://doi.org/10.58530/2023/0237