0234
Functional connectivity changes of brainstem nuclei in prodromal Parkinson’s disease: A 7 Tesla resting-state study1Brainstem Imaging Laboratory, Department of Radiology, Athinoula A. Martinos Center for Biomedical Imaging, Massachusetts General Hospital and Harvard Medical School, Boston, MA, United States, 2Escuela Nacional de Estudios Superiores Unidad Juriquilla, Universidad Nacional Autónoma de México, Querétaro, Mexico, 3Department of Neurology, Massachusetts General Hospital and Harvard Medical School, Boston, MA, United States, 4Division of Sleep Medicine, Harvard University,, Boston, MA, United States
Synopsis
Keywords: Parkinson's Disease, fMRI (resting state), 7 Tesla MRI, REM sleep behavior disorder, prodromal PD, alpha synucleopathies, brainstem
Based on animal and human lesion studies, isolated rapid-eye-movement (REM) sleep behavior disorder (iRBD) is due to changes in arousal/motor brainstem nuclei structure and function and is recognized as the hallmark of Parkinson disease (PD). Resting-state fMRI studies in iRBD in humans mostly studied changes in nigrostriatal/nigrocortical connectivity pathway but failed to assess the brainstem circuits involved. To fill this gap, we investigated the functional connectivity of 20 brainstem nuclei relevant for iRBD using high-sensitivity and high spatial-resolution 7 Tesla resting-state fMRI, as well as a recently developed in-vivo probabilistic atlas of brainstem nuclei.
Introduction
Isolated rapid eye movement (REM) sleep behavior disorder (iRBD) is characterized by REM sleep without atonia and dream-enactment behaviors1 and is one of the earliest manifestations of α-synucleinopathies. iRBD patients have up to a 96.6% risk of developing a neurodegenerative synucleinopathy (including Parkinson’s disease (PD), dementia with Lewy bodies, and multiple system atrophy) after 14 years from diagnosis2. Based on rat studies, this prodromal synucleinopathy may be due to decreased excitatory glutamatergic connectivity in the brainstem between the sublaterodorsal tegmental nucleus (i.e. the equivalent of the peri-locus coeruleus-alpha in cats and of nucleus subcoeruleus in humans) and premotor GABA/glycinergic neurons of the medullary reticular formation responsible for physiologically inducing muscle atonia during REM sleep3-7(Figure1). In humans, few resting-state functional magnetic resonance imaging (fMRI) studies have been performed in iRBD/prodromal PD8-11, which mostly study nigrostriatal and nigrocortical connectivity pathway but fail to address the brainstem circuits involved. This is due to the lack of a brainstem nuclei atlas in living humans, and limited resolution of conventional MRI scanners to precisely delineate in-vivo small nuclei such as subcoeruleus.Purpose
To this end, we investigated the resting-state functional connectivity of 20 brainstem nuclei relevant for iRBD/prodromal PD, the ventral and dorsal spinal cord and hypothalamus in human iRBD patients and controls using high-sensitivity and high spatial-resolution 7 Tesla resting-state fMRI, as well as a recently developed in-vivo probabilistic atlas of brainstem nuclei in stereotactic (Montreal-Neurological-Institute —MNI) space12-17.Materials and Methods
Data acquisition: Eight patients with iRBD (age 68.25±6.7y) and ten age/gender-matched controls (age 66.3±6.3y) underwent 7 Tesla MRI under IRB-approval. T1-weighted multi-echo MPRAGE (MEMPRAGE): Isotropic voxel size/repetition-time(TR)/echo-times(TEs)/inversion-time/flip-angle(FA)/field-of-view/bandwidth/GRAPPA-factor/slice orientation/slice acquisition-order/acquisition-time: 0.8mm/2.53s/[2.39, 5.62ms] ms/1.1s/7°/240×240×240mm3/“332Hz/pixel”/3/ sagittal/anterior-posterior/6′34′′. fMRI: Functional gradient-echo EPIs were acquired with the subjects at rest with their eyes closed (isotropic-voxel-size/matrix size/GRAPPA-factor/nominal echo-spacing/readout bandwidth/N.slices/slice orientation/slice acquisition order/TE/TR/FA/simultaneous-multi-slice factor/N.repetitions/phase encoding direction/acquisition time per run=1.1mm/180×240/3/0.82ms/“1488Hz/ Px”/123/sagittal/interleaved/32ms/2.5s/75°/3/210/anterior-posterior/9’25”). Field-map: It was acquired to perform distortion-correction with: isotropic voxel size/matrix size/readout bandwidth/N. slices/slice orientation/slice acquisition order/TE1/TE2/TR/FA/simultaneous-multi-slice factor/ phase encoding direction=2.0mm/116x132/“1515 Hz/Px”/80/sagittal/interleaved/3.00ms/4.02ms/570.0ms/36°/2’15’’/anterior-posterior.Data analysis: a) Preprocessing: MEMPRAGE image was rotated to standard-orientation, bias-field corrected and parcellated with Freesurfer18. b) fMRIs were corrected for physiological noise (RETROICOR19), slice-timing corrected, reoriented, distortion- (FSL, using the field-map) and motion-corrected (Freesurfer). The time-averaged image of the first run was bias-field corrected (SPM) and coregistered to the MEMPRAGE using affine and nonlinear (AFNI20) transformations, which were then applied to the whole time-series. Further, a set of nuisance regressors (including motion, respiration-volume-per-unit-time, cardiac-rate, and time-courses in the cerebrospinal-fluid surrounding the brainstem) were computed and regressed out (Matlab2019b). Time-courses were then scaled to percentage signal changes. No spatial smoothing was performed. Band-pass filtering was applied between 0.01 Hz and 0.1 Hz (AFNI). Any residual temporal mean was removed. c) Region-based connectivity analysis: As seeds we used 20 brainstem nuclei relevant for iRBD/prodromal PD (for a list of nuclei see Figure 1,2), the ventral and dorsal spinal cord and the hypothalamus. For each subject, we computed the Pearson’s correlation coefficient between the average time-courses within seeds, computed the Fisher-z-transformation, averaged it across subjects and displayed it with a 2D-circular plot (‘connectome’). We used two-sample t- test (two-sided, p < 0.05) to compare the differences in Fisher z-values between groups and displayed the affected pathway links using 2D circular connectomes.
Results
In controls, we found high inter-connectivity among brainstem nuclei involved in motor and arousal functions, REM atonia and synucleinopathy progression(Figure 2A). In Figure 2B we show connectivity changes in iRBD compared to controls. Specifically, in iRBD group viscer-sensory motor nuclei (VSM), which includes dorsal motor nucleus of the vagal nerve, showed increased connectivity with subcoeruleus (SubC) and the inferior medullary reticular nucleus (iMRt) and decreased connectivity with pontis oralis (PnO-PnC) and substantia nigra subregions (SN1, SN2) as compared to controls. Importantly, SubC, the “master REM sleep switch”21 showed increased connectivity with VSM, dorsal raphe (DR) and contralateral SubC. Medullary reticular formation nuclei (iMRt and sMRt) showed increased connectivity with VSM, pedunculotegmental nucleus (PTg) and reduced connectivity with laterodorsaltegmental nucleus (LDTg-CGPn) and SN2. Raphe nuclei showed reduced connectivity with SN1/2 and increased connectivity with SubC and locus coeruleus (LC). Also, ventral spinal cord showed reduced connectivity with VSM and LDTg-CGPn. SN subregions showed reduced connectivity with VSM, sMRt, LC, parvocellular reticular nucleus-alpha (PCRtA) and raphe nuclei.In Figure 3 we show the summary diagram of the functional links affected in iRBD from a system neuroscience perspective. REM-on areas (e.g. SubC), REM sleep muscle atonia areas (e.g. iMRt) and SN2 (compatible with pars compacta) displayed the highest number of changed links among the network, while REM-off areas (e.g. PAG) were the least affected.
Discussion and Conclusion
The observed functional connectivity changes of REM-on and REM atonia regions in iRBD in humans are in line with animal studies of iRBD; and of the VSM are in line with the Braak hypothesis4 (stage1). These findings substantiate investigation of iRBD to better understand synuclein pathology and propagation dynamics. We speculate that decreases in connectivity are indicative of synuclein-related neurodegeneration, while increases suggest compensatory mechanisms in iRBD compared to controls. This is the first study in living humans showing brainstem functional connectivity changes in isolated RBD as compared to controls, which may help understanding pathways involved in synuclein pathology and dynamics of progression.Acknowledgements
NIH (NIA-R01AG063982); Massachusetts-General-Hospital Claflin-Distinguished-Scholar-Award; Harvard-University Mind-Brain-Behavior-Faculty-Award
References
1. Schenck CH, Bundlie SR, Ettinger MG, et al. Chronic behavioral disorders of human REM sleep: a new category of para- somnia. Sleep 1986;9(2):293-308.
2. Galbiati A, Verga L, Giora E, et al. The risk of neurodegeneration in REM sleep behavior disorder: A systematic review and meta-analysis of longitudinal studies. Sleep Med Rev.2019;43:37-46.
3. Luppi PH, Clément O, Sapin E, et al. The neuronal network responsible for paradoxical sleep and its dysfunctions causing narcolepsy and rapid eye movement (REM) behavior disorder. Sleep Med Rev. 2011;15(3):153-63.
4. Braak H, Ghebremedhin E, Rüb U, et al. Stages in the development of Parkinson’s disease-related pathology. Cell Tissue Res 2004;318(1):121-34.
5. Boeve BF, Silber MH, Saper CB, et al. Pathophysiology of REM sleep behaviour disorder and relevance to neurodegenerative disease. Brain 2007;130(Pt 11):2770-88.
6. Kaur S, Thankachan S, Begum S, et al. Hypocretin-2 saporin lesions of the Ventrolateral Peri- aquaductal Gray (vlPAG) increase REM sleep in hypocretin knock- out mice. PLoS One 2009;4(7):e6346
7. Sapin E, Lapray D, Bérod A, et al. Localization of the brainstem GABAergic neurons controlling paradoxical (REM) sleep. PLoS One 2009(5);4:e4272
8. Dayan E, Browner N. Alterations in striato-thalamo-pallidal intrinsic functional connectivity as a prodrome of Parkinson’s disease. NeuroImage: Clinical. 2017;16:313-318.
9. Ellmore TM, Castriotta RJ, Hendley KL, et al. Altered Nigrostriatal and Nigrocortical Functional Connectivity in Rapid Eye Movement Sleep Behavior Disorder. Sleep. 2013;36(12):1885-1892.
10. Marques A, Roquet D, Matar E, et al. Limbic hypoconnectivity in idiopathic REM sleep behaviour disorder with impulse control disorders. J Neurol. 2021;268(9):3371-3380.
11. Binder T, Hobert MA, Pfrommer T, et al. Increased functional connectivity in a population at risk of developing Parkinson’s disease. Parkinsonism & Related Disorders. 2021;92:1-6.
12. Bianciardi M, Toschi N, Edlow BL, et al. Toward an in vivo neuroimaging template of human brainstem nuclei of the ascending arousal, autonomic, and motor systems. Brain connectivity. 2015;5(10):597-607.
13. Bianciardi M, Strong C, Toschi N, et al. A probabilistic template of human mesopontine tegmental nuclei from in vivo 7 T MRI. Neuroimage. 2018;170:222-230.
14. García-Gomar MG, Strong C, Toschi N, et al. In vivo Probabilistic Structural Atlas of the Inferior and Superior Colliculi, Medial and Lateral Geniculate Nuclei and Superior Olivary Complex in Humans Based on 7 Tesla MRI. Frontiers in Neuroscience. 2019;13:764.
15. Singh K, Indovina I, Augustinack JC, et al. Probabilistic template of the lateral parabrachial nucleus, medial parabrachial nucleus, vestibular nuclei complex, and medullary viscero-sensory-motor nuclei complex in living humans from 7 Tesla MRI. Frontiers in neuroscience. 2020;13:1425.
16. Singh K, García-Gomar MG, Bianciardi M. Probabilistic atlas of the mesencephalic reticular formation, isthmic reticular formation, microcellular tegmental nucleus, ventral tegmental area nucleus complex, and caudal–rostral linear raphe nucleus complex in living humans from 7 Tesla magnetic resonance imaging. Brain Connectivity. 2021;11(8):613-623.
17. García‐Gomar MG, Videnovic A, Singh K, et al. Disruption of brainstem structural connectivity in REM sleep behavior disorder using 7 Tesla magnetic resonance imaging. Movement Disorders. 2022;37(4):847-853.
18. Destrieux C, Fischl B, Dale, A. Automatic parcellation of human cortical gyri and sulci using standard anatomical nomenclature. Neuroimage. 2010;53(1):1-15.
19. Chang C, Cunningham JP, Glover GH,. Influence of heart rate on the BOLD signal: The cardiac response function. NeuroImage. 2009;44(3), 857–869.
20. Cox, RW. AFNI: software for analysis and visualization of functional magnetic resonance neuroimages. Comput Biomed Res. 1996;29(3), 162–173.
21. Peever J, Fuller PM. Neuroscience: a distributed neural network controls REM sleep. Curr Biol 2016;26(1):R34-R35.
Figures
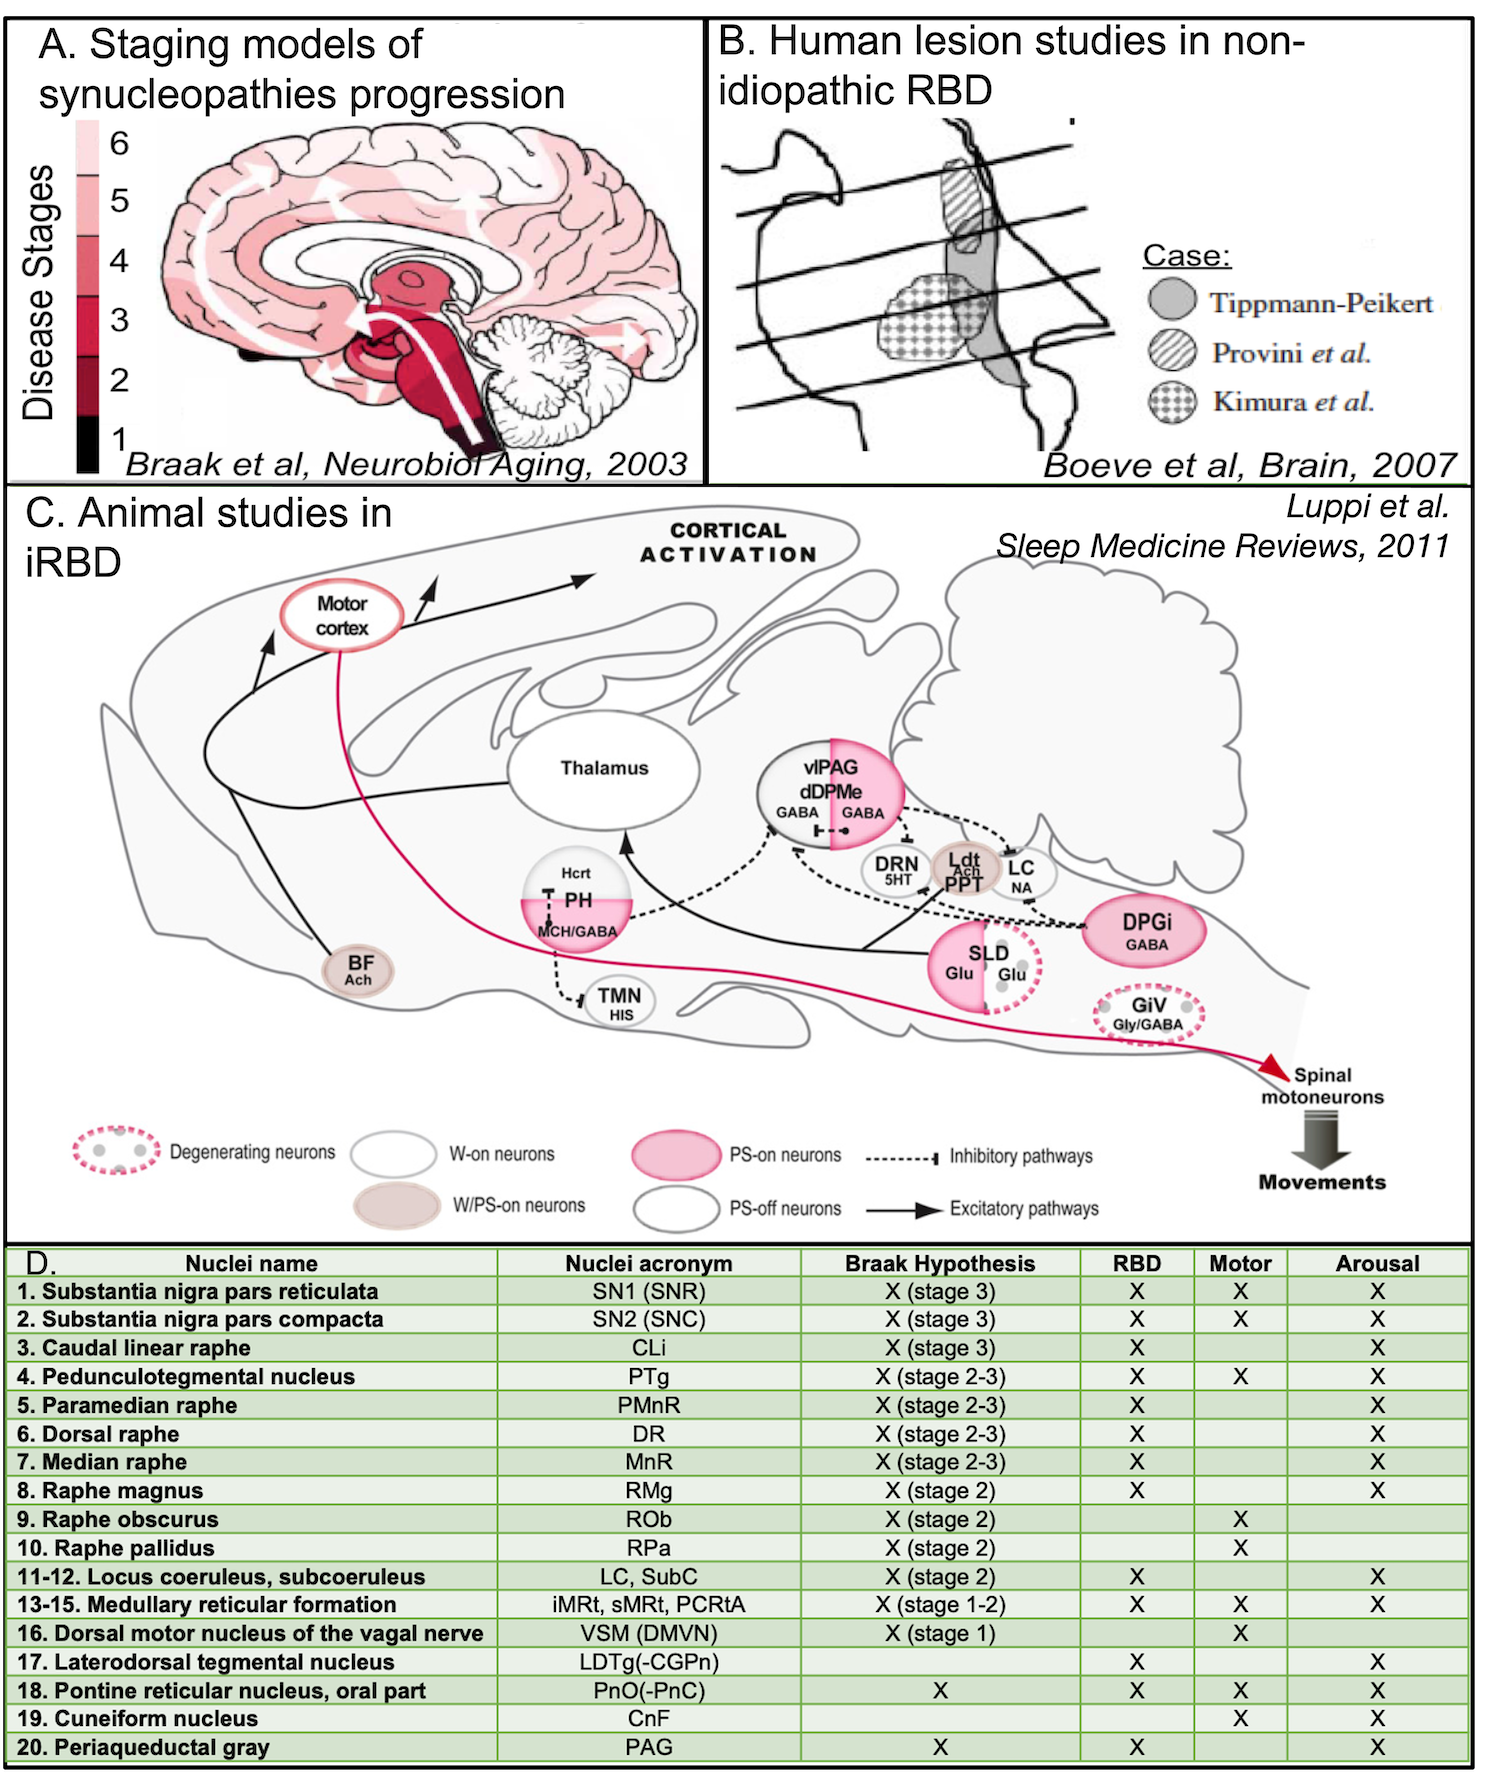
Figure 1. A. Staging models of synucleinopathy progression4 predict that neurodegeneration occurs in the brainstem at earlier stages. B. Studies of secondary RBD5 show lesions in the midbrain and pons, i.e. the upper and mid brainstem. C. Animal studies of isolated RBD3 show a network dysfunction of several brainstem nuclei. D. Lower panel shows table with list of nuclei involved in Braak hypothesis4 of Parkinson’s disease progression, iRBD, and in motor and/or arousal functions.
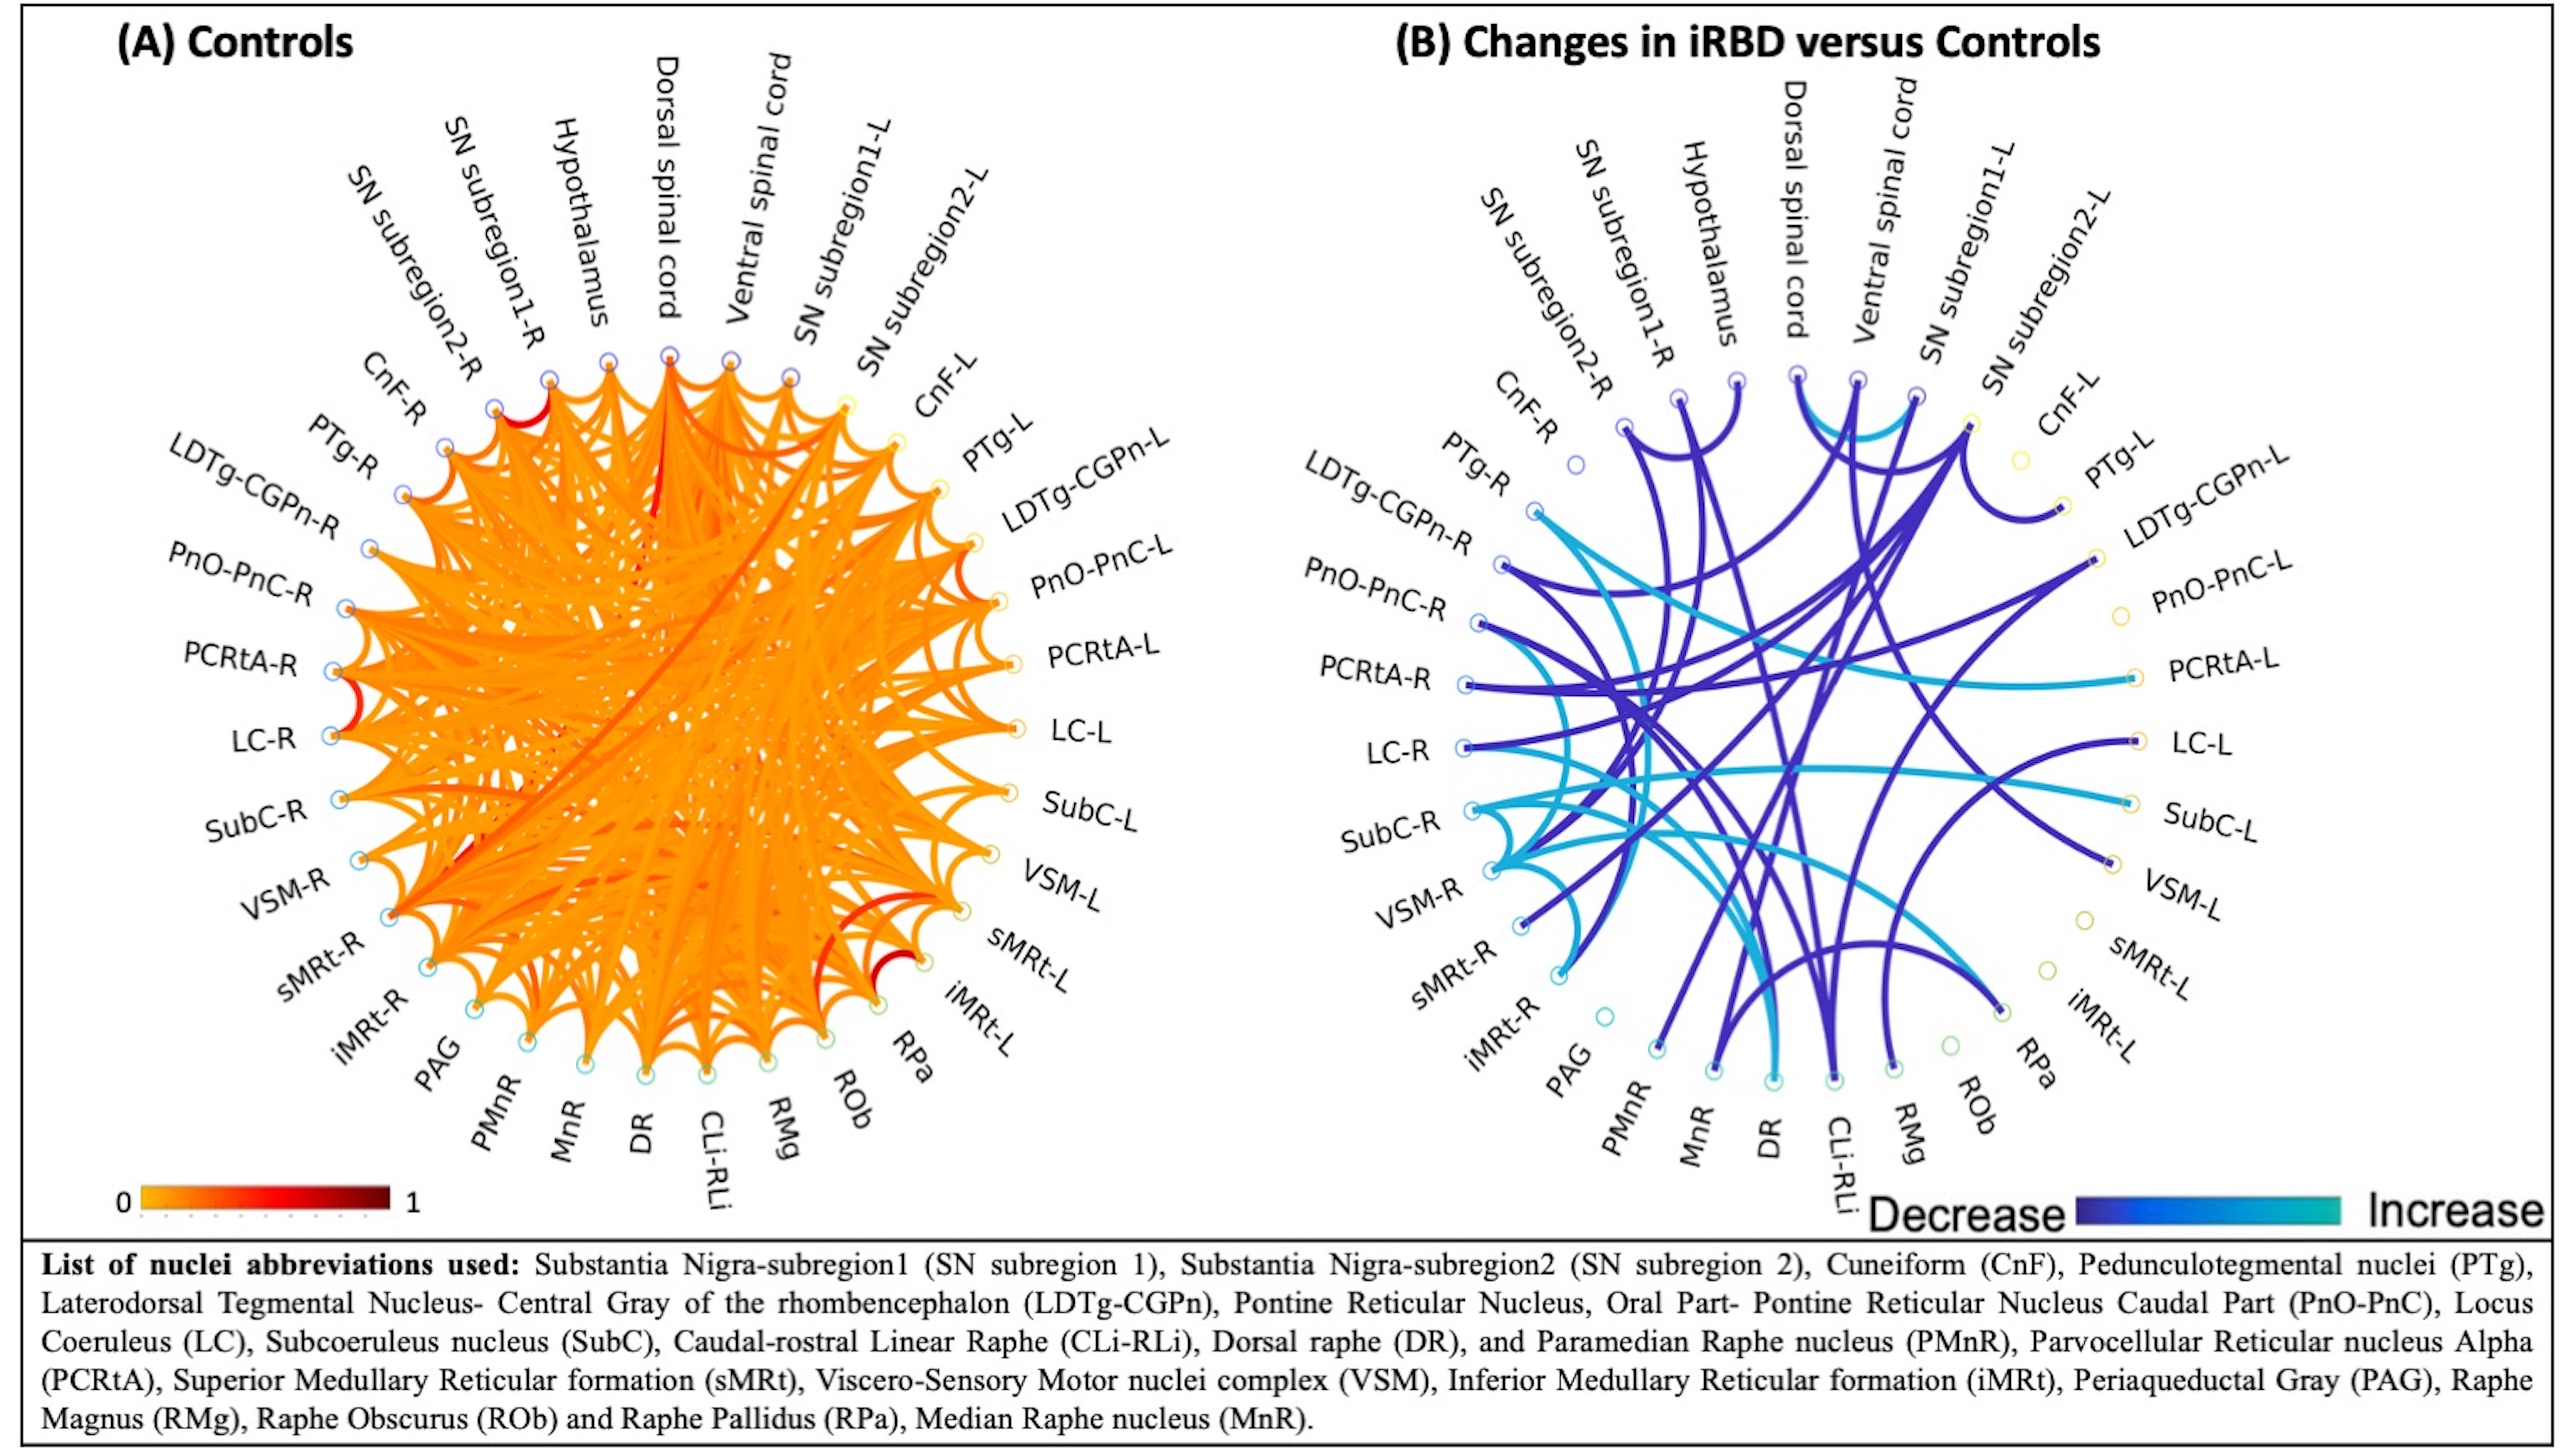
Figure 2: (A) Resting-state fMRI based functional connectome of 20 brainstem nuclei (32 counting left/right/medial nuclei and some subnuclei) relevant for iRBD/prodromal PD, the ventral and dorsal spinal cord and hypothalamus in controls. (B) Statistically significant differences (p < 0.05) in functional connectivity between iRBD patients and controls.
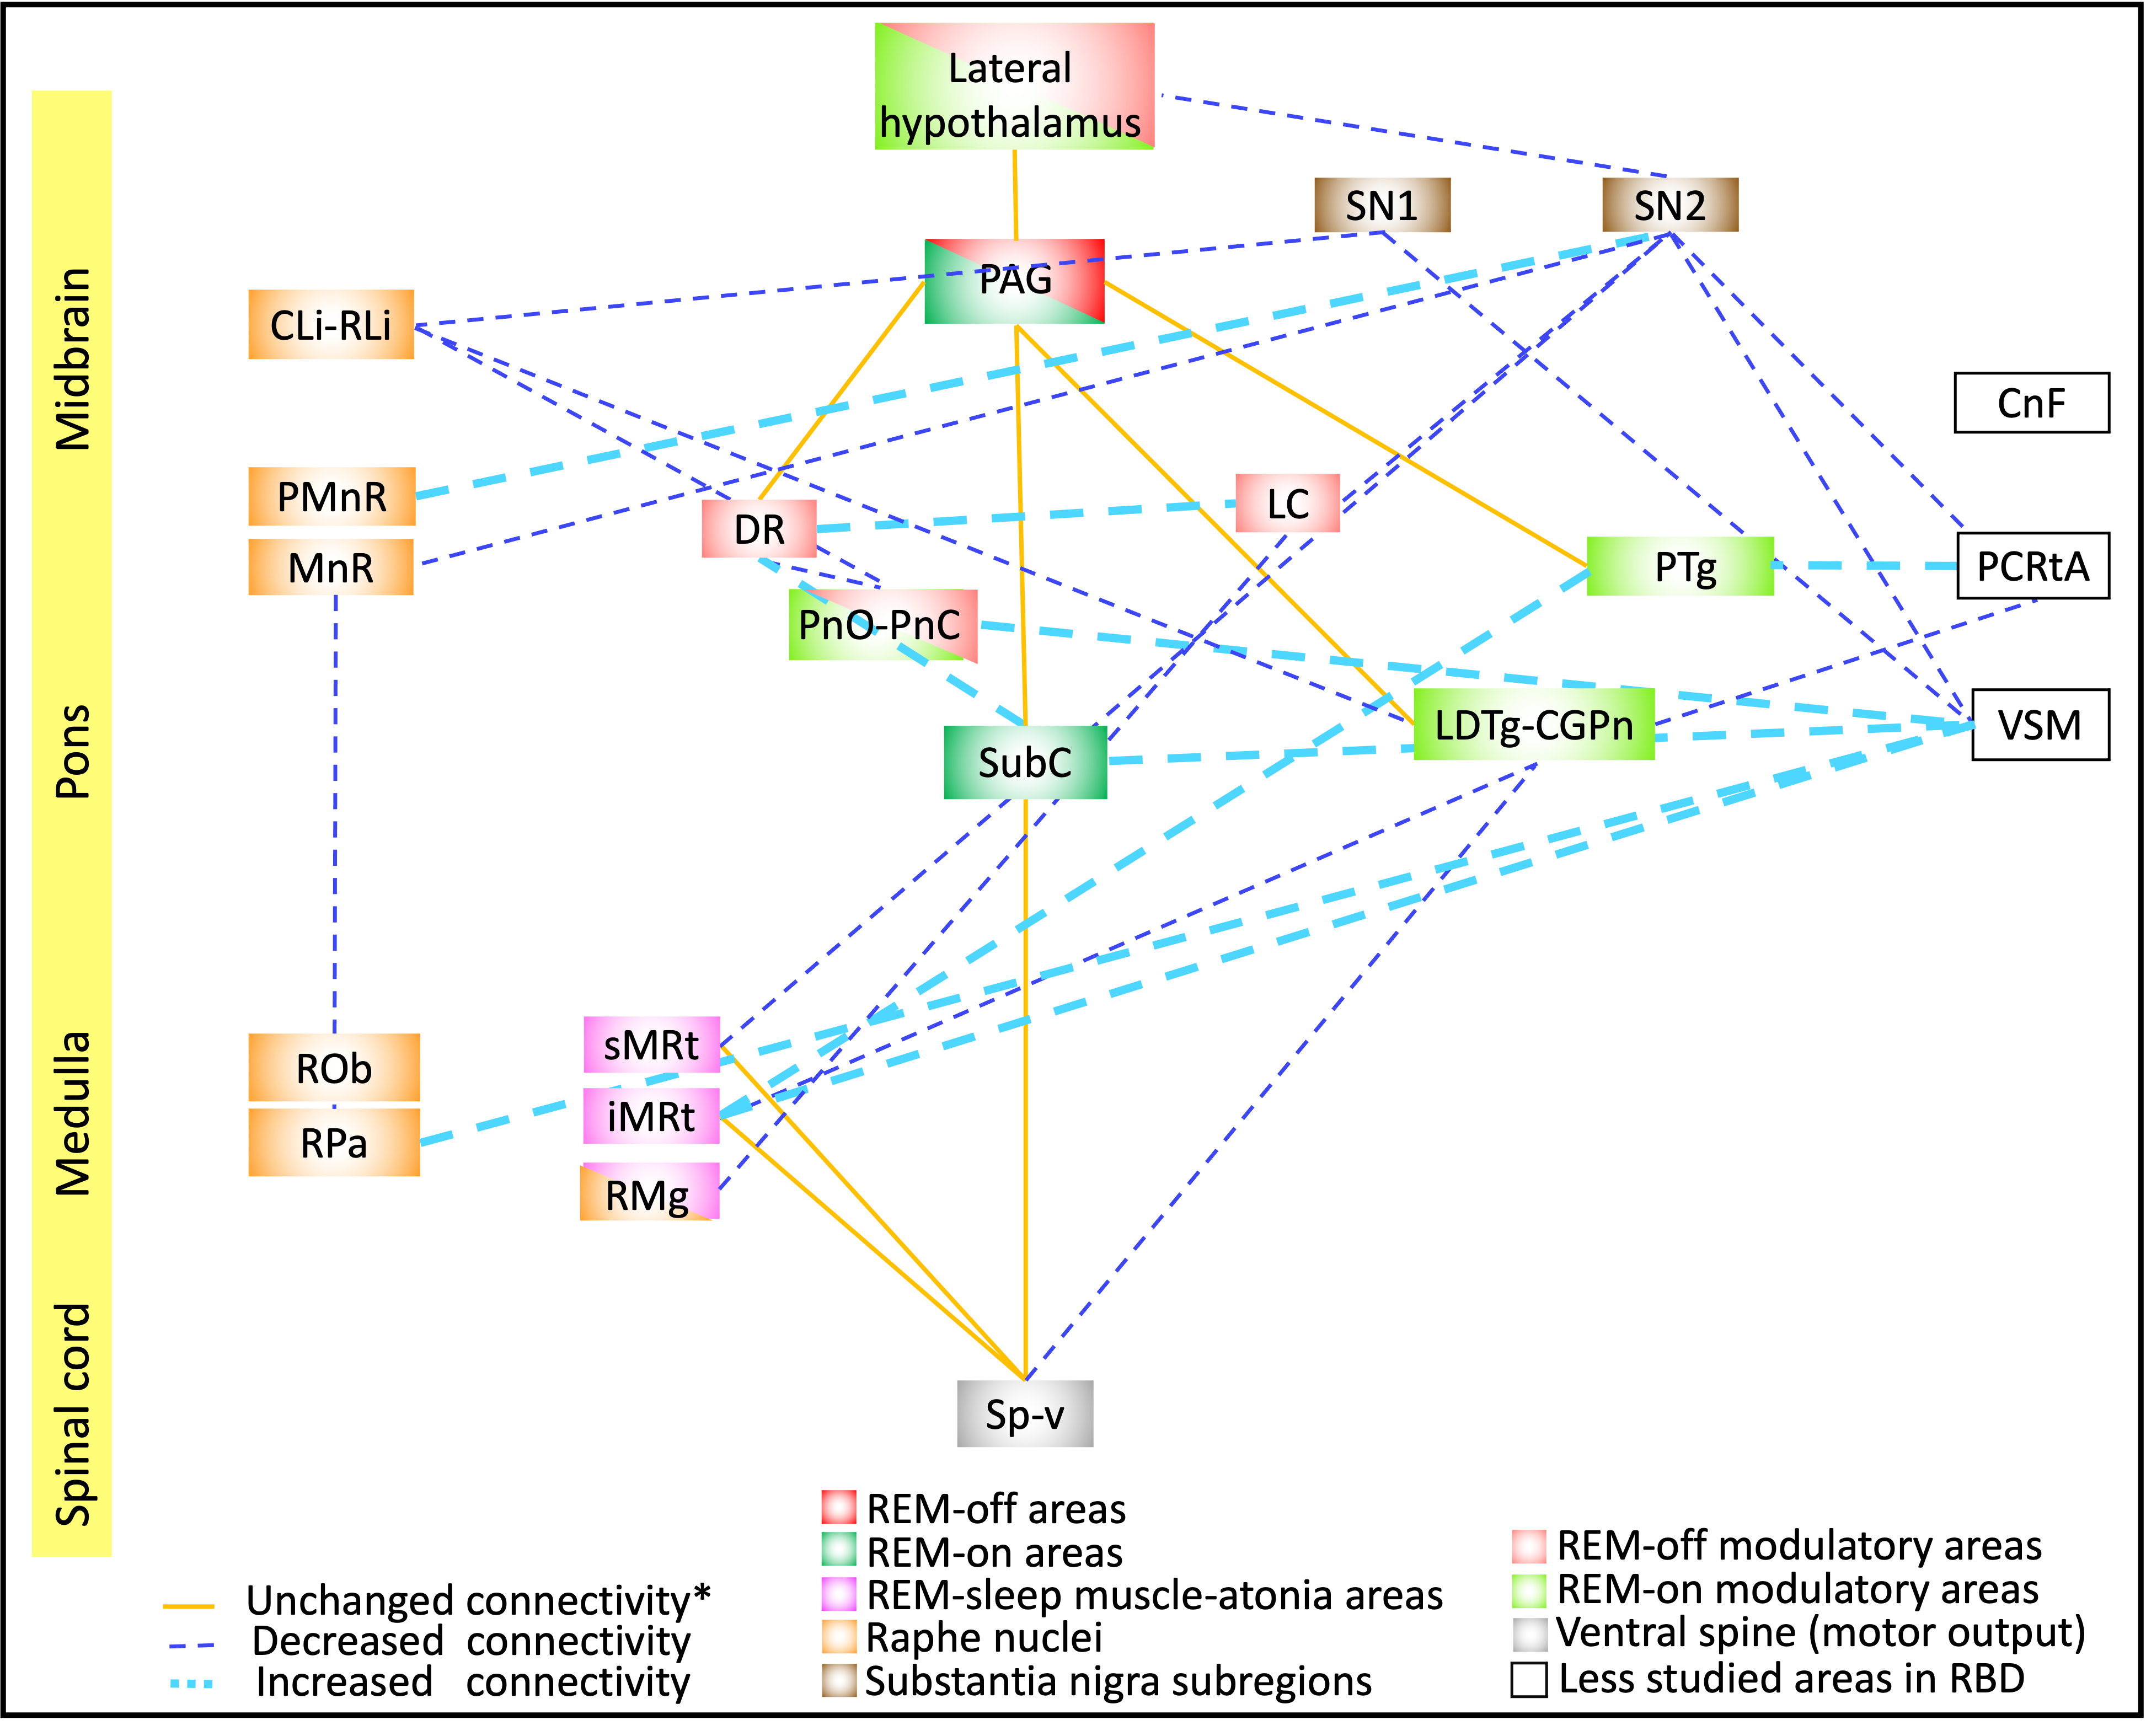
Figure3: Diagram summarizing the functional connectivity changes in iRBD human patients as compared to controls. The RBD relevant nuclei/regions were color-coded based on their functions as previously reported in animal and human lesion studies of RBD3,4.