0230
Neural underpinning of a respiration-related resting-state fMRI network1The Pennsylvania State University, University Park, PA, United States
Synopsis
Keywords: Brain Connectivity, Animals, Respiration, Physiological impacts
Respiration can induce non-neural artifacts in the resting-state fMRI (rsfMRI) signal. In the meantime, as a crucial physiologic process, respiration that can directly drive neural activity change, and may thereby modulate the rsfMRI signal. Nonetheless, this potential neural component in the respiration-fMRI relationship remains elusive. To elucidate this issue, we developed a platform to achieve a concurrent measure of electrophysiology, respiration, and whole brain rsfMRI signals, and identified a respiration-associated network that was underpinned by neural activity, which represents a novel component in the respiration-rsfMRI relationship that is distinct from respiration-related rsfMRI artifacts.Introduction
Respiration drives fluctuations in cerebral blood flow and oxygenation to directly affect the blood-oxygen-level dependent (BOLD) signal, which results in non-neuronal artifacts in resting state fMRI (rsfMRI) data1. Despite massive studies in characterizing respiration-related non-neural artifacts, few studies investigate the potential neural component in the respiration-rsfMRI interaction. Previous studies found that respiration engendered neuronal oscillations across a variety of brain regions such as medial prefrontal cortex and hippocampus2. Additionally, neuronal modulation might involve in arousal and/or emotion-related respiration3,4. Those data indicate that respiration-related BOLD signal changes can be mediated by neural activity. However, this potential neural component in the respiration-fMRI relationship is largely unexplored. To gain a comprehensive understanding of the relationships between respiration, neuronal activity and rsfMRI signal, here we simultaneously acquired those three measures in rodents and observed a respiration-related rsfMRI network that is underpinned by neural activity.Methods
Animals were stereotactically implanted with an MRI-compatible electrode in the anterior cingulate cortex (ACC). Simultaneous rsfMRI, electrophysiology and respiration were recorded (Fig.1). During imaging, the animal was maintained in one of two anesthetized states: light sedation and iso-electric state. For imaging sessions under light sedation, animals were anesthetized with the combination of low-dose dexmedetomidine and low-dose isoflurane, and spontaneous respiration was measured in animals. For imaging sessions under the isoelectric state, sodium pentobarbital was administered with an initial bolus followed by continuous infusion, and animals’ respiration was maintained with a ventilator. For both paradigms, we acquired T2*-weighted gradient-echo rsfMRI images using the echo-planar-imaging (EPI) sequence with the following parameters: repetition time = 1000ms; echo time = 15ms; matrix size = 64×64; field of view = 3.2 × 3.2 cm2; slice thickness = 1mm; flip angle = 60°; 1200 volume each run. All acquired fMRI images were preprocessed with the following steps including coregistration, realignment (SPM12), spatial smoothing, and voxel-wise nuisance regression.During rsfMRI acquisition, the respiration signal was simultaneously recorded at the sampling rate of 225 Hz by a respiration sensor placed under the animal’s chest. Slow respiration variations are quantified by respiration volume per time (RVT), calculated as the difference of consecutive peaks of inspiration and expiration divided by the time interval between the two adjacent signal maxima (or minima)5. Electrophysiology recording started 10 min before the beginning of rsfMRI acquisition and continued throughout the whole imaging session with sampling rate at 24414 Hz. Electrophysiology data were preprocessed to remove MR artifacts using a template regression method to obtain continuous local field potential (LFP, 0.1 - 300 Hz). The LFP was separated into five conventionally defined frequency bands including gamma (40-100 Hz), delta (1-4 Hz), theta (4-7 Hz), alpha (7-13 Hz) and beta band (13-30 Hz). The magnitude squared coherence between the power of each LFP band and RVT was calculated to determine the relationship between slow variations of respiration and the respirational signal. Pearson correlation between the rsfMRI signal and RVT was voxel-wise calculated to determine the relationship between slow variations of respiration and the rsfMRI signal. One-sample t test was performed to determine the statistical significance of correlations, thresholded at p < 0.05 after false discovery rate (FDR) correction of multiple comparisons.
Results
We found that gamma-band neural oscillations are associated with respiration, evidenced by a phase-locking relationship between slow respiration variations and the gamma-band power of the electrophysiologic signal (Fig.2). We also examined the relationship between the gamma-band LFP and rsfMRI signals and observed that the ACC gamma power-derived rsfMRI correlation map is highly consistent with the ACC resting state functional connectivity seedmap (Fig.3). Given that the gamma-band power is respectively associated with the RVT and rsfMRI signals, we further investigated how RVT is related to the rsfMRI signal by calculating voxel-wise correlations between the RVT and rsfMRI signals. We observed a respiration-related rsfMRI network including piriform, anterior cingulate, medial prefrontal, orbital, retrosplenial and primary somatosensory cortices, as well as the hippocampus. In addition, regressing out gamma band power disrupted the respiration-related network, suggesting that the respiration-related rsfMRI network is mediated by gamma-band neural activity (Fig.4). Furthermore, after we experimentally silenced all neural activity across the brain but maintained the respiration, the respiration-related network disappeared, which further confirmed the neural underpinning of the respiration-related network (Fig.5).Discussion and conclusion
Our study established a platform to combine respiration, the multi-channel electrophysiology recording and rsfMRI with the whole-brain coverage in rodents. We identified a respiration-related brain network underpinned by neural activity, which represents a novel component in the respiration-rsfMRI relationship that is distinct from respiration-related rsfMRI artifacts. This platform extended the ability to further investigate the interactions between respiration, neural activity and resting-state brain networks in both healthy and diseased conditions.Acknowledgements
We thank Dr. Yuncong Ma and Ms. Xiaoai Chen for their technical support, and Dr. Xiao Liu for scientific discussion. The present study was partially supported by National Institute of Neurological Disorders and Stroke (R01NS085200), National Institute of Mental Health (RF1MH114224), and National Institute of General Medical Sciences (R01GM141792). The content is solely the responsibility of the authors and does not necessarily represent the official views of the National Institutes of Health.References
1. Murphy, K., Birn, R. M. & Bandettini, P. A. Resting-state fMRI confounds and cleanup. Neuroimage 80, 349-359, doi:10.1016/j.neuroimage.2013.04.001 (2013).
2. Tort, A. B. L., Brankack, J. & Draguhn, A. Respiration-Entrained Brain Rhythms Are Global but Often Overlooked. Trends Neurosci 41, 186-197, doi:10.1016/j.tins.2018.01.007 (2018).
3. Yackle, K. et al. Breathing control center neurons that promote arousal in mice. Science 355, 1411-1415, doi:10.1126/science.aai7984 (2017).
4. Duyn, J. H., Ozbay, P. S., Chang, C. & Picchioni, D. Physiological changes in sleep that affect fMRI inference. Curr Opin Behav Sci 33, 42-50, doi:10.1016/j.cobeha.2019.12.007 (2020).
5. Birn, R. M., Diamond, J. B., Smith, M. A. & Bandettini, P. A. Separating respiratory-variation-related fluctuations from neuronal-activity-related fluctuations in fMRI. Neuroimage 31, 1536-1548, doi:10.1016/j.neuroimage.2006.02.048 (2006).
Figures
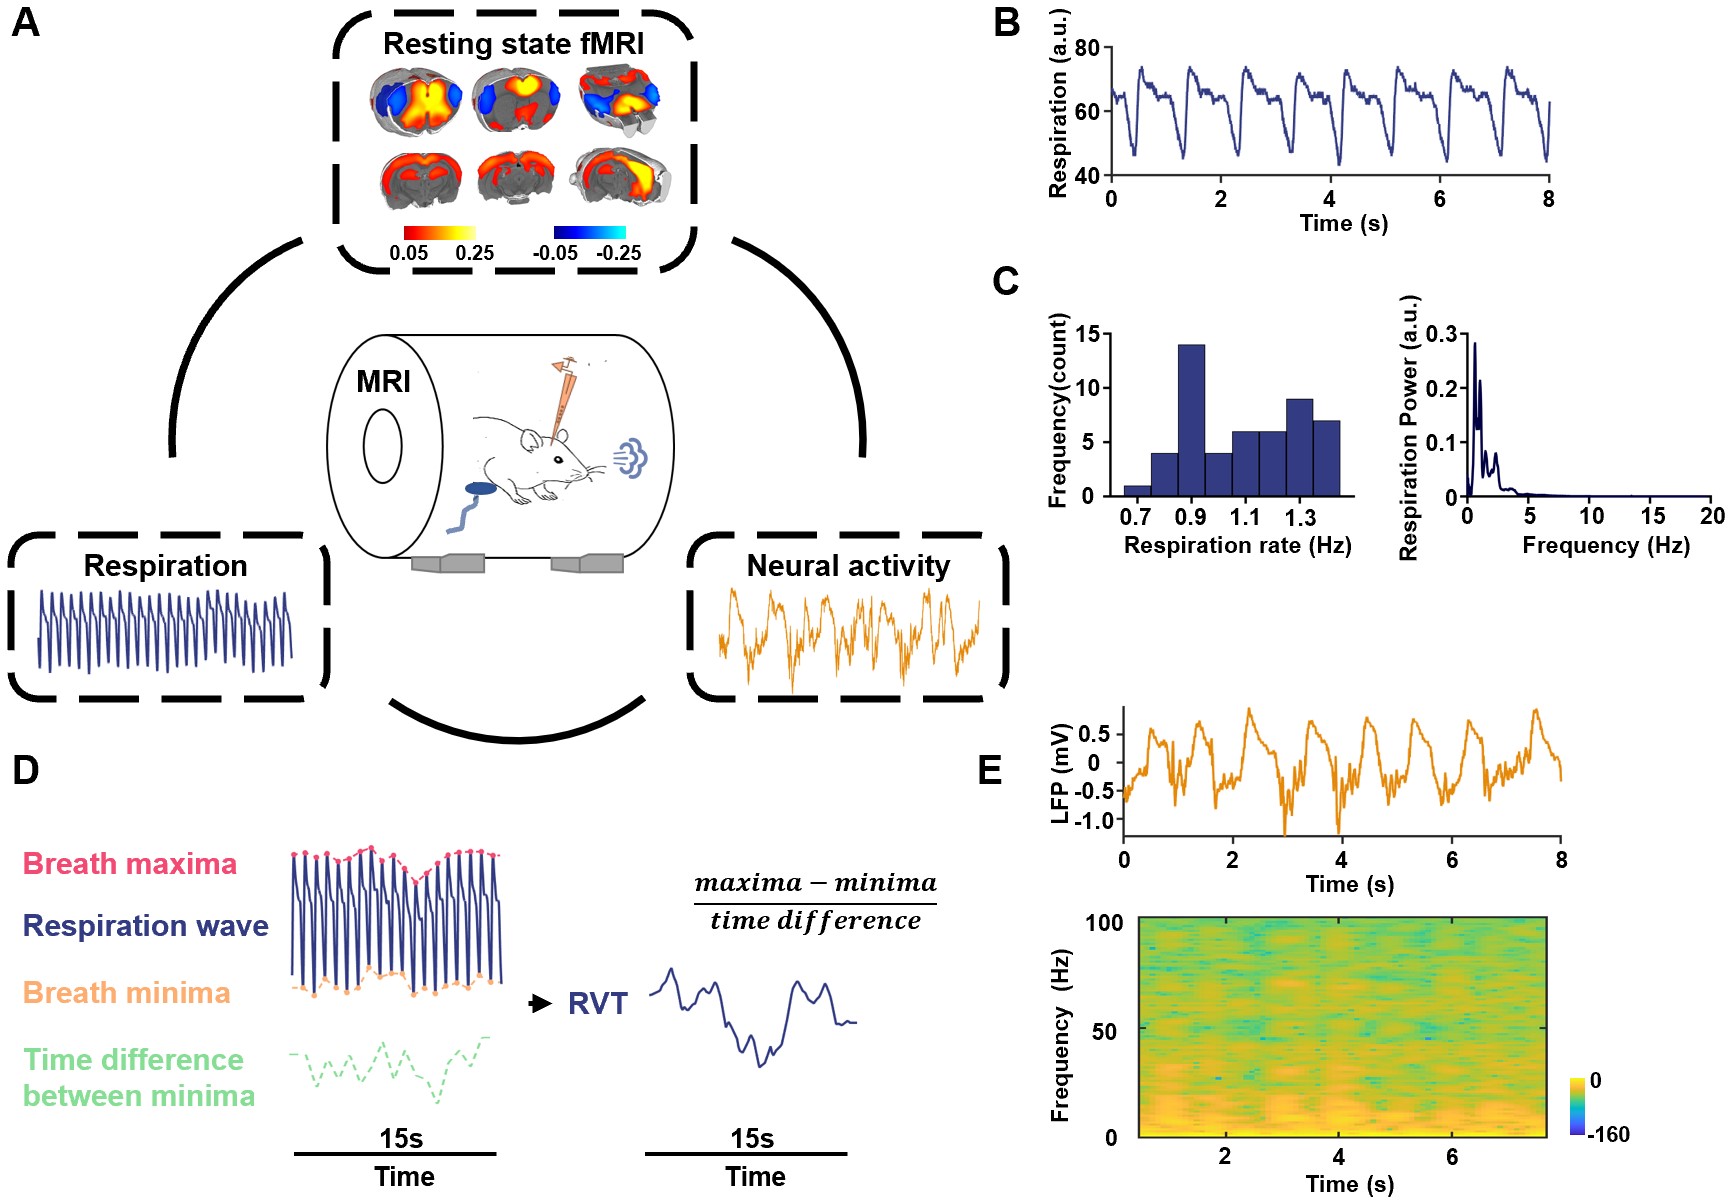
Figure 1. A. Experimental Design – simultaneous measurement of the rsfMRI, electrophysiology and respirational signals. Top: ACC seedmap; bottom left: respiration signal; bottom right: local field potential. B. Exemplar respiration signal waveform. C. Left: distribution of the respiration rate across all scans; right: power of the respiration signal averaged across all scans. D. Computing RVT from the respiration waveform. E. Exemplar denoised LFP signal. Top: LFP time series; bottom: LFP power spectrogram.
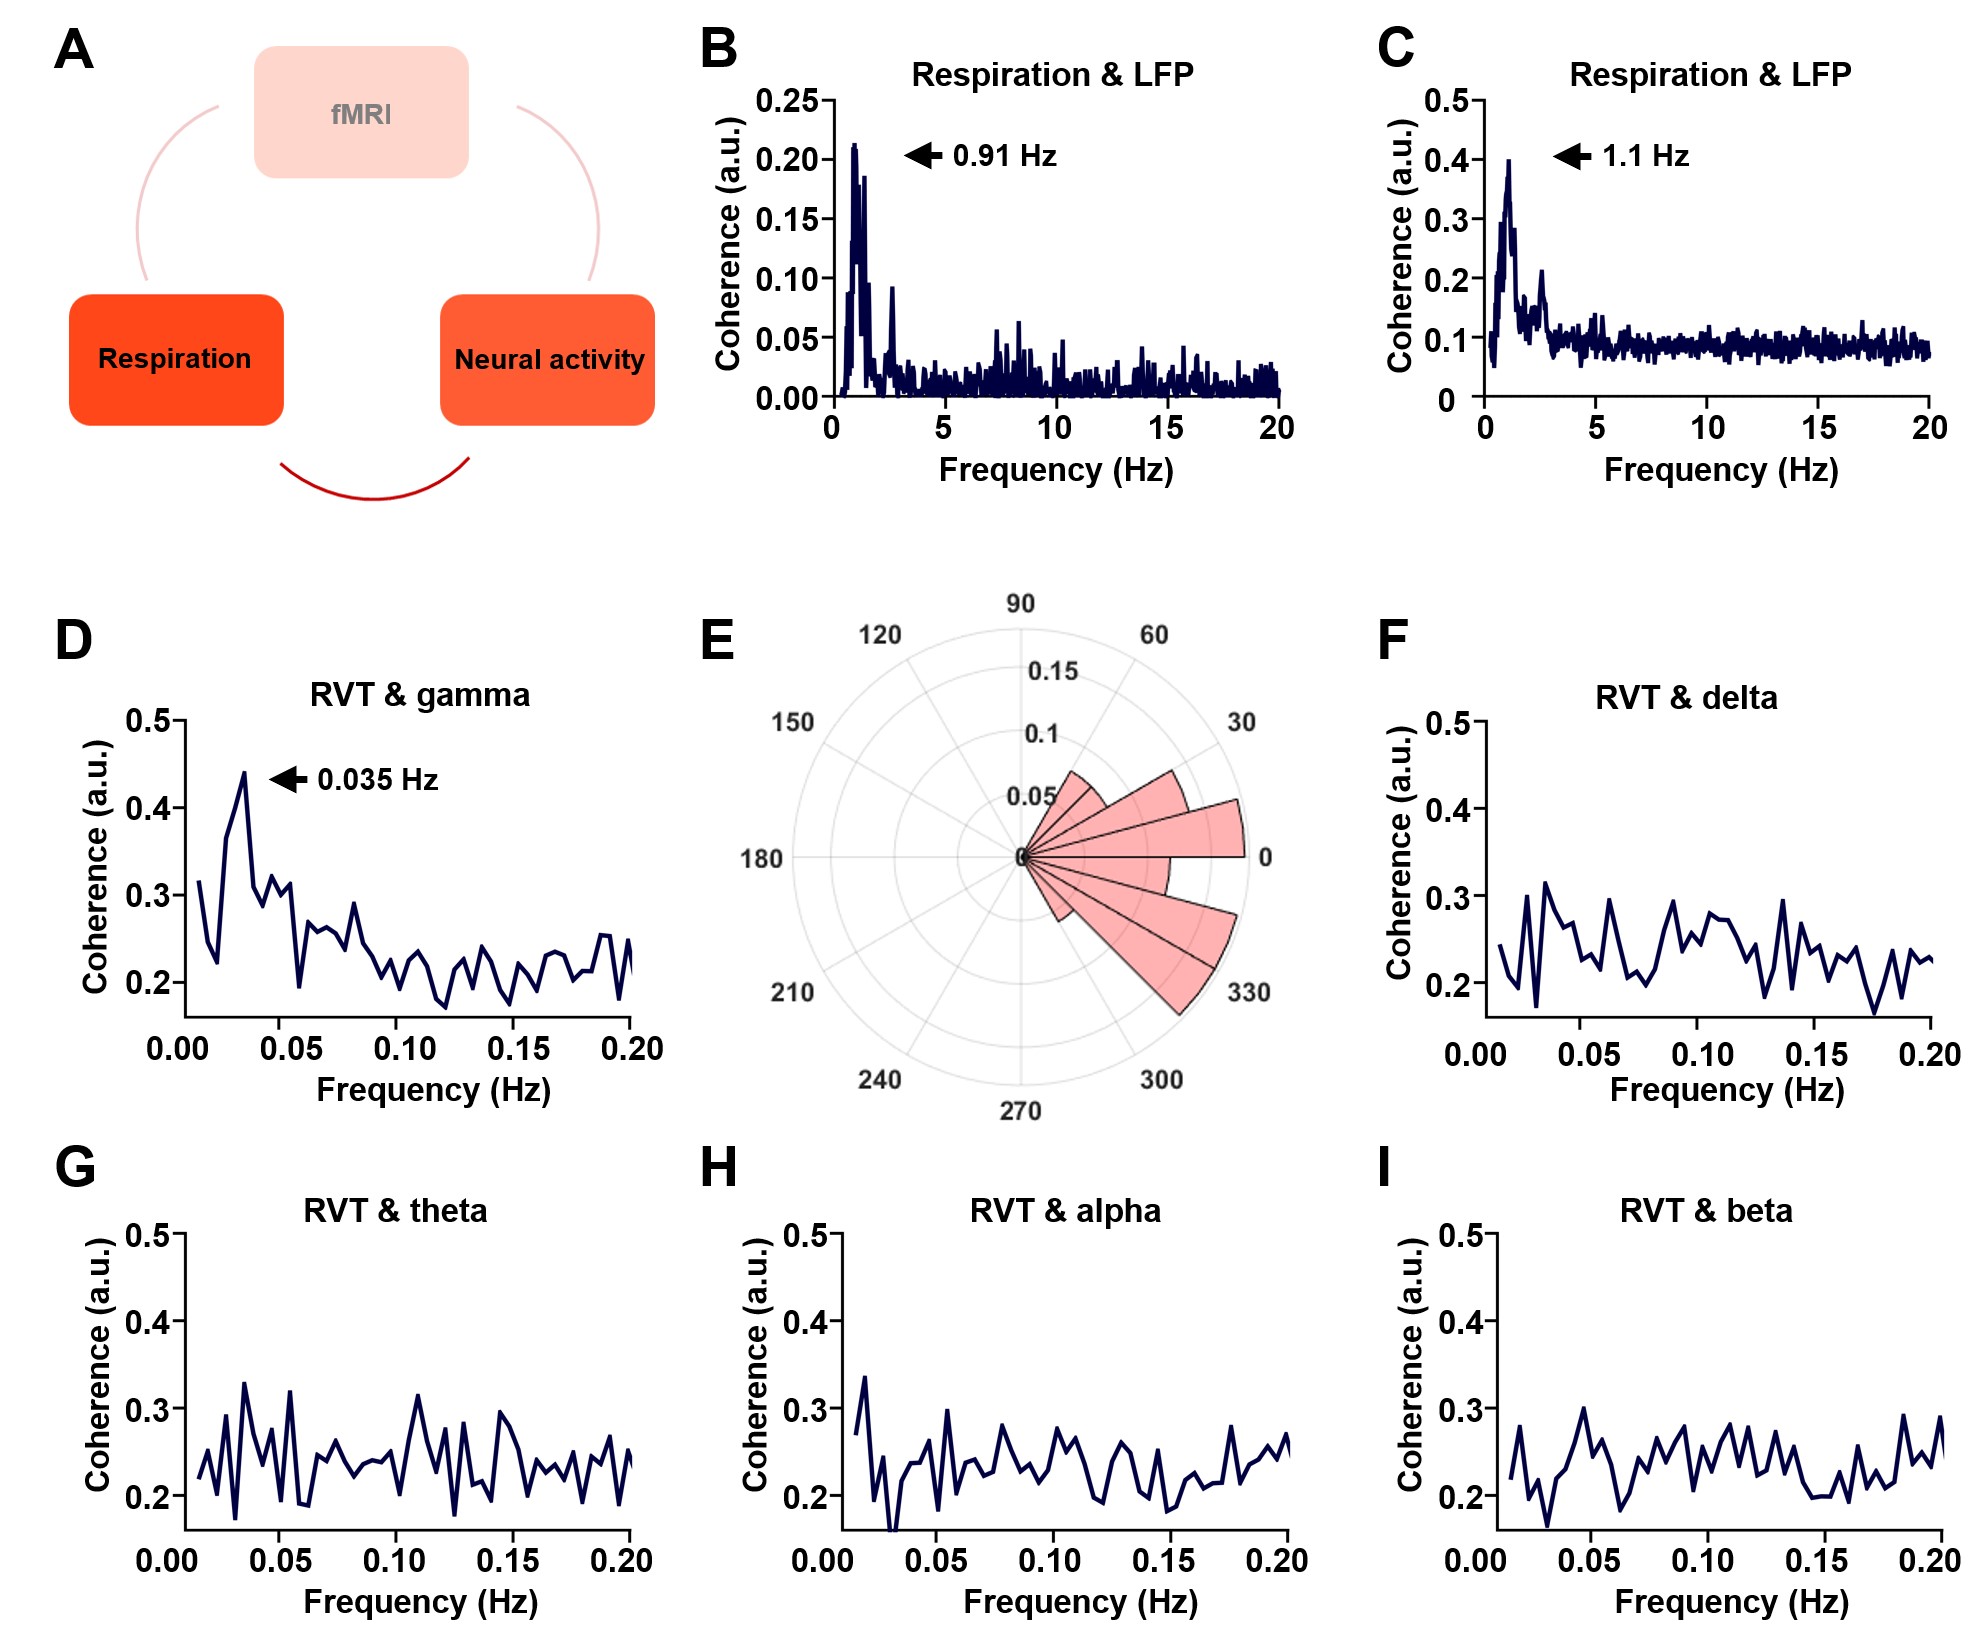
Figure 2. Phase locking relationship between slow respiration variations and neural activity. A. The relationship between respiration and neural activity. B. Respiration-LFP coherence from one sample scan. C. Respiration-LPF coherence averaged across all scans. D. Coherence between RVT and gamma-band power (40-100 Hz), with the peak at 0.035 Hz. E. Phase lag between RVT and gamma-band power. In contrast, no obvious coherence is observed between RVT and delta-band power (1-4 Hz, F), theta band power (4-7 Hz, G), alpha-band power (7-13 Hz, H), or beta-band power (13-30 Hz,I).
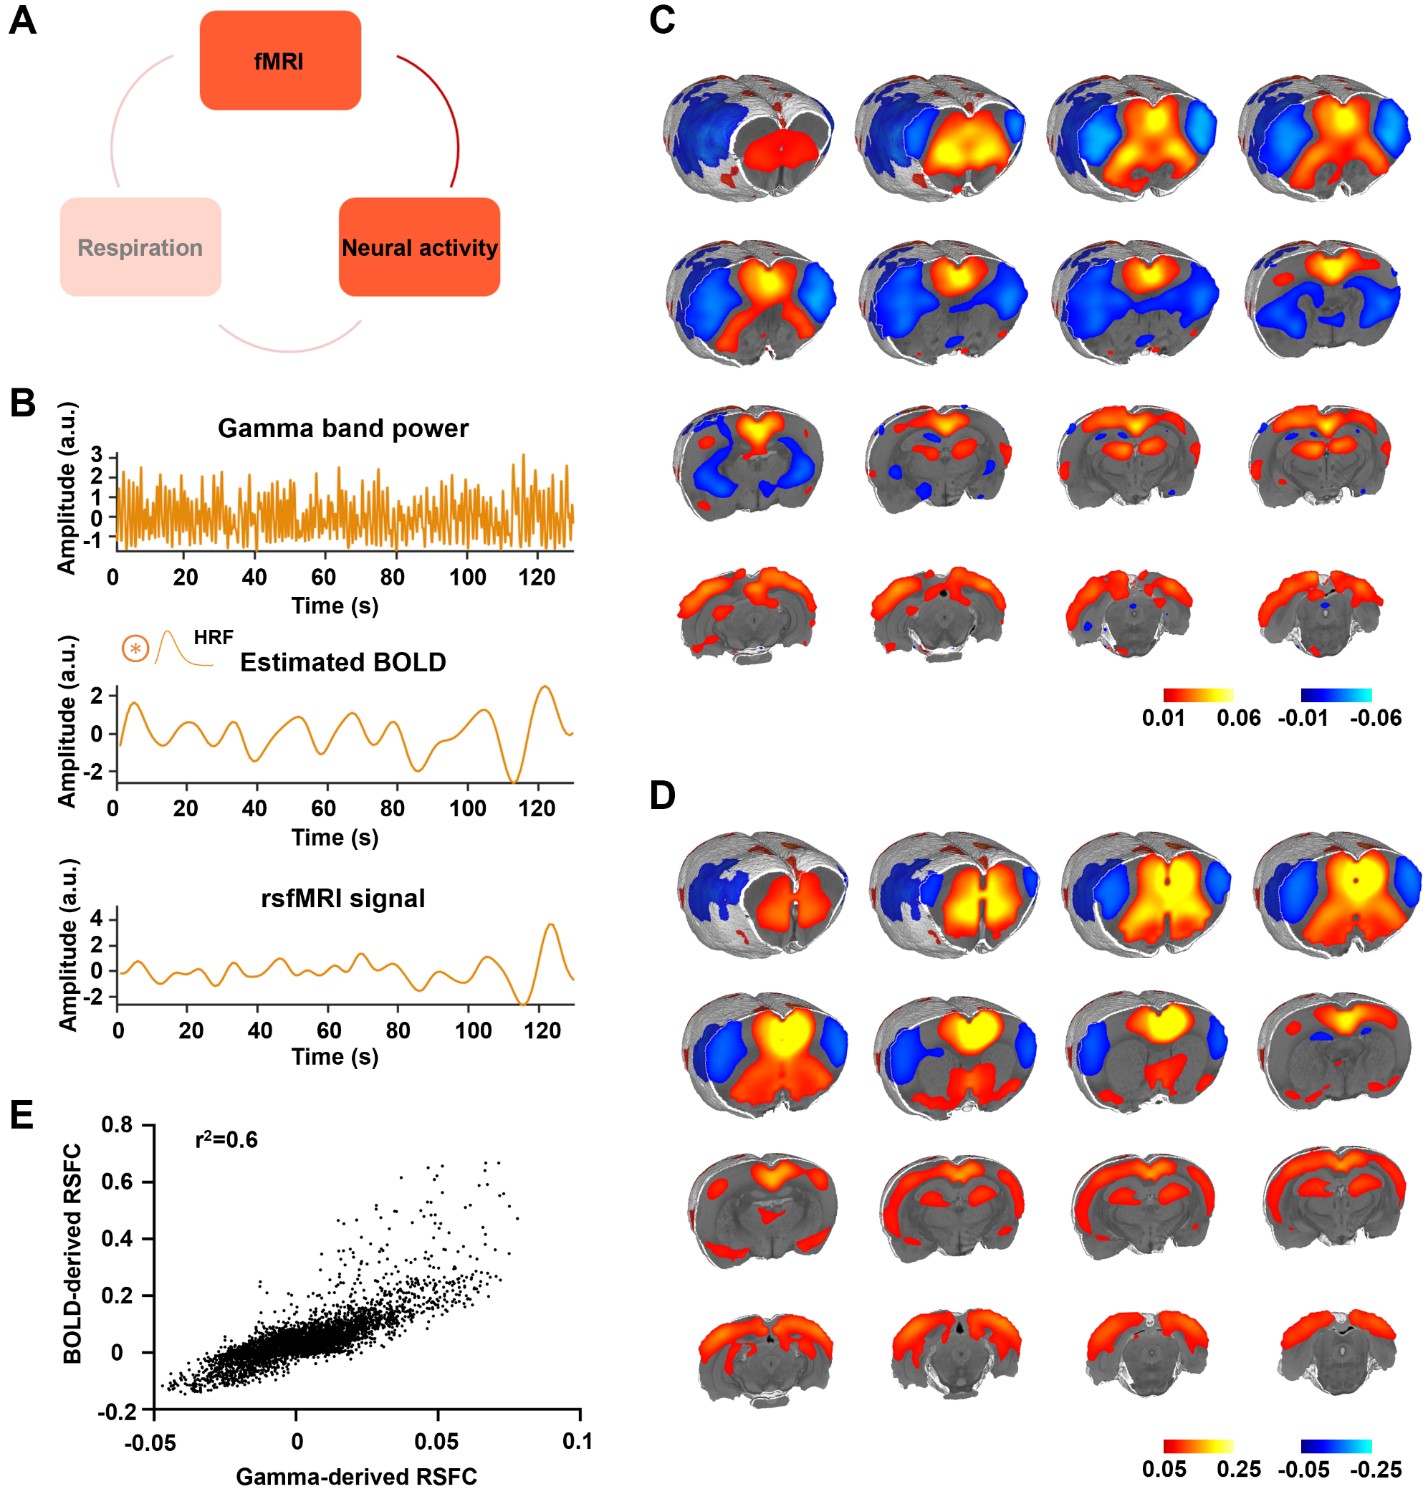
Figure 3. Gamma power is associated with the rsfMRI signal. A. The relationship between neural activity and rsfMRI signal. B. Top: exemplar gamma band power in the ACC; middle: estimated BOLD signal by convolving the gamma-band power with the hemodynamic response function (HRF); bottom: measured BOLD signal from the same brain region. C. Gamma power-derived correlation map. D. Seedmap of the right ACC.E. Voxel-to-voxel spatial correlation between (C) and (D).
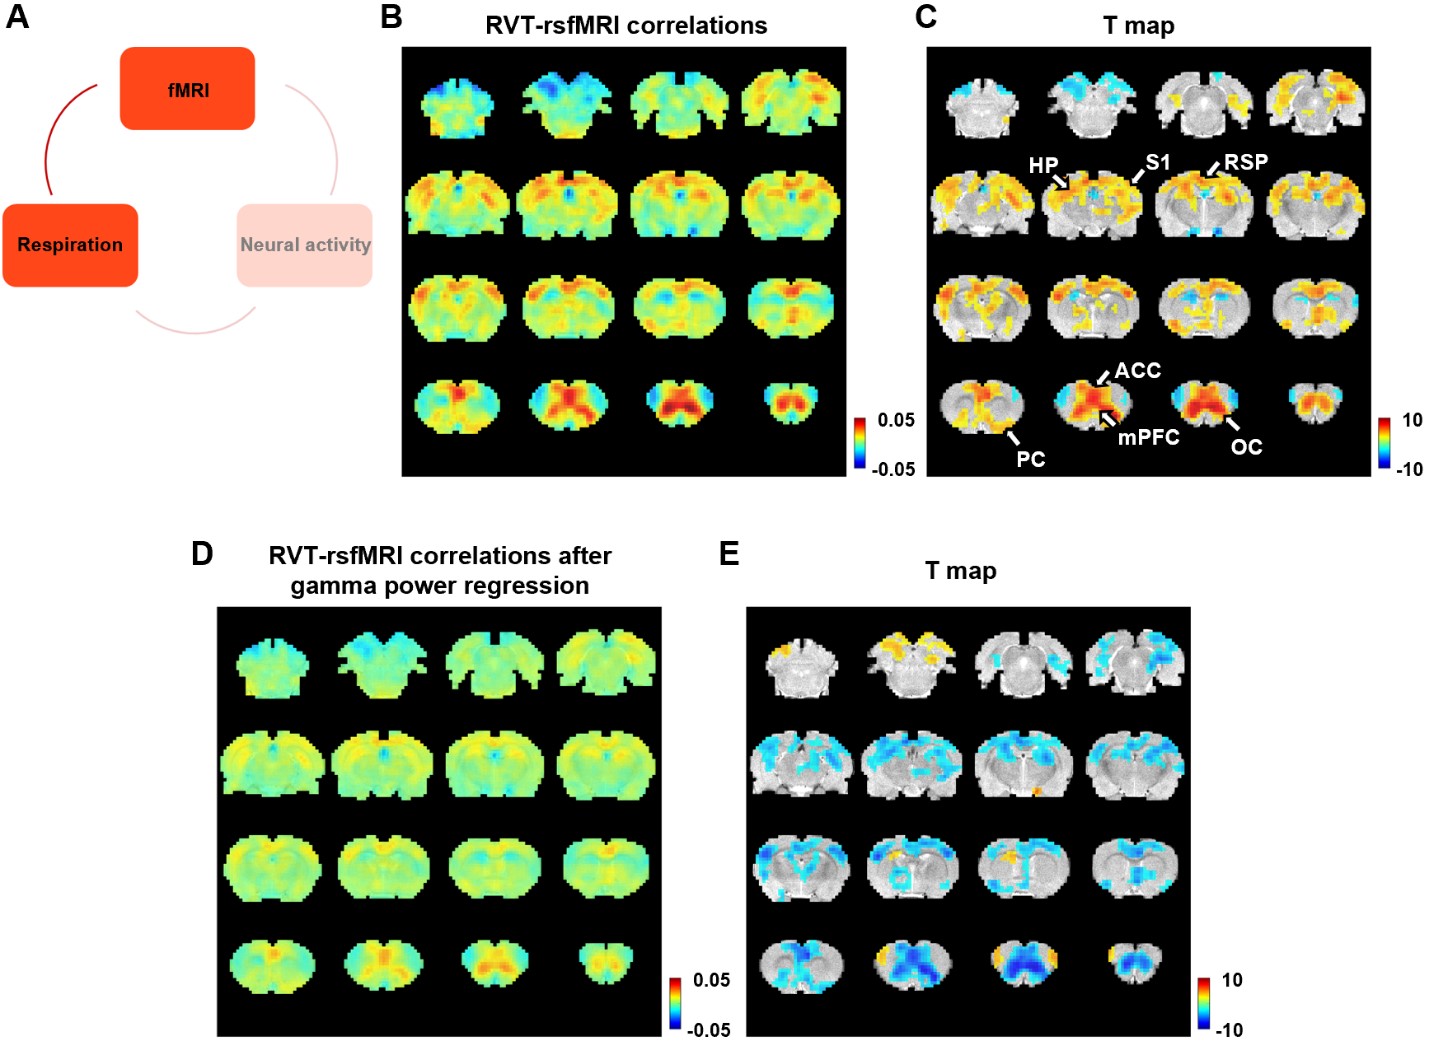
Figure 4. Correlation between slow variations of respiration and rsfMRI signal. A. The relationship between respiration and rsfMRI signals. B-C. Voxel-wise correlations between the RVT and rsfMRI signals. B. Unthresholded correlation map averaged across scans. C. Thresholded T-value map (one-sample t test, p < 0.05, FDR corrected). D. Voxel-wise correlations between the RVT and rsfMRI signals after the gamma-band power is regressed out from both signals. E. Difference of correlation maps before and after gamma power regression (paired t-test, p < 0.05, FDR corrected).
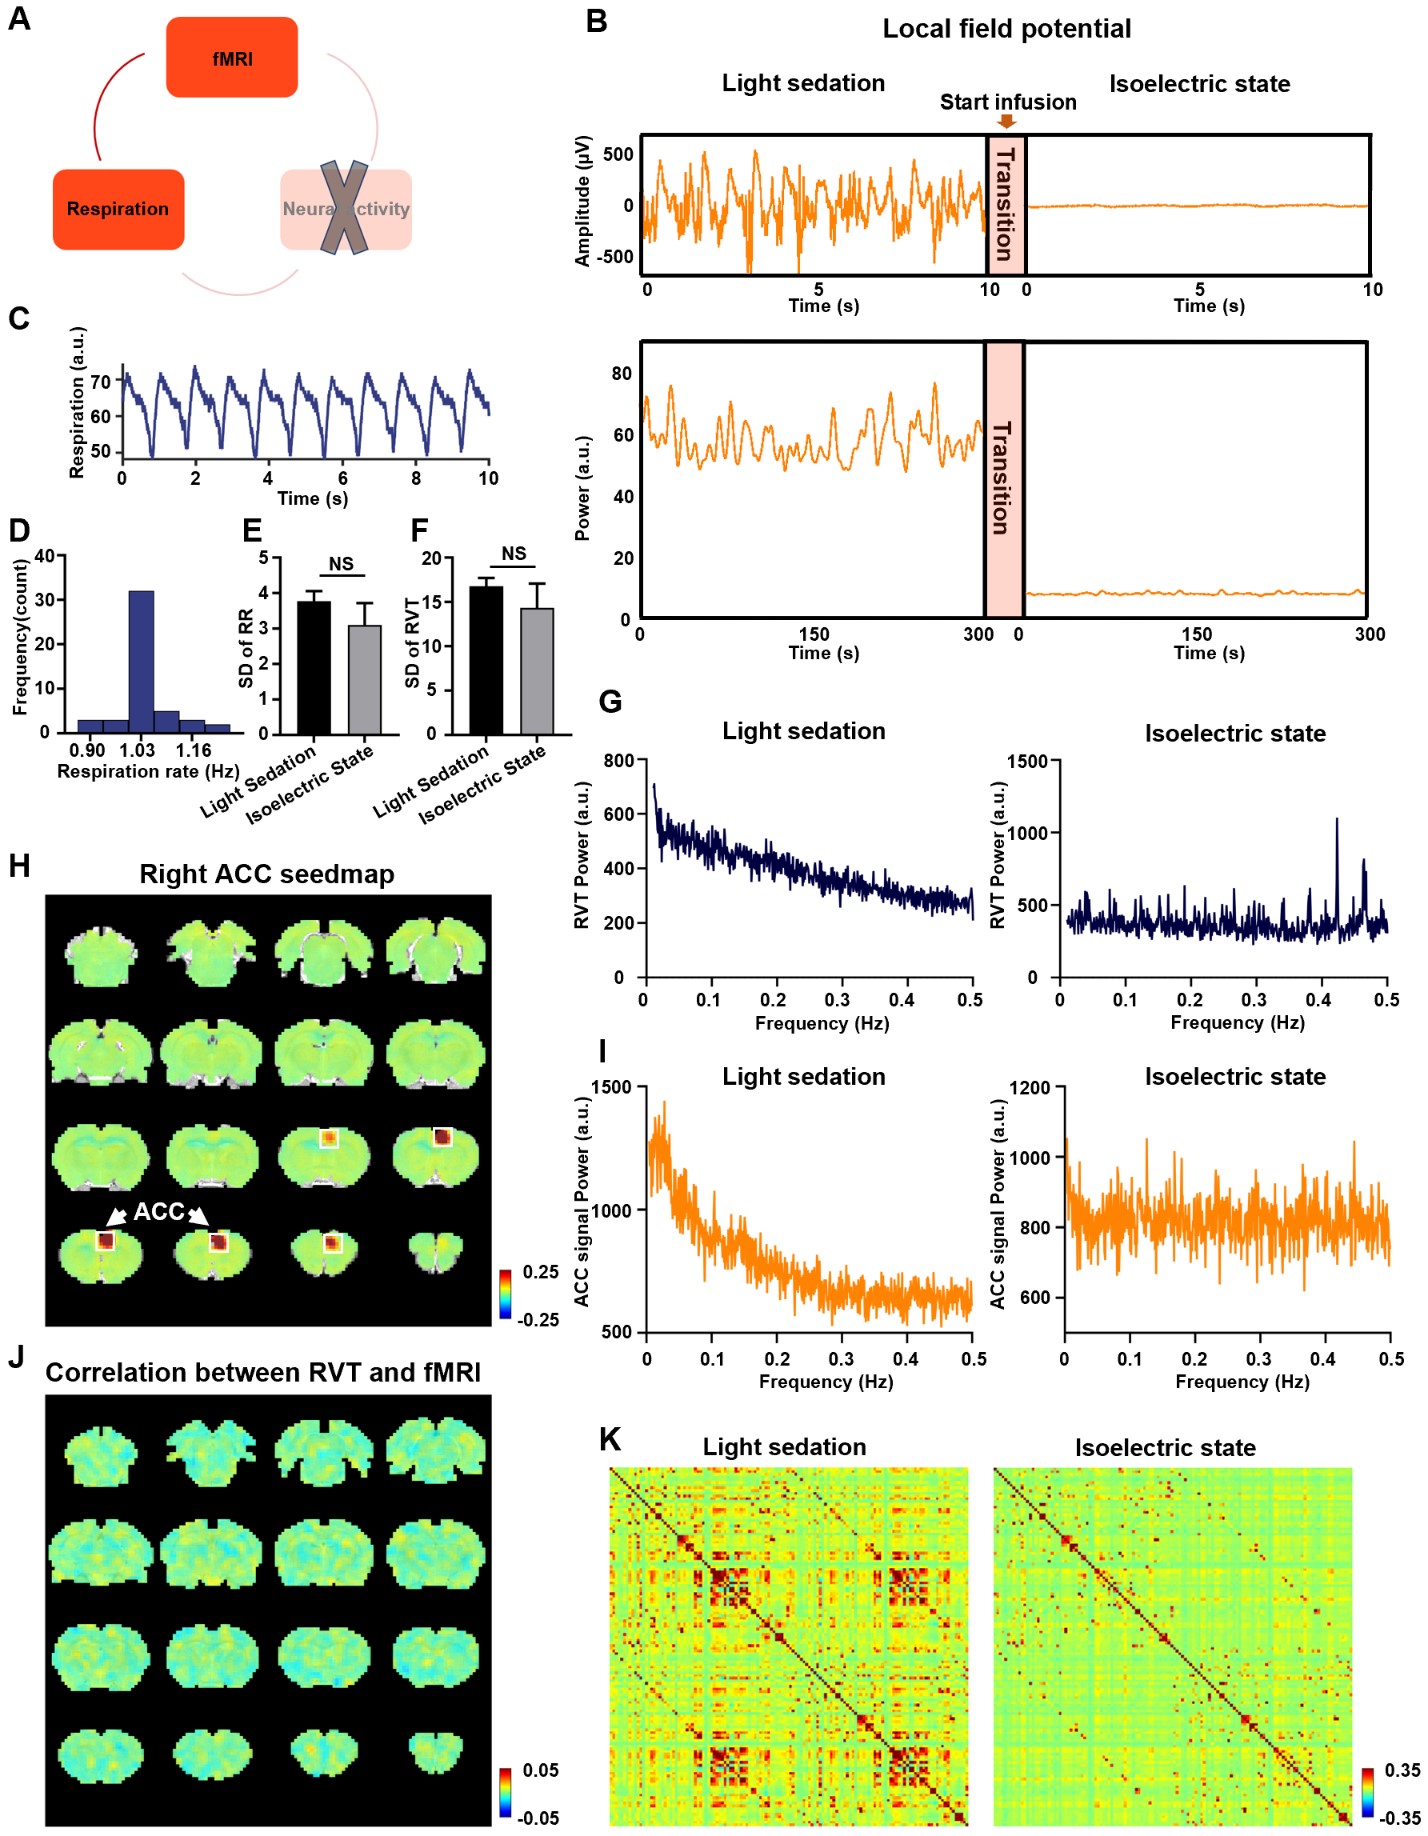
Figure 5. Respiration-rsfMRI relationship at isoelectric state. A. Relationship between slow respiration variations and rsfMRI signal at isoelectric state. B. Silencing neural activity at isoelectric state. C. Respiration signal at isoelectric state. D. Distribution of respiration rate (RR) across scans. E. Standard deviation (SD) of RR. F. SD of RVT. G. Power spectrum of RVT. H. Seedmap of right ACC at isoelectric state. I.Power spectra of BOLD signal. J. Voxelwise correlations between RVT and rsfMRI signal at the isoelectric state. K. Brain-wide ROI-based RSFC matrices.