0229
Biphasic fMRI responses to optogenetic stimulation of parvalbumin interneurons1Department of Biomedical Engineering, Sungkyunkwan University, Suwon 16419, Republic of Korea, Suwon, Korea, Republic of, 2Department of Intelligent Precision Healthcare Convergence, Sungkyunkwan University, Suwon 16419, Korea, Suwon, Korea, Republic of, 3Center for Neuroscience Imaging Research (CNIR), Institute for Basic Science (IBS), Suwon 16419, Republic of Korea, Suwon, Korea, Republic of, 4Center for Neural Engineering, Departments of Engineering Science and Mechanics, Neurosurgery, Biology, and Biomedical Engineering, The Pennsylvania State University, University Park, PA 16802, USA, University Park, PA, United States
Synopsis
Keywords: Brain Connectivity, fMRI (task based)
Parvalbumin (PV) neurons are the largest population of cortical interneurons, thus their role in neurovascular coupling is highly important in interpreting fMRI data, especially optogenetic fMRI. However, PV-based hemodynamic response is not well-understood. Here, we observed the biphasic BOLD response with initial vasoconstriction and follow-up ultraslow vasodilation at the stimulation site by PV photostimulation, while negative BOLD was observed at the downstream output. CBV-fMRI revealed that vasoconstriction localizes at middle to deeper layers matching with the distribution of glutamatergic neurons, while vasodilation propagated from superficial layers driven by neuropeptide substance P signaling.INTRODUCTION
Neurovascular coupling is the basis of hemodynamic-based brain mapping techniques including BOLD fMRI. Commonly, increases and decreases in the hemodynamic response are often assumed to reflect increases and decreases (deactivation) in excitatory neural activity in 1,2 respectively, because excitatory neurons constitute 80% of all neurons in the cortex 3. However, γ-aminobutyric acidergic (GABAergic) inhibitory neurons interact with glutamatergic excitatory neurons 4 and induce hemodynamic and BOLD responses 5. Parvalbumin (PV) interneurons are the largest population of GABAergic interneurons in the neocortex 4, and fast-spiking with the highest energy demand 6. PV neurons do not release vasoactive molecules 7-9. Vascular responses to optogenetic activation of PV neurons are inconsistent 10-12. Here we investigated hemodynamic responses to optogenetic stimulation of PV interneurons in mice with BOLD and CBV-weighted fMRI at ultrahigh fields and pharmacological applications by multi-wavelength intrinsic optical imaging. We observed a pronounced biphasic hemodynamic response, initial vasoconstriction due to suppression of excitatory activities, and follow-up vasodilation driven by substance P signaling. The ultraslow and prolonged vasodilation disappeared at an awake condition.METHODS
Animals: PV-ChR2 mice with thinned-skull on the entire brain (n=26). Mice were anesthetized with an initial mixture of ketamine (Ket:100mg/kg) and xylazine (Xyl:10mg/kg), and a supplementary dose (25mg/kg Ket and 1.25mg/kg Xyl) 13Stimulation: 20-s ChR2-stimulation was performed with 20Hz, power of 3, 5.6, and 10mW, and 20% of the duty cycle. As a control, forepaw electric stimulation was performed with 4Hz, 0.5 mA, and 0.5 ms.
Functional MRI: CBV-weighted fMRI (125×125×500μm3, TR/TE=1000/7ms, FA=30o) with an injection of 15 mg Fe/kg MION was performed on a 9.4T Bruker MR scanner, while BOLD-fMRI (147×147×500μm3, TR/TE=1000/11ms, FA=30o) on a 15.2T scanner.
Hemodynamic optical intrinsic signal imaging: OISI was performed at 530 nm (CBV-like) and 625 nm (BOLD-like). Total hemoglobin concentration change was calculated 14.
RESULTS
We first performed BOLD-fMRI in response to optogenetic stimulation of PV neurons in the left somatosensory area. Different from positive BOLD responses of forepaw stimulation at the stimulation site and projected areas (red-yellow voxels, Figure 1B), optogenetic stimulation of PV neurons induced the positive BOLD response at left S1 (red-yellow voxel) and negative responses at downstream areas (blue voxels). Unlike forepaw stimulation (Figure 1C), biphasic BOLD time course at the stimulation site was observed in PV-based BOLD-fMRI with initial negative and later positive responses, and only negative BOLD responses were observed at downstream areas (Figure 1D and 1E).To gain insights into biphasic BOLD sources responding to photostimulation, we used layer-specific CBV-weighted fMRI after the intravenous injection of iron oxide nanoparticles (Figure 2A). The initial vasoconstriction was localized at middle to deep cortical layers (pink color in 5-10s map, Figure 2B; Figure 2C cortical profile), while the post-stimulus vasodilation had a gradient from superficial to deep layers (10-25s time slots).
Next, we searched the biological source of post-stimulus vasodilation by pharmacological applications and multi-wavelength intrinsic optical imaging (Figure 3A). We found that activation of PV neurons in deep layers (IV-V) potentially releases substance P (SP), which activates its selective NK1 receptor on nNOS neurons 15, 16. Saturation of intracortical SP concentration by SP infusion or blocking NK1 receptor by CP 99994 abolished the post-stimulus vasodilation significantly (Figure 3C and 3D). When experiments were performed on awake status (Figure 4A), the ultraslow vasodilation disappeared (brightening area, Figure 4B; Figure 4B-E).
DISCUSSION
In summary, we investigated the vascular response of PV stimulation by optogenetic stimulation. We found that (1) optogenetically targeting PV neurons caused a negative fMRI response with vasoconstriction from the middle to deep cortical layer due to the PV-driven inhibition, which depends on the brain state, and (2) the ultraslow, positive BOLD fMRI with vasodilation is a consequence of the effects of substance P, which is known to activating NK1 receptor-positive nNOS neurons in deep layers under anesthesia 15. The ultraslow vasodilation in anesthesia implicates an ultraslow HRF (Figure 5), different from regular HRF commonly used for fMRI studies. PV-driven ultraslow vasodilation via SP signaling may be important for sleep or anesthetized brain status. This may be critically important for neurological diseases such as Alzheimer’s disease where substance P-induced vasodilation during sleep may be diminished, consequently the reduction of waste removal.Acknowledgements
This research was supported by the Institute of Basic Science (IBS-R015-D1 to SGK), and the National Institutes of Health (R01NS078168 to PJD). We would like to thank Ms. Junglim Lee for mouse breeding, and Mr. Chanhee Lee for maintaining the MR instruments.References
1. Logothetis, N.K. What we can do and what we cannot do with fMRI. Nature 453, 869-878 (2008).
2. Logothetis, N.K., Pauls, J., Augath, M., Trinath, T. & Oeltermann, A. Neurophysiological investigation of the basis of the fMRI signal. Nature 412, 150-157 (2001).
3. Meyer, H.S. et al. Inhibitory interneurons in a cortical column form hot zones of inhibition in layers 2 and 5A. P Natl Acad Sci USA 108, 16807-16812 (2011).
4. Tremblay, R., Lee, S. & Rudy, B. GABAergic Interneurons in the Neocortex: From Cellular Properties to Circuits. Neuron 91, 260-292 (2016).
5. Moon, H.S. et al. Contribution of Excitatory and Inhibitory Neuronal Activity to BOLD fMRI. Cereb Cortex 31, 4053-4067 (2021).
6. Kann, O. The interneuron energy hypothesis: Implications for brain disease. Neurobiol Dis 90, 75-85 (2016).
7. Cauli, B. et al. Cortical GABA Interneurons in Neurovascular Coupling: Relays for Subcortical Vasoactive Pathways. The Journal of Neuroscience 24, 8940-8949 (2004).
8. Karagiannis, A. et al. Classification of NPY-expressing neocortical interneurons. J Neurosci 29, 3642-3659 (2009).
9. Perrenoud, Q. et al. Characterization of type I and type II nNOS-expressing interneurons in the barrel cortex of mouse. Front Neural Circuit 6 (2012).
10. Lee, J. et al. Opposed hemodynamic responses following increased excitation and parvalbumin-based inhibition. J Cereb Blood Flow Metab 41, 841-856 (2021).
11. Krawchuk, M.B., Ruff, C.F., Yang, X., Ross, S.E. & Vazquez, A.L. Optogenetic assessment of VIP, PV, SOM and NOS inhibitory neuron activity and cerebral blood flow regulation in mouse somato-sensory cortex. J Cereb Blood Flow Metab 40, 1427-1440 (2020).
12. Dahlqvist, M.K., Thomsen, K.J., Postnov, D.D. & Lauritzen, M.J. Modification of oxygen consumption and blood flow in mouse somatosensory cortex by cell-type-specific neuronal activity. J Cereb Blood Flow Metab 40, 2010-2025 (2020).
13. Shim, H.J. et al. Mouse fMRI under ketamine and xylazine anesthesia: Robust contralateral somatosensory cortex activation in response to forepaw stimulation. Neuroimage 177, 30-44 (2018).
14. Dunn, A.K., Devor, A., Dale, A.M. & Boas, D.A. Spatial extent of oxygen metabolism and hemodynamic changes during functional activation of the rat somatosensory cortex. Neuroimage 27, 279-290 (2005).
15. Dittrich, L. et al. Cortical nNOS neurons co-express the NK1 receptor and are depolarized by Substance P in multiple mammalian species. Front Neural Circuit 6 (2012).
16. Endo, T., Yanagawa, Y. & Komatsu, Y. Substance P Activates Ca2+-Permeable Nonselective Cation Channels through a Phosphatidylcholine-Specific Phospholipase C Signaling Pathway in nNOS-Expressing GABAergic Neurons in Visual Cortex. Cerebral Cortex 26, 669-682 (2016).
Figures

Figure 1. High-field BOLD fMRI responses to 20 Hz photostimulation of PV neurons and forepaw somatosensory stimulation
(A) A schematic of optogenetic fMRI experimental design for the thinned-skull mouse
(B) 15.2T BOLD fMRI responses evoked by forepaw and photostimulation (C) Time courses of BOLD responses extracted from ROIs. Dashed box: 20-s stimulation period
(D) Mean BOLD changes during the stimulation period responding to forepaw stimulation and photostimulation for each ROI
(E) Mean BOLD changes for the post-stimulation period
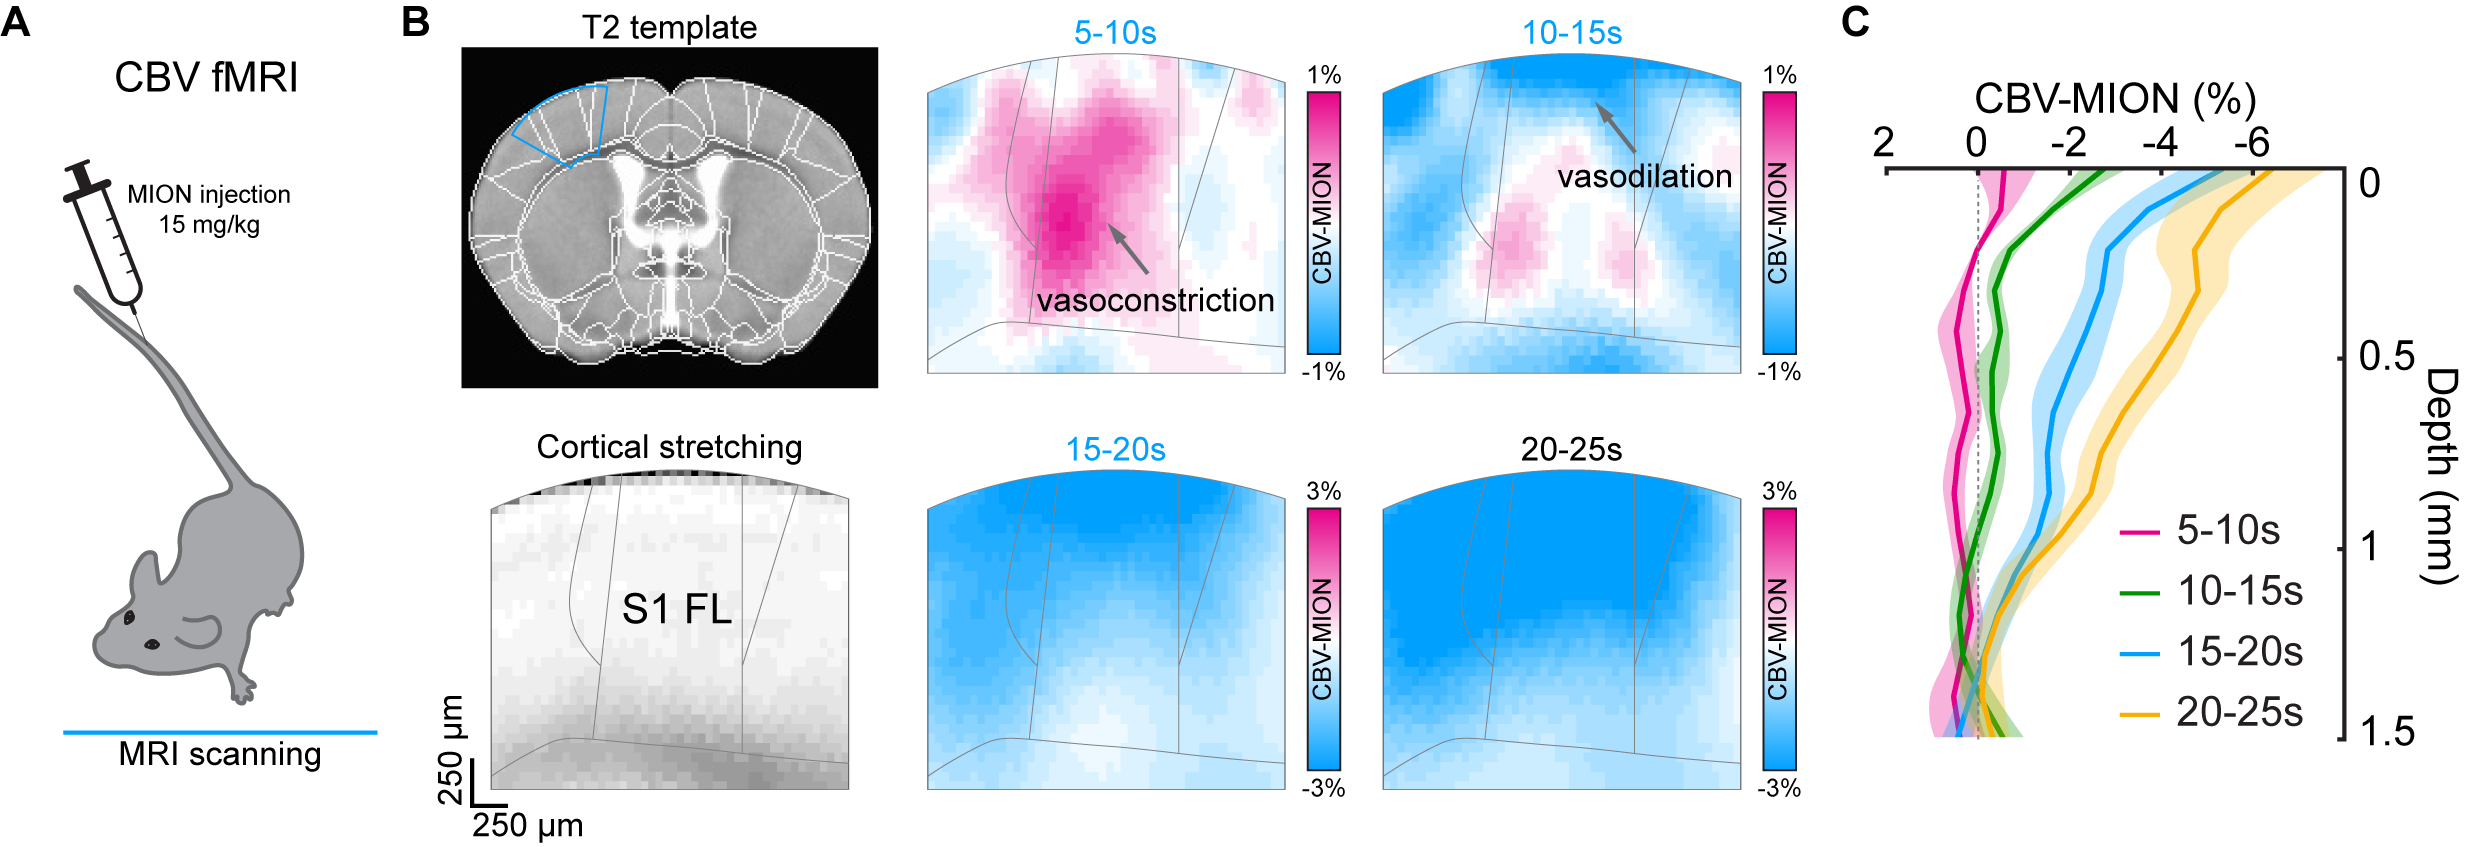
Figure 2. Laminar properties of PV-driven biphasic fMRI responses
(A) Schematic diagram of contrast agent iron oxide particle (MION) delivery via intravenous injection (IV) for CBV-weighted fMRI at 9.4T
(B) Depth-dependent CBV-weighted activation map series of optogenetic PV stimulation at S1FL area
(C) Cortical depth profiles of CBV-MION responses to 20-s optogenetic PV stimulation within L-S1FL area at time periods
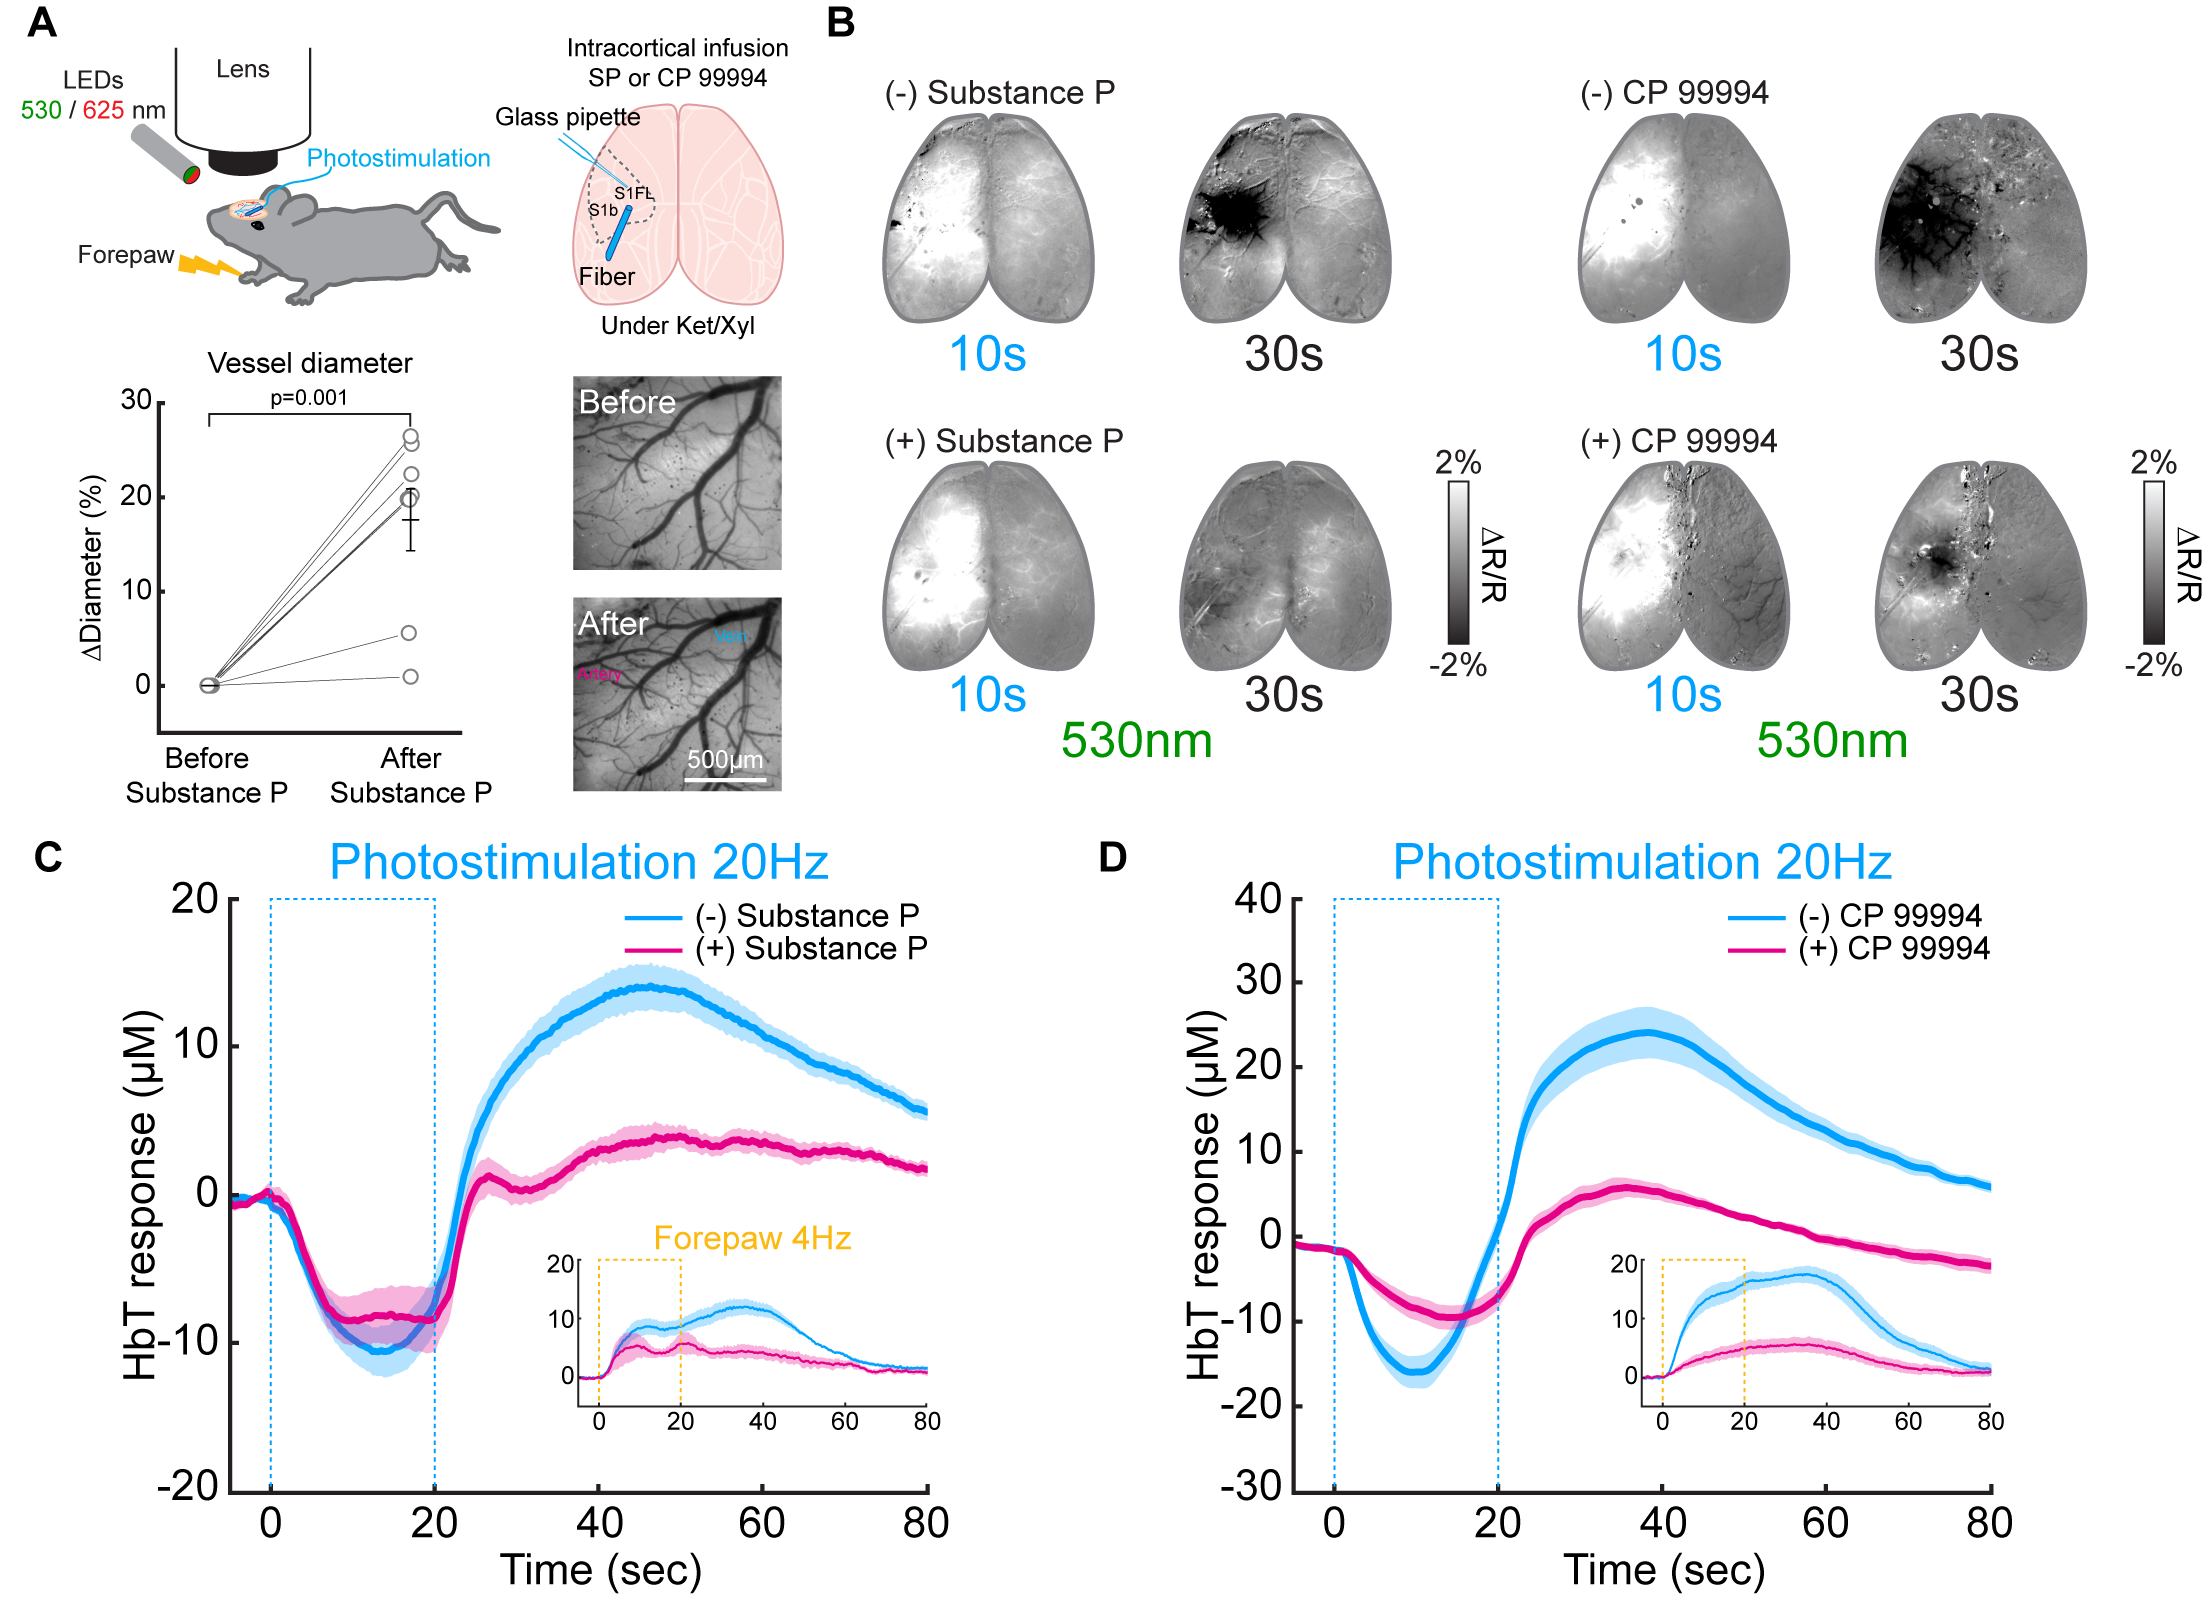
Figure 3. Modulation of later vasodilation to PV stimulation by pharmacological applications
(A) Schematic of wide-field optical experimental design with optogenetic stimulation and intracortical SP infusion
(B) CBV-weighted OIS maps to optogenetic stimulation of PV neurons before (-) and after application (+) of substance P and NK1 receptor blocker CP 99994
(C-D) ΔHbT time courses in the stimulation site responding to 20-s optogenetic stimulation of PV neurons before and after drug application. Inset: forepaw stimulation-induced responses
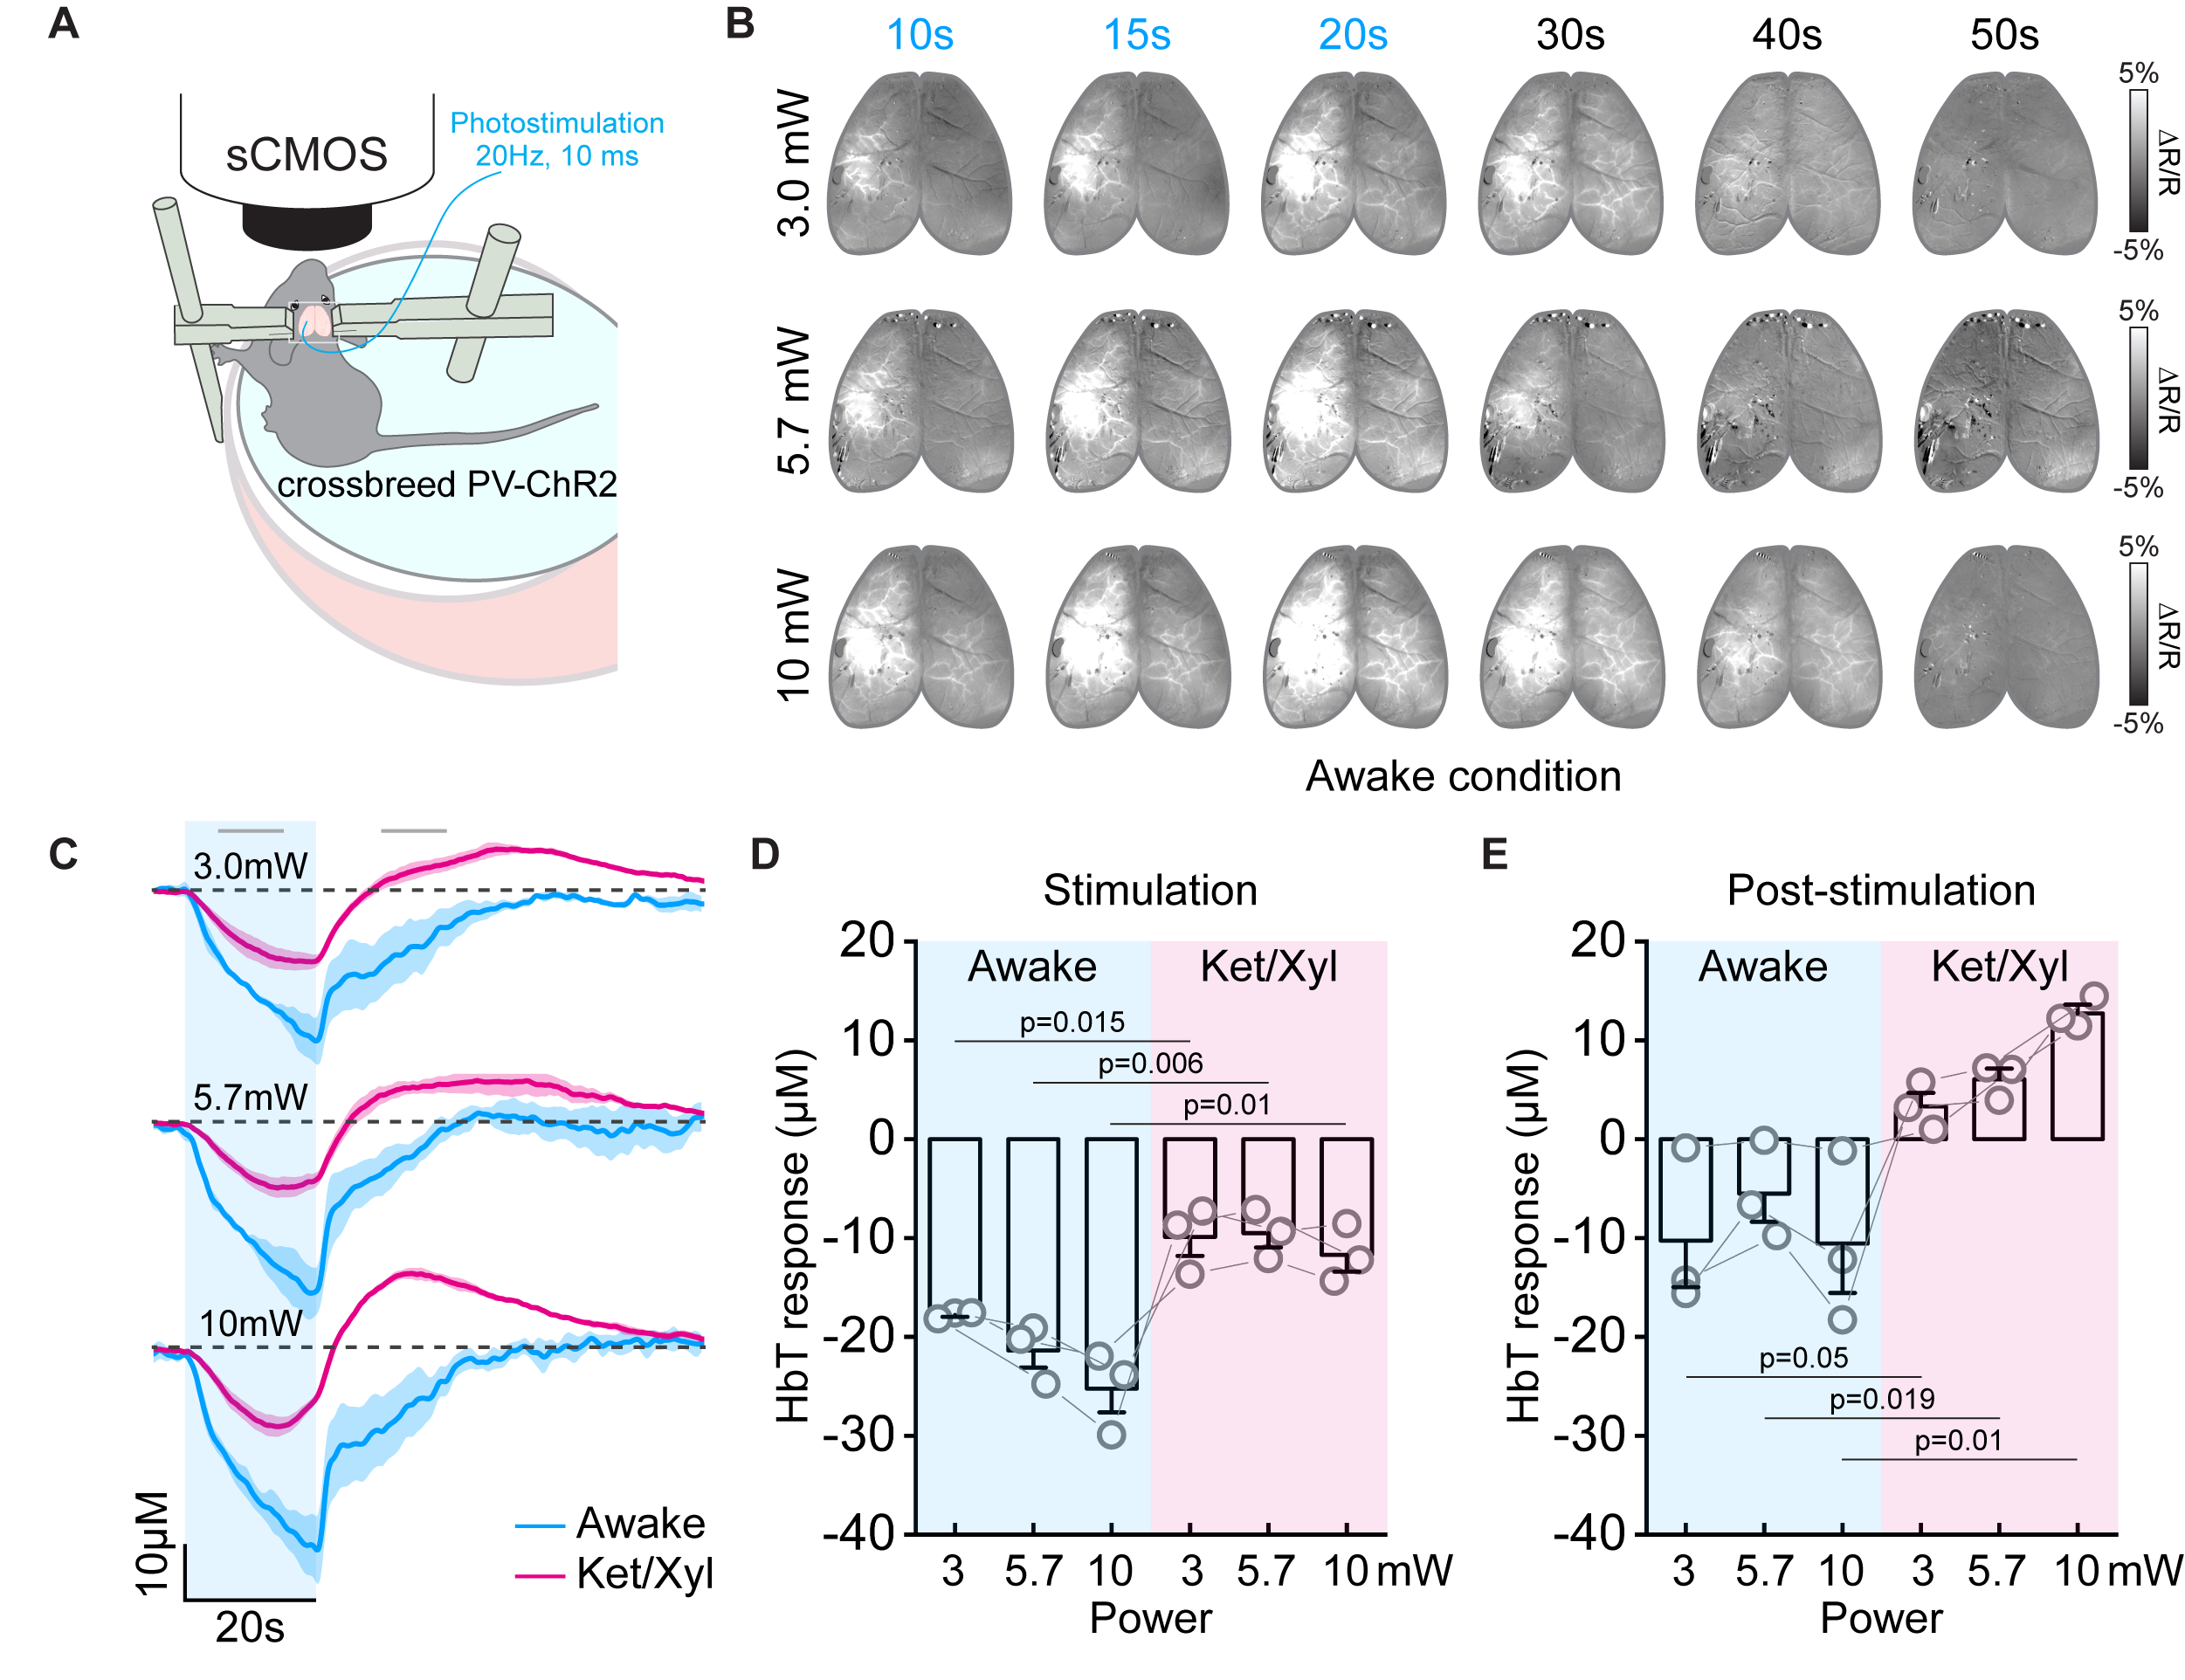
Figure 4. CBV responses to PV stimulation at awake and anesthetized conditions
(A) Schematic diagram of optical experiment in the awake condition
(B) CBV-weighted OIS map time series from one representative awake animal
(C) HbT time courses responding to PV stimulation under awake and Ket/Xyl anesthetized condition
(D-E) Quantified HbT changes at stimulation period and post-stimulation period
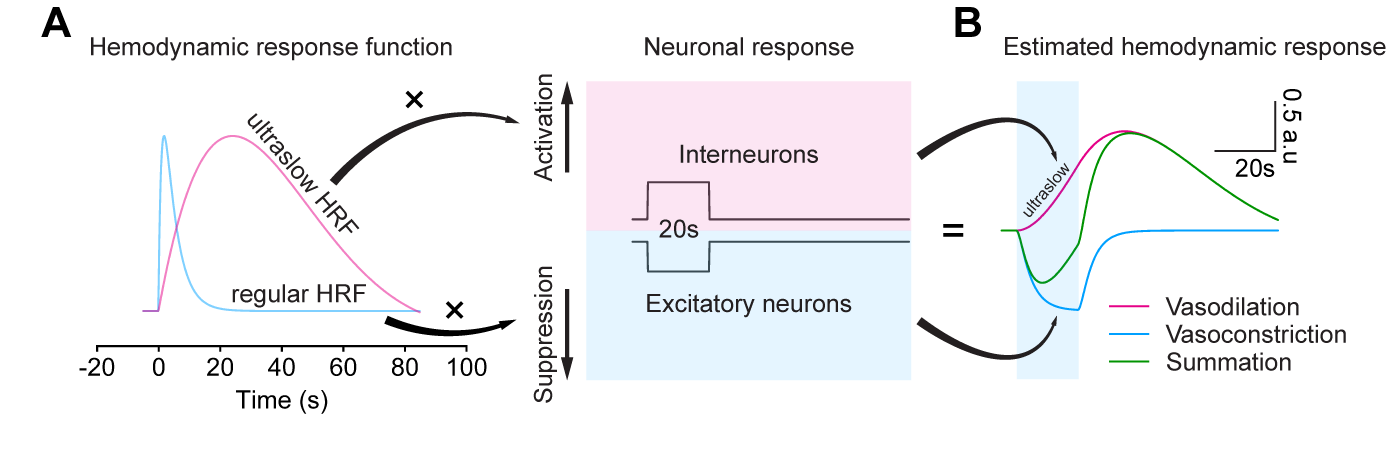
Figure 5. Biphasic hemodynamic response driven by PV neurons was estimated by two hemodynamic response functions (HRF)
(A) Regular and ultraslow HRF used for estimating PV-drive hemodynamic response
(B) Vasoconstriction is estimated by regular HRF vs. suppression of excitatory neurons, while ultraslow vasodilation is estimated by activation of PV neurons