0227
Separation of cortical and non-cortical networks to visual-somatosensory interaction by fMRI with optogenetic silencing1Department of Biomedical Engineering, Sungkyunkwan University (SKKU), Suwon 16419, South Korea, Center for Neuroscience Imaging Research, Institute for Basic Science (IBS), Suwon 16419, South Korea, Suwon, Korea, Republic of
Synopsis
Keywords: Brain Connectivity, fMRI (task based)
Multisensory integration is necessary for the animal to survive in the real world. Multiple studies with conventional methods established the multisensory integration process in multiple brain areas. This study aimed to investigate interactions between visual and somatosensory networks in a whole brain scale using 15.2T BOLD fMRI with the assistance of cortical silencing by optogenetic stimulation.Keywords: ultrahigh field fMRI, optogenetics, multimodal integration.Introduction
Multisensory integration is necessary for survival in the real world. Multiple conventional electrophysiology and optical imaging studies established the multisensory integration process in many areas [1-5]. With the simultaneous presence of visual and tactile stimulation, not only the higher-level association cortex, which is known as the posterior parietal association in mice (PTLs) [1] but also the barrel cortex (S1BF) [2, 3] and the ventral posteromedial nucleus of the thalamus (VPM) [4, 5] are enhanced compared to tactile stimuli only. These enhancements can be either through the primary visual cortex (VISp) or subcortical area. Since sensory networks in a whole brain can be mapped by fMRI, here we examined crossmodal interaction between visual and somatosensory networks by comparing unimodal vs. bimodal BOLD fMRI and dissected potential cross-modal pathways with silencing of VISp by optogenetic stimulation of inhibitory neurons.Methods
Animal & Data AcquisitionTwenty-two male mice (24-30g) were examined under ketamine-xylazine anesthesia [6]: 1) twelve C57BL/6 mice for visual and whisker stimulation BOLD fMRI, and 2) eleven transgenic mice with ChR2 in inhibitory neurons (VGAT-ChR2) for optogenetic fMRI. All MRI experiments were performed on a 15.2T/11-cm scanner.
BOLD fMRI was conducted using a single-shot GE-EPI: TR/TE=1000/11.5ms, spatial resolution=147×147×500μm3, and 16 contiguous coronal slices. Each fMRI trial consisted of a 40-s pre-stimulus, 20-s stimulus, 60-s inter-stimulus, 20-s stimulus, and 60-s post-stimulus. 8-10 fMRI trials were obtained for each stimulus condition on each animal.
Two experiments were performed. First, 12 C57BL/6 mice have undergone right eye stimulus (V), right whisker stimulation (W), and bimodal stimulation (WV). LEDs white cold light was used for visual stimuli: 4Hz, 10Lux light intensity, 10ms pulse width; the whisker pad was used for electrical stimuli: 4Hz, 0.5mA, and 0.5ms pulse width. Second, 11 VGAT-ChR2 mice were used to perform optogenetic fMRI for cortical silencing [7, 8]. The 200-μm diameter fiber-optic cannula was implanted in the left VISp. Photo-stimulation parameters: 20Hz with a pulse width of 10ms and 3mW laser at the fiber tip. Four different stimuli data were obtained: left VISp inhibition (O), right whisker stimuli with and without left VISp inhibition (W, WO), and right whisker + left VISp inhibition + right visual (WOV).
Data Processing
Data were processed with Matlab and the AFNI package. The preprocessing: slice timing correction, motion correction, temporal detrending, temporal normalization from baseline, and trial averaging. Then the standard GLM analysis was applied to identify significant BOLD responses (p<0.005; FWE corrected). Regions of interest (ROI) were defined on anatomical images referenced from Allen Mouse Brain Atlas. The mean BOLD percent change within the ROIs was averaged from 5 seconds after stimulation onset to 5 seconds after stimulation offset. Error bar: SEM. Statistical: ANOVA one-way repeated p<0.05.
Results
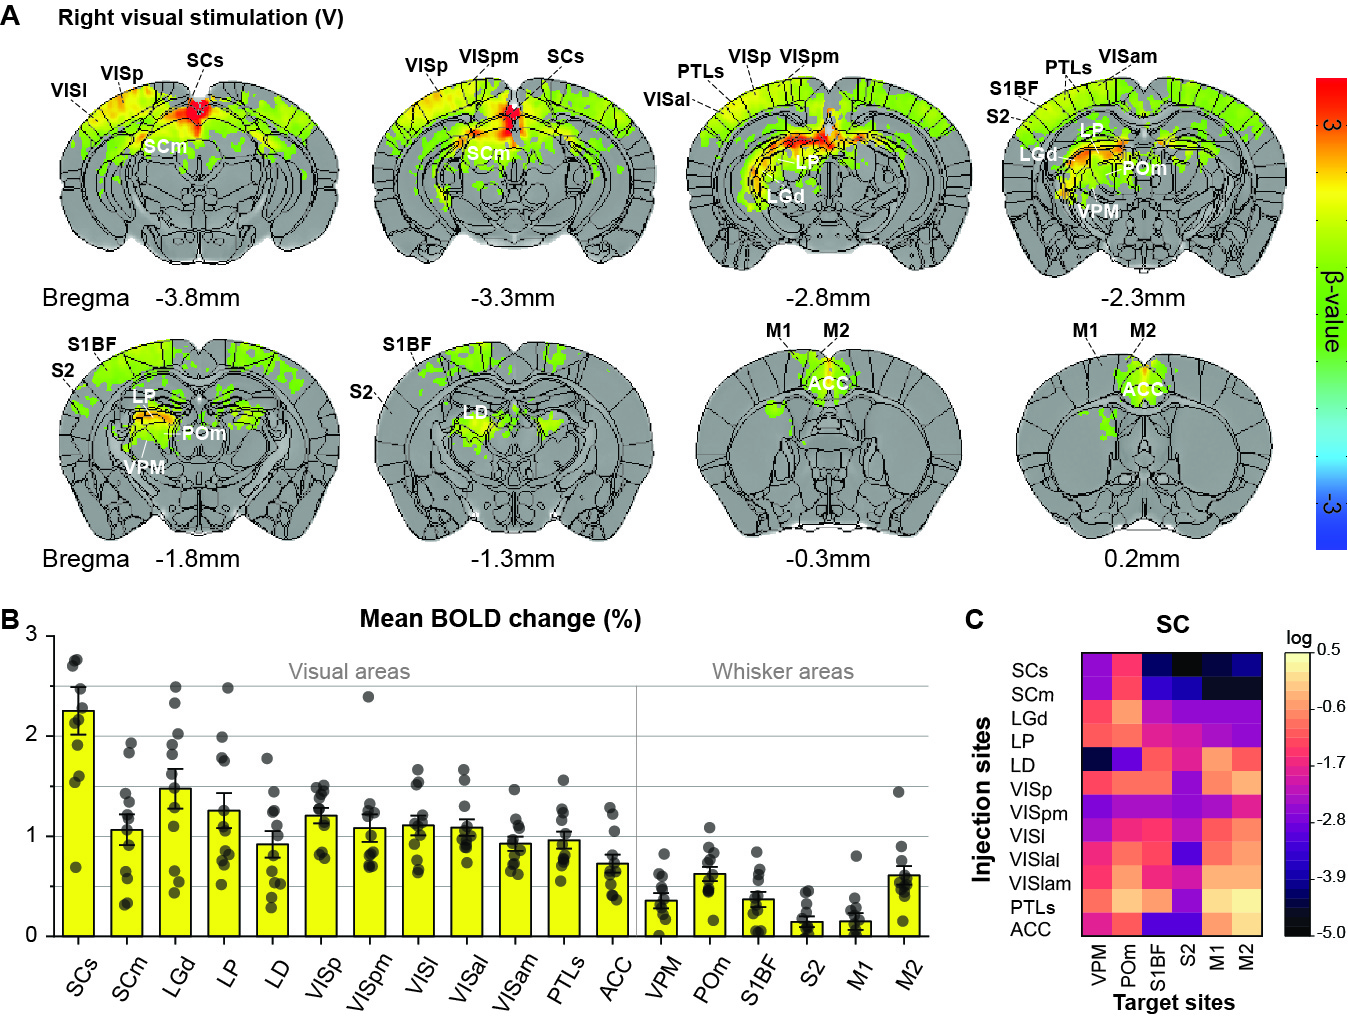
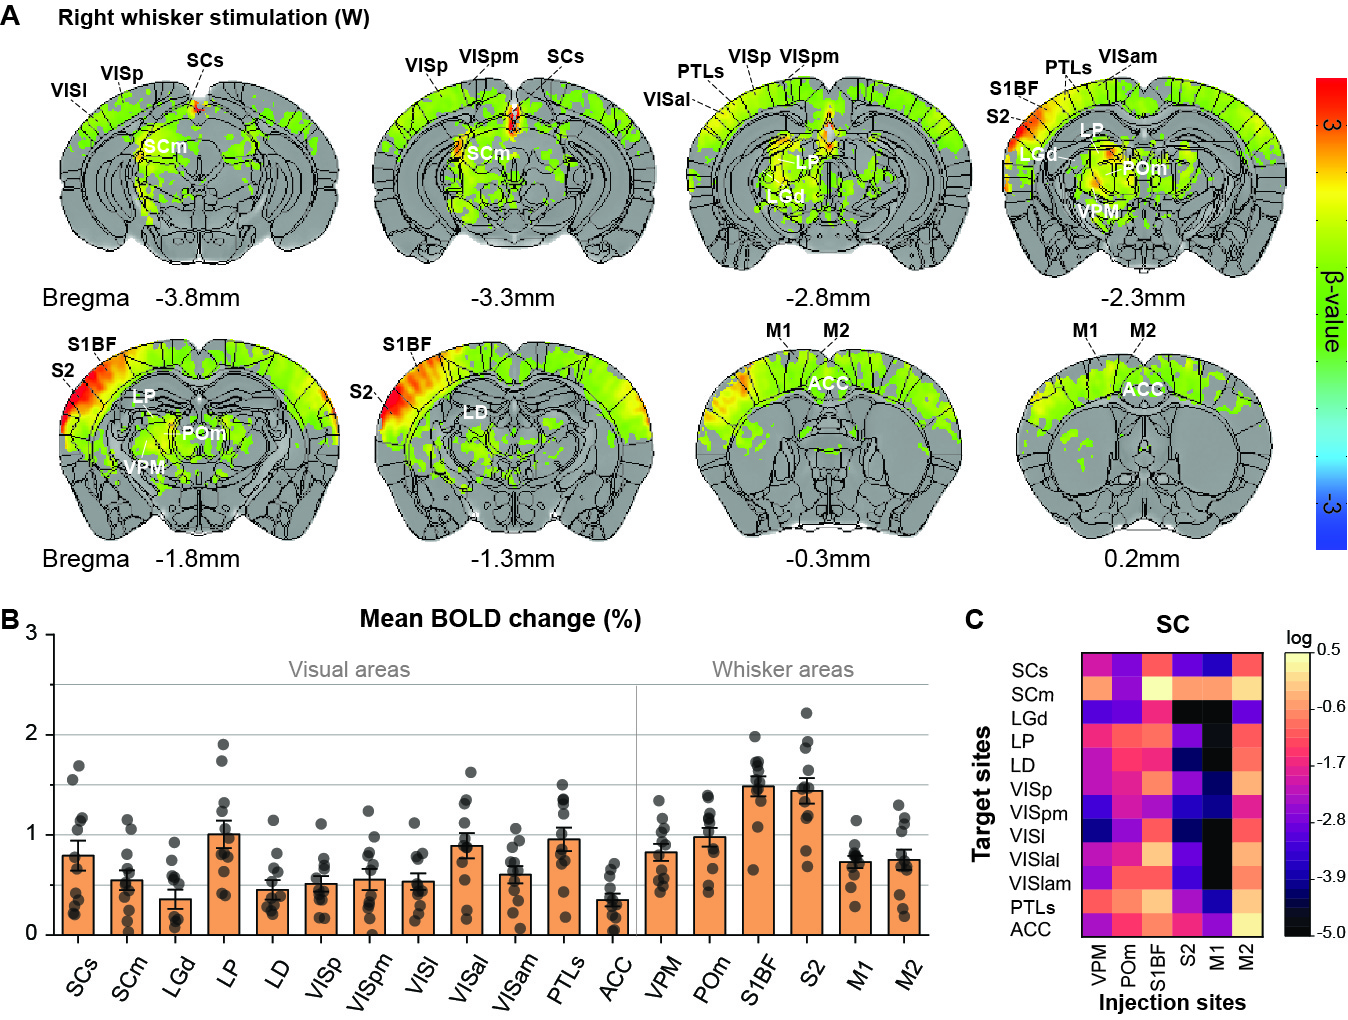
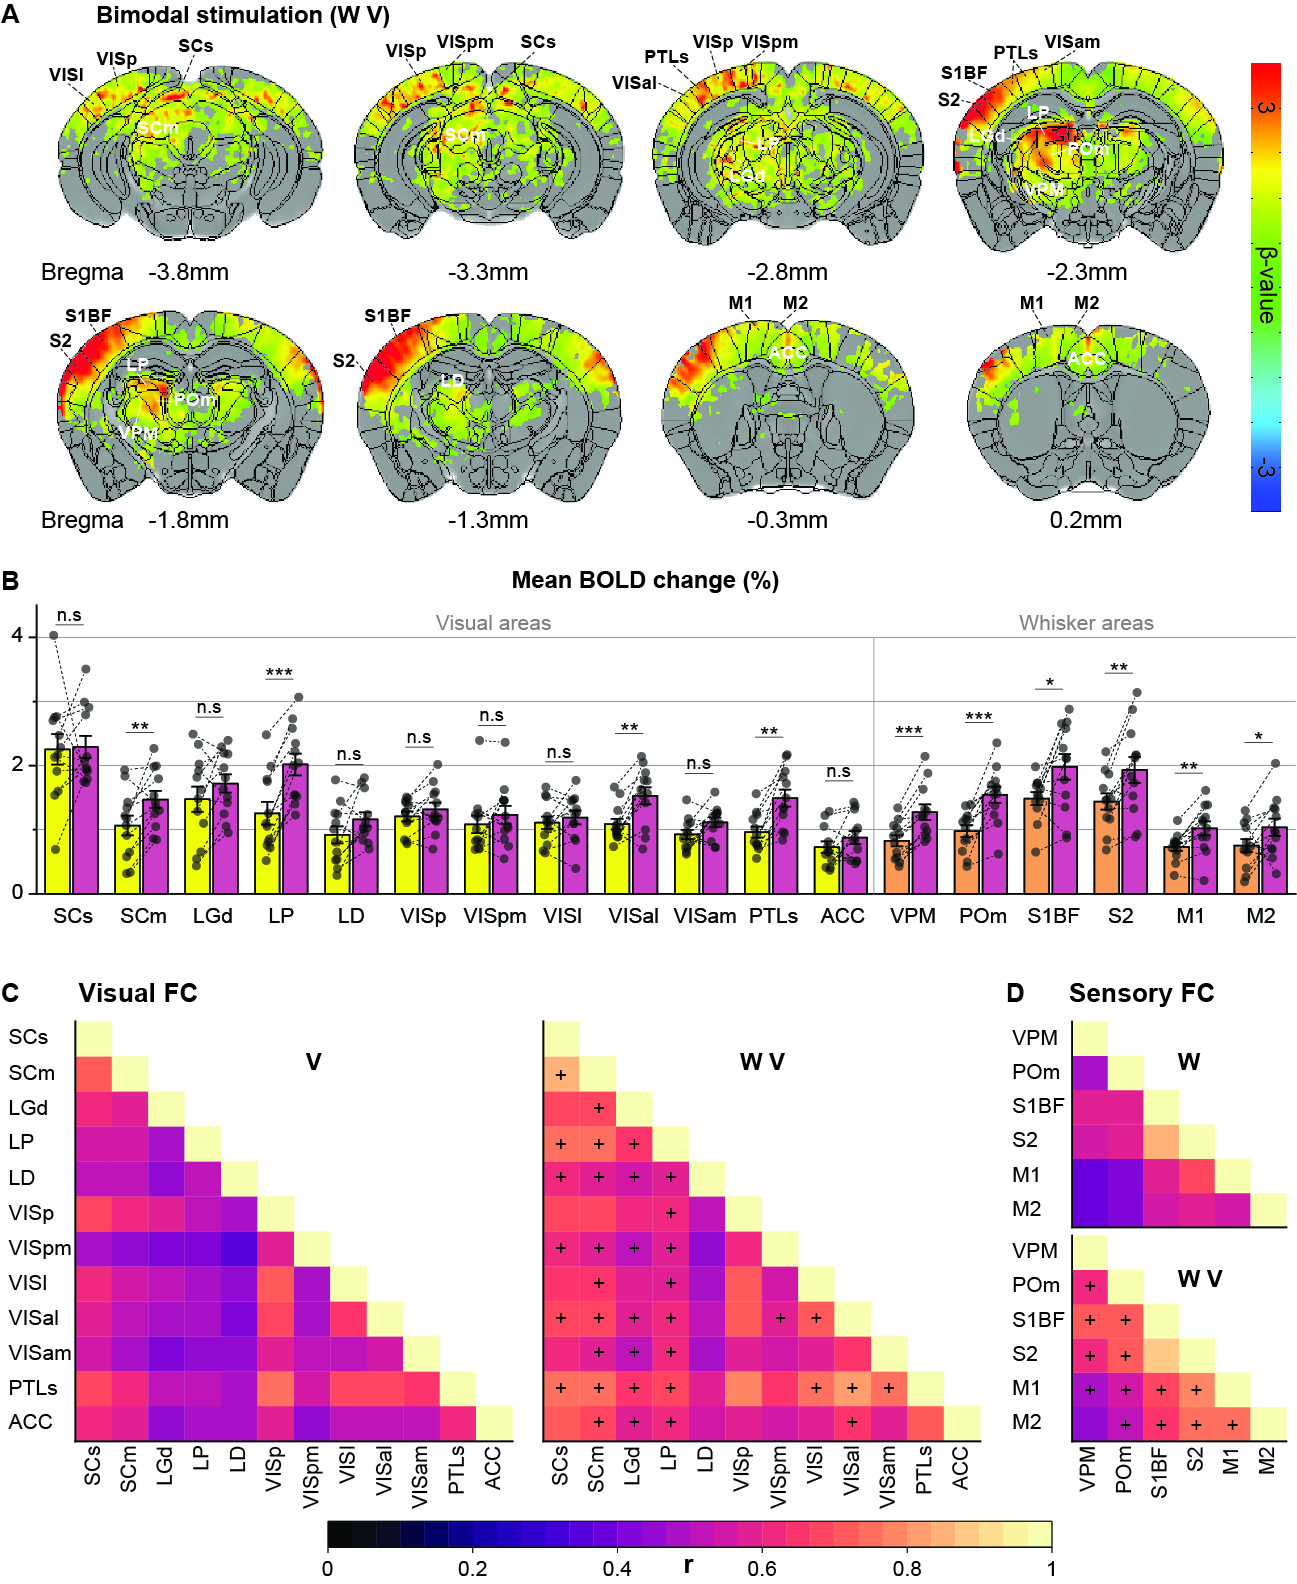
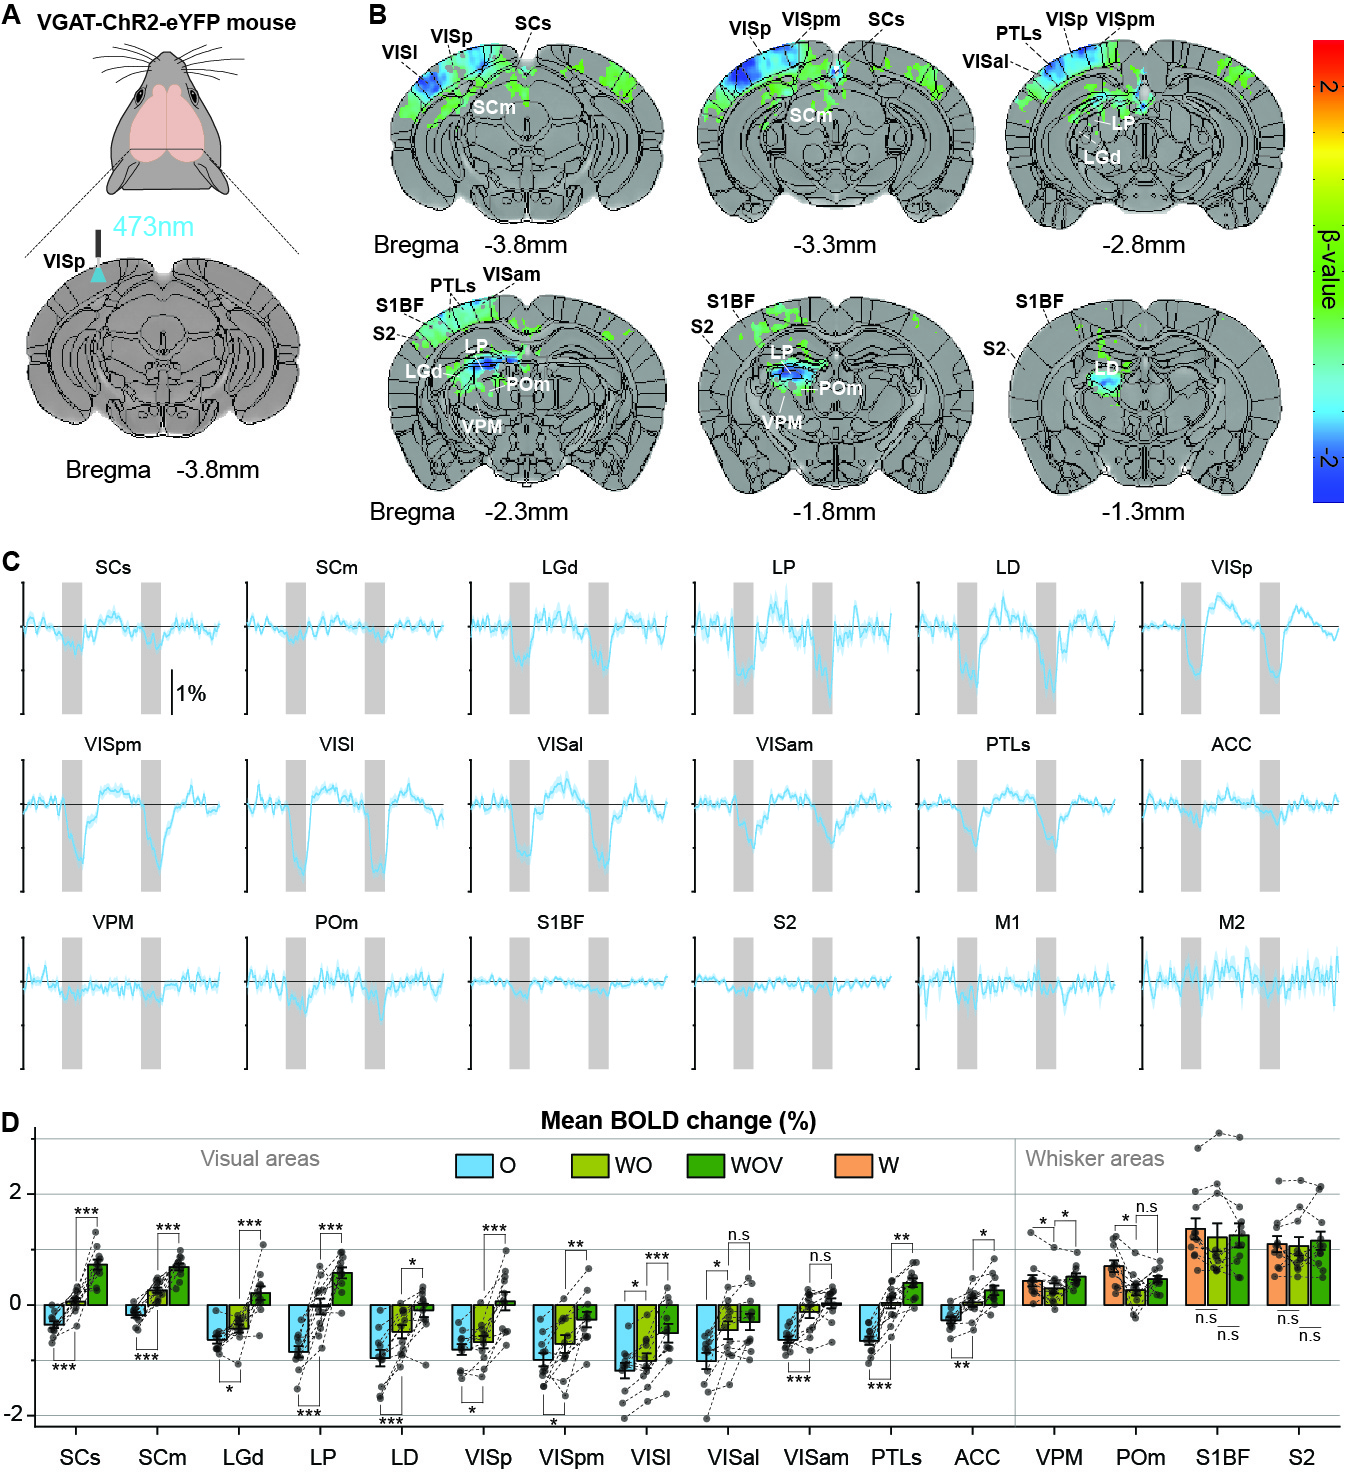
Initially, bimodal regions were determined by measuring unimodal and bimodal sensory-evoked fMRI. Visual and whisker stimulation induced responses in the visual and somatosensory networks. In addition, visual stimulus evoked significant responses in the somatosensory network: VPM, POm, S1BF, and the secondary motor cortex (M2) (Figure 1). Meanwhile, whisker stimulation evoked functional responses in most visual areas, except lateral geniculate complex (LGd) (Figure 2). Compared to unimodal, bimodal stimuli elicited higher BOLD responses in most somatosensory areas, and in higher-order visual areas, including lateral posterior nucleus of the thalamus (LP), superior colliculus (SC), anterolateral visual area, and PTLs (Figure 3). The higher-order visual areas were expected due to their multimodal integration role [1, 9, 10]. The enhancement of the somatosensory areas due to visual input during visuo-somatosensory interactions is consistent with previous studies [2, 4, 5].Since the visual-to-somatosensory integration in the somatosensory responses can be via the VISp or non-VISp, the contribution of the VISp network was examined by optogenetic silencing of VISp. The inhibition of VISp induced robustly negative BOLD changes in visual ROIs, VPM, POm, and S1BF. Further, the whisker responses in VPM and POm were reduced under VISp silencing, suggesting that the VISp-to-somatosensory circuits contribute to the bimodal integrations (Figure 4).
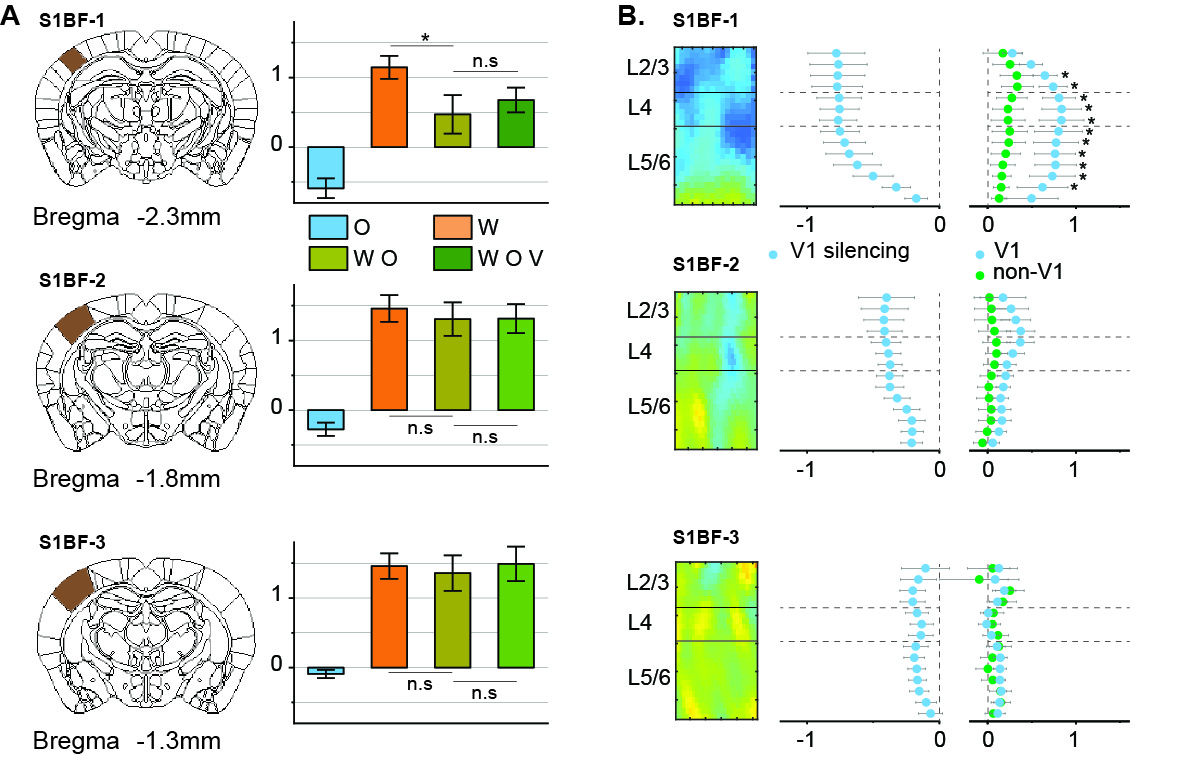
Then non-VISp effect on somatosensory responses was tested. Under VISp silencing, visual stimulus enhanced whisker responses in VPM but not in POm, suggesting non-VISp also contributes to visuo-somatosensory in somatosensory (Figure 4). Interestingly, the S1BF seems to be not affected by VISp and non-VISp. Thus, the BOLD responses of the S1BF were separated into anterior-posterior slices (Figure 5). VISp silencing only induced the negative BOLD change at upper cortical layers in the most anterior S1BF, while non-VISp pathways did not affect S1BF activity.
Discussion & Conclusion
Bimodal visual–somatosensory integration was successfully obtained by whole-brain fMRI with high spatial resolution. The influence of visual stimulus on whisker activity is higher than that in the opposite direction. Evoked fMRI with selective silencing of a specific brain area helps dissect the bimodal integration circuit on somatosensory activation [7, 8]. The optogenetic inhibition of VISp cortex revealed that visual information conveys to whisker processing via both VISp and non-VISp pathways, in which VPM receives the signal from both components. In contrast, POm was modulated by VISp but not non-VISp signal. Interestingly, S1BF was mostly modulated by VISp, possibly via thalamic POm and VPM pathways [9].Acknowledgements
This research was supported by the Institute of Basis Science (IBS-R015-D1).References
1. Olcese, U., G. Iurilli, and P. Medini, Cellular and synaptic architecture of multisensory integration in the mouse neocortex. Neuron, 2013. 79(3): p. 579-93.
2. Sieben, K., B. Roder, and I.L. Hanganu-Opatz, Oscillatory Entrainment of Primary Somatosensory Cortex Encodes Visual Control of Tactile Processing. Journal of Neuroscience, 2013. 33(13): p. 5736-5749.
3. Masse, I.O., et al., Asymmetric Direct Reciprocal Connections Between Primary Visual and Somatosensory Cortices of the Mouse. Cerebral Cortex, 2017. 27(9): p. 4361-4378.
4. Allen, A.E., et al., Convergence of visual and whisker responses in the primary somatosensory thalamus (ventral posterior medial region) of the mouse. Journal of Physiology-London, 2017. 595(3): p. 865-881.
5. Bieler, M., et al., Multisensory integration in rodent tactile but not visual thalamus. Scientific reports, 2018. 8(1): p. 1-18.
6. Shim, H.J., et al., Mouse fMRI under ketamine and xylazine anesthesia: Robust contralateral somatosensory cortex activation in response to forepaw stimulation. Neuroimage, 2018. 177: p. 30-44.
7. Jung, W.B., et al., Dissection of brain-wide resting-state and functional somatosensory circuits by fMRI with optogenetic silencing. Proc Natl Acad Sci U S A, 2022. 119(4).
8. Lee, J.Y., et al., Role of anterior cingulate cortex inputs to periaqueductal gray for pain avoidance. Curr Biol, 2022. 32(13): p. 2834-2847 e5.
9. Gharaei, S., et al., Superior colliculus modulates cortical coding of somatosensory information. Nat Commun, 2020. 11(1): p. 1693.
10. Leow, Y.N., et al., Brain-wide mapping of inputs to the mouse lateral posterior (LP/Pulvinar) thalamus-anterior cingulate cortex network. J Comp Neurol, 2022. 530(11): p. 1992-2013.
11. Oh, S.W., et al., A mesoscale connectome of the mouse brain. Nature, 2014. 508(7495): p. 207-14.
Figures