0226
The Influence of b value and Resolution on MR Tractography and Connectome Construction in Adult Mouse Brain at 16.4 Tesla1Centre for Advanced Imaging, The University of Queensland, Brisbane, Australia, 2The School of Biomedical Sciences, The University of Queensland, Brisbane, Australia
Synopsis
Keywords: Brain Connectivity, Diffusion/other diffusion imaging techniques, Tractography
Several pipelines are available to quantify mouse brain connectome using diffusion-tractography. However, data acquisition and processing methods used a wide range of parameters. In this study, ex-vivo adult mouse brains were scanned using a range of b values, and spatial and angular resolutions at 16.4 T. iFOD2 were used for fibertracking to generate the connectomes. Network analysis revealed increased nodal degree and reduced connectivity at 75 μm and this change increases at higher b value. Comparison with Allen mouse brain atlas showed consistent connectome profiles were achieved by acquiring diffusion with b=5000 s/mm2 at 100 μm resolution and 30 directions.
Introduction
Magnetic resonance diffusion weighted imaging (DWI) is sensitive to water diffusion, which makes it a unique tool to study the brain’s microstructure and connectome 1. More accurate connectivity measures can be obtained by increasing the angular sampling and the number of b values which may reduce biases in mapping diffusion 2,3. Several acquisition techniques for mouse brain connectome studies have been reported 4-6. However, the influence of diffusion imaging factors such as spatial and angular resolutions and b values on the accuracy of mapping the mouse brain connectome at 16.4 T has not been investigated. This study aims to optimize both the diffusion acquisition protocol and data processing for fiber tracking and to achieve reliably stable structural connectome. This optimized pipeline would guide future studies aiming to investigate connectome changes in mouse models of neuropathological conditions using diffusion-MRI tractography.Methods
Animal Preparation
11 wild-type adult C57BL6/J mice were perfused then fixated using phosphate buffered solution (PBS; BioWhittaker, USA) and 4% paraformaldehyde (PFA) (pH 7.4; Sigma Aldrich, USA), respectively. Skulls were further post-fixed in 4% PFA for 24 hours then immersed in 0.1 M PBS with 0.2% gadobutrol (Gadovist, Bayer, Ontario, Canada) to enhance MRI contrast. Brain data were acquired using the 16.4 T Bruker Ultrashield Plus 700 WB spectrometer equipped with a 15 mm linear surface acoustic wave coil and a Micro 2.5 gradient (Gmax 1.5 T/m) and running Paravision 6.0.1.Diffusion MRI Data Acquisition
Samples were scanned first using high-resolution 3D T1 weighted Fast Low Angle Shot sequence at (30 μm)3 isotropic resolution for structural imaging; and 5 different 3D Stejskal-Tanner DWI spin-echo protocols as illustrated in Table 1 below. A zero-filling factor of 1.5 was used during Fourier Transform of the DWI data to improve the digital resolution and fiber tracking process 7,8.Data Pre-processing and Analysis
MRtrix3 was used to denoise the data, calculate the response function, compute fiber orientation distribution function (iFOD2) map and perform fibretracking 9. Nodes of the structural connectome were defined using a 106 regions of interest atlas of adult C57BL/6 mouse 10. The atlas was registered to each subject’s b0 image firstly using linear transformation (rigid and affine) followed by a deformable transformation with higher degrees of freedom 11. The edges between these nodes were then computed using MRtrix3 9.Structural Connectome Analysis
Edges in the connectome were converted to weighted edges by dividing the number of streamlines reaching a target node by the total number of streamlines generated by the source node. Networks’ topological features were then compared using graph theory analysis while changes in networks connectivity were analysed using the Network-Based Statistic Toolbox (NBS) 12,13. For NBS connectomes were compared by computing the compute the family-wise error rate-corrected p-value over a range of thresholds (t = 2.1 – 6.5) with an increment of 0.1 each time for each component. For topological analysis included the following metrics; degree centrality, betweenness, small-worldness, and modularity. Network metrics were computed over 10 thresholds ranging between t = 0.05 to t = 0.5 of the network sparsity.Results
At the resolution of 100 µm, NBS analysis showed that no significant change in connectivity was seen with increasing the number of directions nor with increasing the b value. However, increasing the resolution to 75 µm resulted in significant change of connectivity compared to our in-house protocol (100 µm – 5000 s/mm2). Table 2 below summarizes the NBS results. Table 3 and Table 4 illustrate the findings where a significant change in connectivity was observed.Graph theory analysis showed that no significant change (p > 0.05) was seen in small-worldness, betweenness, nor the modularity between the five protocols. Nonetheless, both 75 µm-5000 s/mm2 and 75 µm-7500 s/mm2 protocols showed significantly increased degree and degree’s area under the curve (AUC) compared to the 100 µm-5000 s/mm2 protocol. The change in network metrics is illustrated in below.
Discussion
Mapping the structural connectome through fibretracking is affected by both the b value and spatial resolution. However, our results showed that increasing the angular resolution beyond 30 DWI-directions did not affect the mapping accuracy in the expense of increase scanning time.Although using higher b values theoretically would improve the accuracy of measuring diffusion, that comes with the tradeoff of losing more signal which in turn lowers the accuracy of deriving FOD function 15,16. Our results revealed increased false-negative connectivity when increasing the b value beyond 5000 s/mm2.
Increasing spatial resolution would improve mapping the diffusion. This would decrease the signal and requires using multiple averages to preserve the signal to noise ratio which lengthen scanning time 17,18. This study showed that increasing the resolution to 75 µm while keeping the number of averages at 1 affected the accuracy of FOD-derived fibretracking leading to increased false negatives.
Conclusion
Quantifying a more stable and reliable connectome is achieved by acquiring the diffusion data at 100 µm isotropic spatial resolution, 30 DWI-directions, and b value of 5000 s/mm2. Also, the relatively short scanning time allows for longitudinal studies at large sample size. This can be a standard pipeline for future mouse brain connectome studies.Acknowledgements
We acknowledge the supports from the Queensland NMR Network and the National Imaging Facility (a National Collaborative Research Infrastructure Strategy capability) for the operation of 16.4T MRI at the Centre for Advanced Imaging, the University of Queensland. MA would like to acknowledge Jordan University of Science and Technology for PhD scholarship.
References
1. Berman JI, Lanza MR, Blaskey L, Edgar JC, Roberts TPL. High angular resolution diffusion imaging probabilistic tractography of the auditory radiation. American Journal of Neuroradiology. 2013;34(8):1573-1578.
2. Vos SB, Aksoy M, Han Z, et al. Trade-off between angular and spatial resolutions in in vivo fiber tractography. NeuroImage. 2016;129:117-132.
3. Jeurissen B, Tournier J-D, Dhollander T, Connelly A, Sijbers J. Multi-tissue constrained spherical deconvolution for improved analysis of multi-shell diffusion MRI data. NeuroImage. 2014;103:411-426.
4. Calabrese E, Badea A, Cofer G, Qi Y, Johnson GA. A Diffusion MRI Tractography Connectome of the Mouse Brain and Comparison with Neuronal Tracer Data. Cerebral Cortex. 2015;25(11):4628-4637.
5. Wu D, Xu J, McMahon MT, et al. In vivo high-resolution diffusion tensor imaging of the mouse brain. NeuroImage. 2013;83:18-26.
6. Aydogan DB, Jacobs R, Dulawa S, et al. When tractography meets tracer injections: a systematic study of trends and variation sources of diffusion-based connectivity. Brain Structure and Function. 2018;223(6):2841-2858.
7. Alomair OI, Brereton IM, Smith MT, Galloway GJ, Kurniawan ND. In vivo high angular resolution diffusion-weighted imaging of mouse brain at 16.4 Tesla. PloS one. 2015;10(6):e0130133.
8. Raffelt D, Tournier JD, Rose S, et al. Apparent Fibre Density: A novel measure for the analysis of diffusion-weighted magnetic resonance images. NeuroImage. 2012;59(4):3976-3994.
9. Tournier J-D, Smith R, Raffelt D, et al. MRtrix3: A fast, flexible and open software framework for medical image processing and visualisation. NeuroImage. 2019;202:116137.
10. Liu C, Li Y, Edwards TJ, Kurniawan ND, Richards LJ, Jiang T. Altered structural connectome in adolescent socially isolated mice. Neuroimage. 2016;139:259-270.
11. Avants BB, Tustison NJ, Song G, Cook PA, Klein A, Gee JC. A reproducible evaluation of ANTs similarity metric performance in brain image registration. NeuroImage. 2011;54(3):2033-2044.
12. Wang J, Wang X, Xia M, Liao X, Evans A, He Y. GRETNA: a graph theoretical network analysis toolbox for imaging connectomics. Frontiers in human neuroscience. 2015;9:386.
13. Zalesky A, Fornito A, Bullmore ET. Network-based statistic: identifying differences in brain networks. Neuroimage. 2010;53(4):1197-1207.
14. Oh SW, Harris JA, Ng L, et al. A mesoscale connectome of the mouse brain. 2014;508(7495):207-214.
15. Yeh C-H, Tournier JD, Cho K-H, Lin C-P, Calamante F, Connelly A. The effect of finite diffusion gradient pulse duration on fibre orientation estimation in diffusion MRI. NeuroImage. 2010;51(2):743-751.
16. Alexander DC, Barker GJ. Optimal imaging parameters for fiber-orientation estimation in diffusion MRI. NeuroImage. 2005;27(2):357-367.
17. Chen Y-L, Lin Y-J, Lin S-H, et al. The effect of spatial resolution on the reproducibility of diffusion imaging when controlled signal to noise ratio. Biomedical Journal. 2019;42(4):268-276.
18. Bastin ME, Armitage PA, Marshall I. A theoretical study of the effect of experimental noise on the measurement of anisotropy in diffusion imaging. Magnetic Resonance Imaging. 1998;16(7):773-785.
Figures
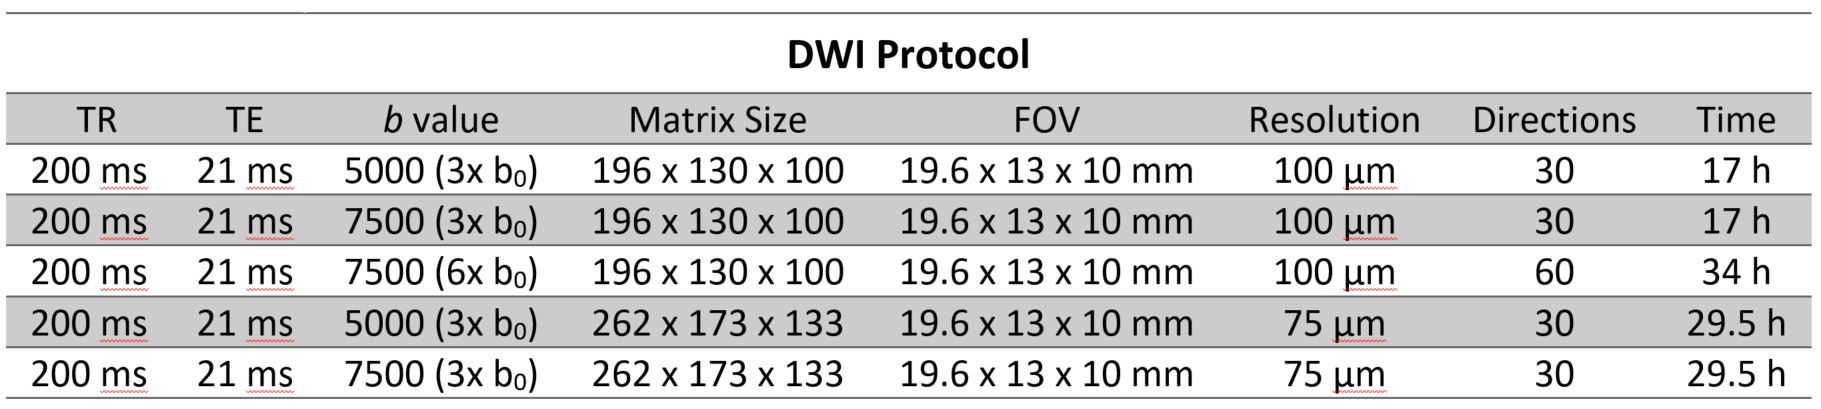
Table 1: DWI sequence parameters.
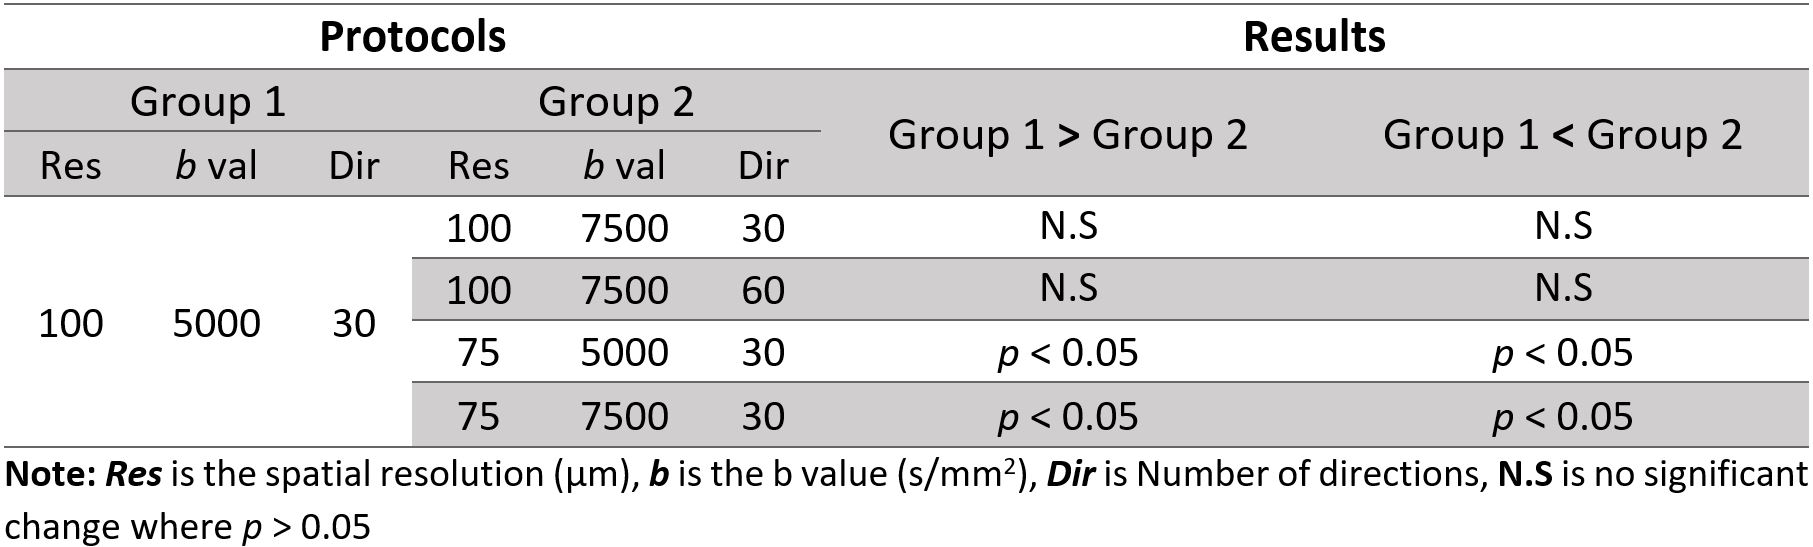
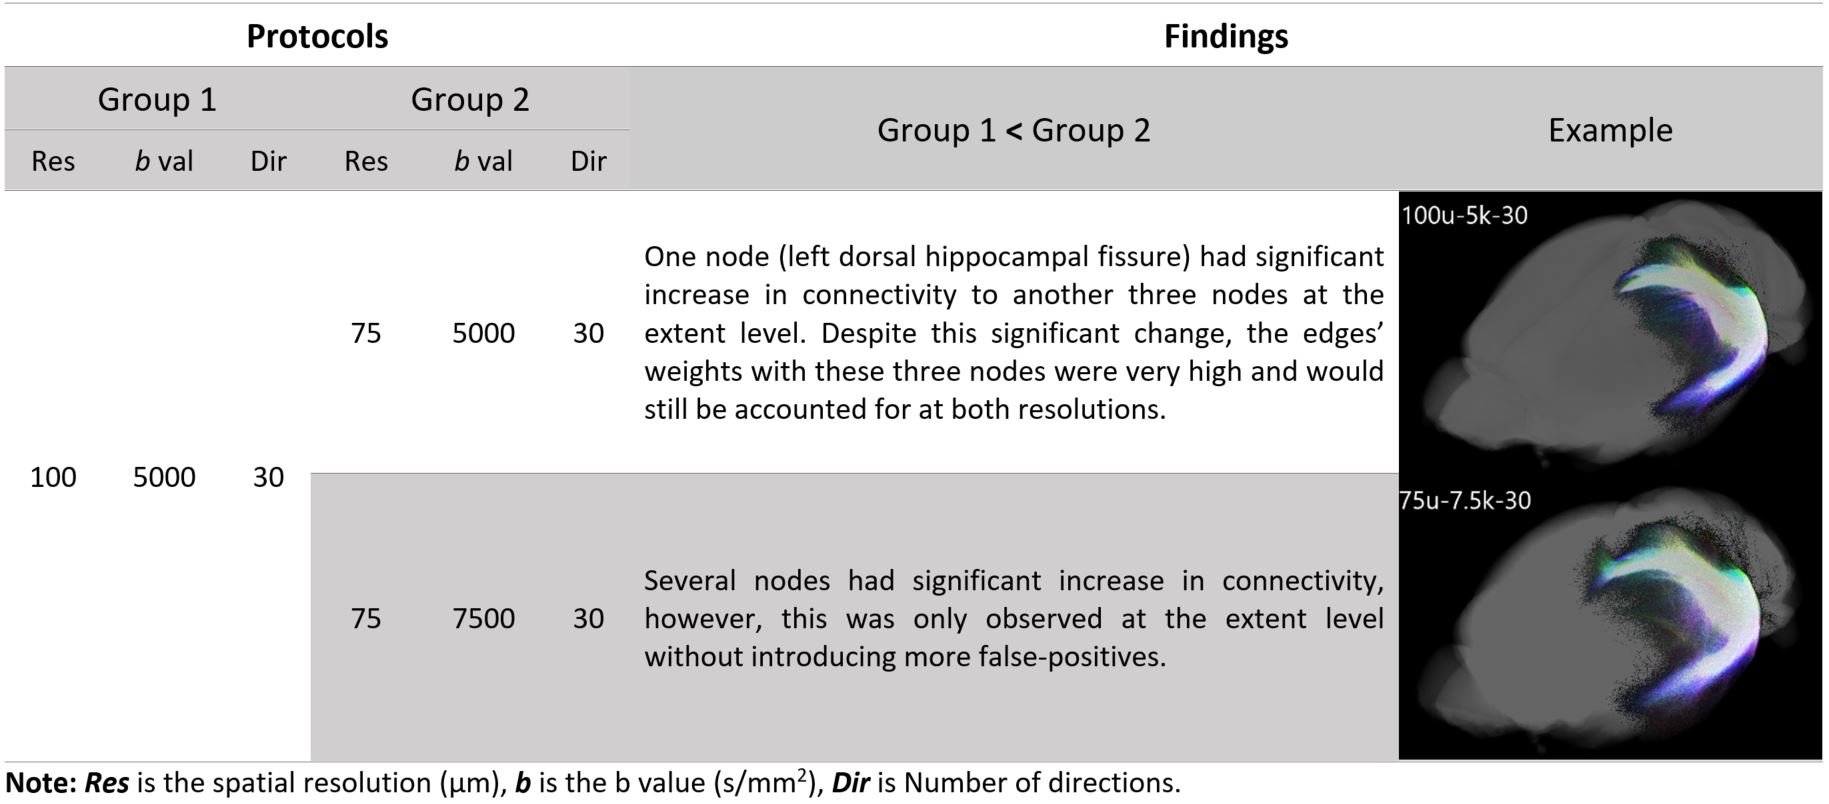
Table 3: Findings where group 2 showed significant increase in connectivity compared to 1 (p < 0.05). The example shows tractography profile between the left subiculum and the left dorsal hippocampal fissure.
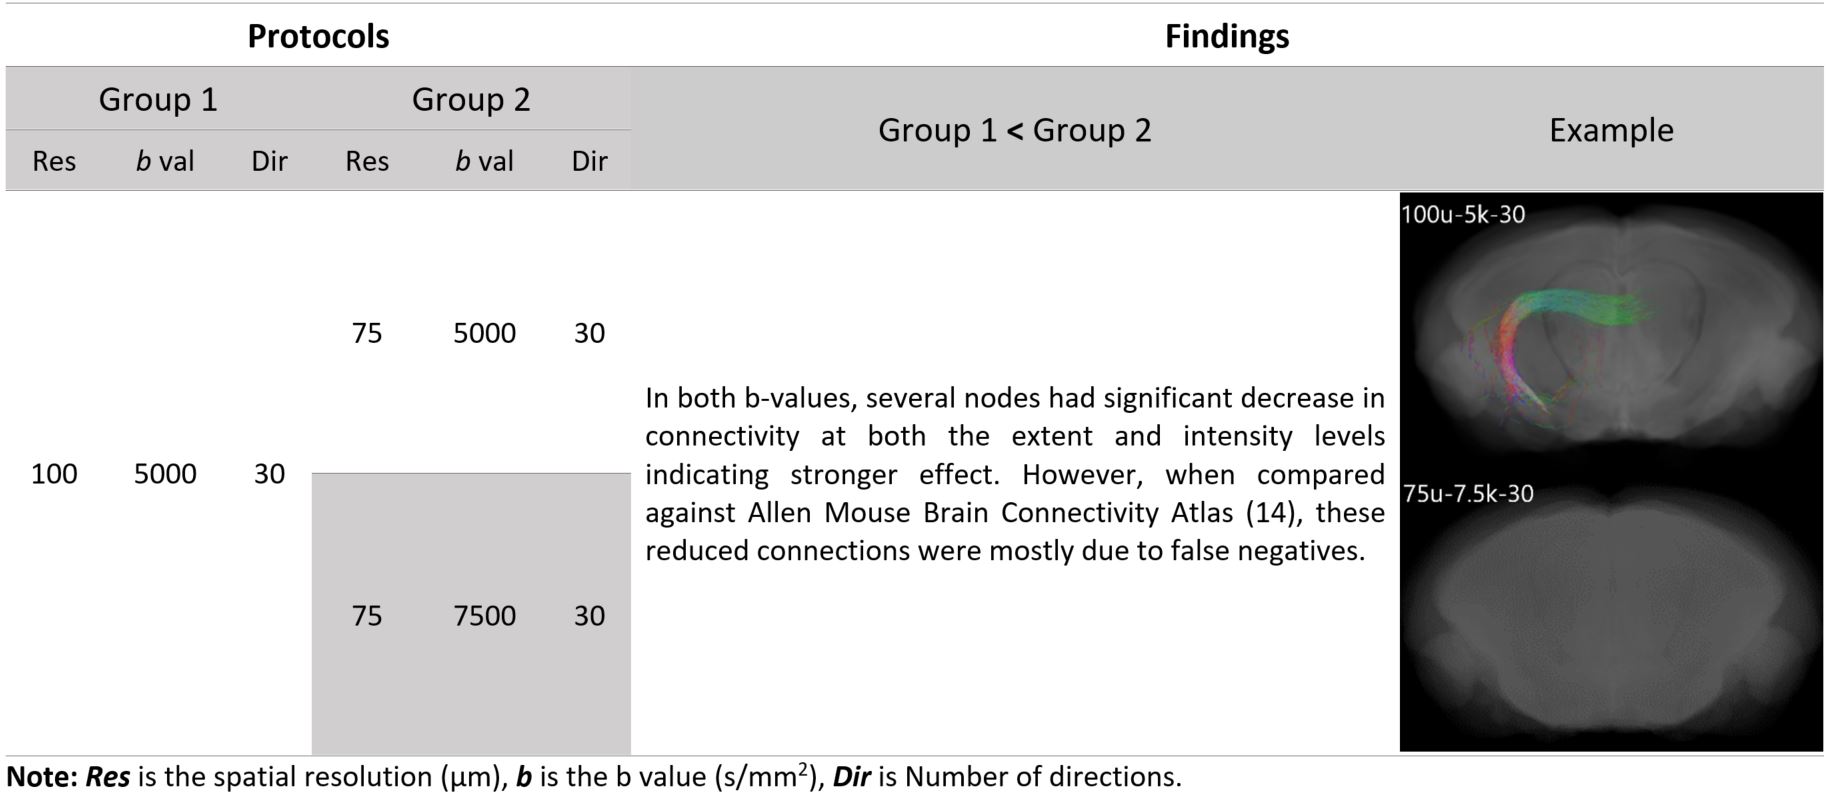
Table 4: Findings where group 2 showed significant decrease in connectivity compared to 1 (p < 0.05). The example shows tractography profile of the connection the ventral hippocampal commissure and the right amygdala.
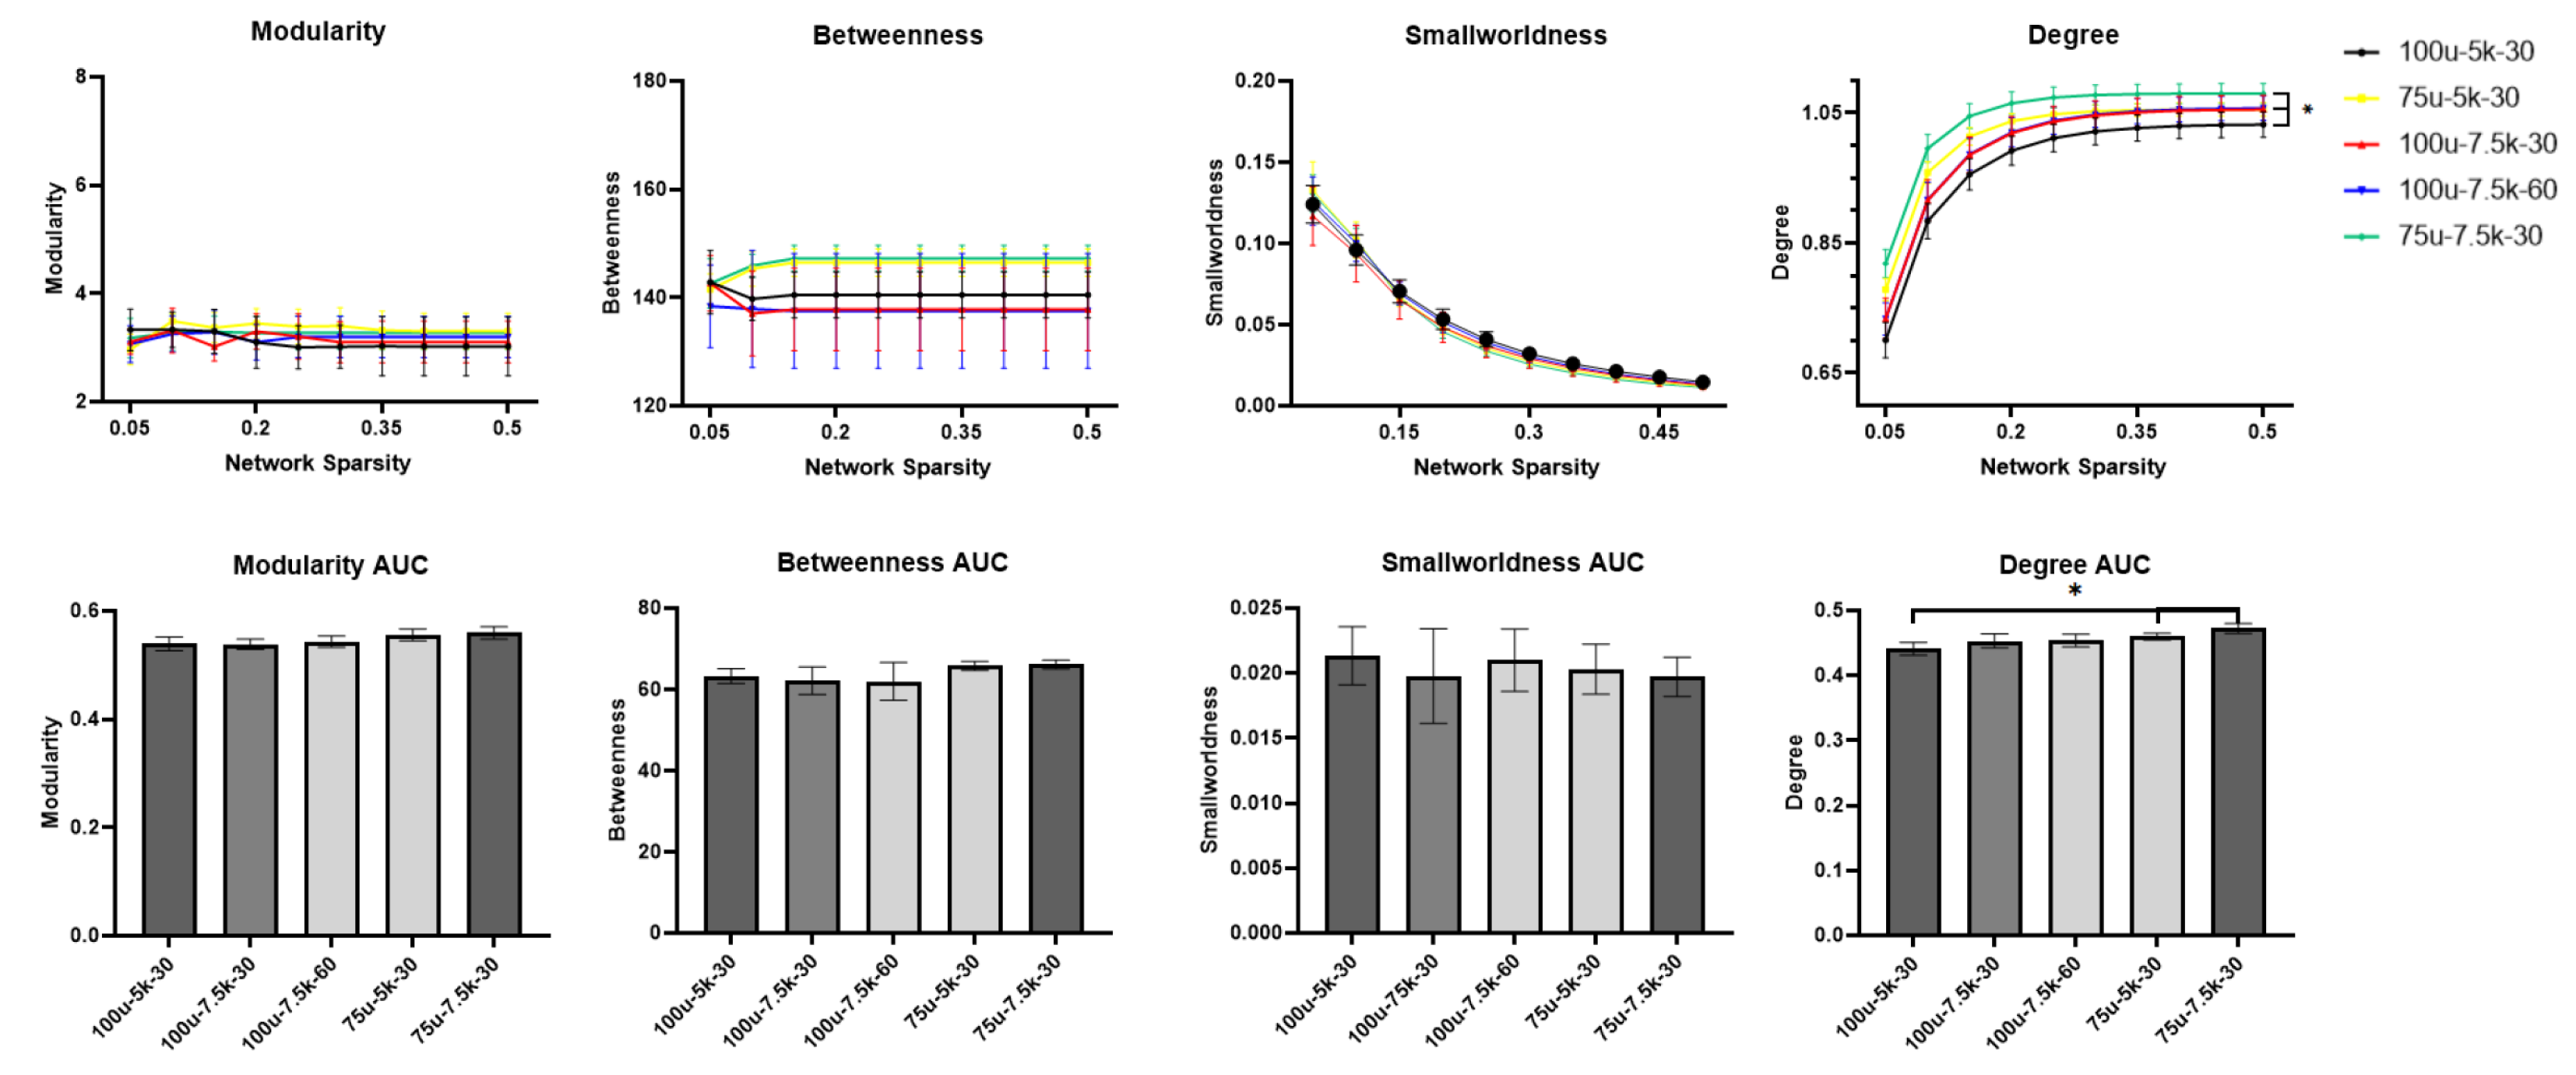
Fig 1: Network metrics across network sparsity and their area under the curve (AUC). No significant change was seen with increasing both the b value and the number of directions at the resolution of 100µ. Increasing the resolution showed significant increase in degree metrics compared to 100µm-5000 s/mm2 protocol. Asterisks (*) indicates that p < 0.05.