0225
Optimizing Reproducibility of White Matter Tractography in Longitudinal Imaging of a Large Sample of Developing Adolescents1Radiology & Biomedical Imaging, University of California, San Francisco, San Francisco, CA, United States
Synopsis
Keywords: Brain Connectivity, Adolescents
The best method for automatically producing replicable white matter (WM) tracts from diffusion imaging is not known. We use Automated Fiber Quantification (AFQ) to compare probabilistic and deterministic models’ performance generating 18 WM tracts for each of 1000 adolescents at baseline and 2-year follow up. We gauged performance on the correlation between fractional anisotropy (FA) values and degree of volumetric overlap (DICE score). Based on these measures we found that a probabilistic approach was able to more reliably generate tract profiles over time within individual subjects.Introduction
The integrity of white matter tracts is critical to brain development and health. By quantifying the directional movement of water molecules diffusion weighted imaging (DWI) permits in-vivo assessment of tissue microstructure and white matter tract integrity in the human brain. These measurements have the potential to provide non-invasive imaging markers for a range of neurobehavioral and neuropsychiatric phenotypes. However, widespread adoption of these methods has been limited by uncertainty about the optimal methodology to produce robust reproducible results. These include questions about the optimal tractography method to use, the appropriate spatial scale at which to study tracts, and the best parameters to measure tract integrity. Broadly tractography algorithms use either probabilistic or deterministic models. Deterministic tractography computes the dominant fiber direction at every voxel as the direction of the principal eigenvector and propagates the fiber tract bidirectionally from a user defined seed region.1 In contrast probabilistic tractography propagates each tract by initiating many possible tracts from a given seed and selecting the most likely path from a probability distribution of the entire path. Deterministic tractography is well known to not deal well with complex streamline architectures but is computationally simple whereas probabilistic approaches are considered more robust but are computationally intensive. Further confounding these issues generating and evaluating white matter tracts can be a subjective, labor intensive, process that is vulnerable to low inter-rater reliability. With the advent of large, consortia-based neuroimaging datasets the need for less labor intensive and more reproducible tractography has become even more acute. Here we use the recently developed Automated Fiber Quantification (AFQ) algorithm and a large sample of subjects with high quality longitudinal diffusion data to evaluate the ability of deterministic and probabilistic tractography models to reproduce tracts within single subjects over multiple time points.2Methods
The Adolescent Brain Cognitive Development (ABCD) Study is a longitudinal study of over 11,000 US adolescents aged 10-11 years at enrollment, for whom DWI is currently available for baseline and a 2-year follow-up imaging. After standardized QC and preprocessing, diffusion weighted images for 1000 subjects at both baseline and 2-year follow-up were processed with Automated Fiber Quantification to extract individual subject White Matter (WM) fiber bundles for 18 major WM tracts, using either deterministic or probabilistic tractography. As a deterministic model AFQ uses Diffusion Kurtosis Imaging(DKI) and uses Constrained Spherical Deconvolution as it’s probabilistic model. After extracting the tract core, AFQ computes white matter microstructural features (such as fractional anisotropy (FA)) at 100 equally spaced nodes along the length of each tract, resulting in individual feature profiles for each tract (Figure 1). Two metrics were used to evaluate the within subject consistency of tracts extracted at timepoints 1 and 2: First, the extent of spatial overlap between tracts was quantified using DICE scores (Figure 2); Second, the correlation between FA values at corresponding tract nodes was quantified using Pearson correlation(R). One-way ANOVA was used to evaluate consistency of deterministic vs. probabilistic tractography results between successive time points at the population level.Results
As evident from the example tract profiles in Figure 3, FA values can vary considerably along the length of an individual tract, confirming the importance of analyzing tract metrics like FA at a spatial scale that can account for this variability. Using one-way ANOVA to compare tract profiles extracted from individual subjects between successive 2-year scans we found highly significant differences in the reliability of repeated measures between deterministic and probabilistic tractography. Specifically, mean (median) tract DICE scores were 0.586 (0.637) for the deterministic model and 0.788 (0.829) for probabilistic model (F=9851, pval<0.001); mean (median) correlation coefficients for FA along tract cores were 0.619 (0.748) for the deterministic model and 0.802 (0.912) for the probabilistic model (F=3344, pval<0.001). Visually, the difference in performance between probabilistic and deterministic models can be seen in Figure 5.Discussion
We evaluated the ability of probabilistic vs deterministic tractography to reliably reproduce global spatial and local feature profiles of 18 white matter tracts across imaging time points in 1000 children imaged serially with identical protocols at a 2-year interval. We show that the probabilistic algorithm yielded significantly higher within subject correspondence between tract spatial (DICE scores) and feature (FA correlation) profiles at the two time points. Data from large longitudinal imaging consortia such as ABCD have the potential to define the normative evolution of white matter tracts during development and to investigate the impact of various neurobehavioral and neuropsychiatric phenotypes on those developmental trajectories. This work is an early attempt to define robust and reproducible tractography methods needed to address these important questions.Conclusion
This early result from the development of an automated tractography QC pipeline using AFQ shows the superiority of a probabilistic approach to creating reproducible tract profiles for individual subjects over time. It also highlights the need to develop more robust automated tractography pipelines for use in large population-based neuroimaging studies.Acknowledgements
NoneReferences
1. Yeatman, J. D., Dougherty, R. F., Myall, N. J., Wandell, B. A., & Feldman, H. M. (2012). Tract Profiles of White Matter Properties: Automating Fiber-Tract Quantification. PLOS ONE, 7(11), e49790. https://doi.org/10.1371/journal.pone.0049790
2. Jones, D. K. (2008). Studying connections in the living human brain with diffusion MRI. Cortex, 44(8), 936–952. https://doi.org/10.1016/j.cortex.2008.05.002
Figures
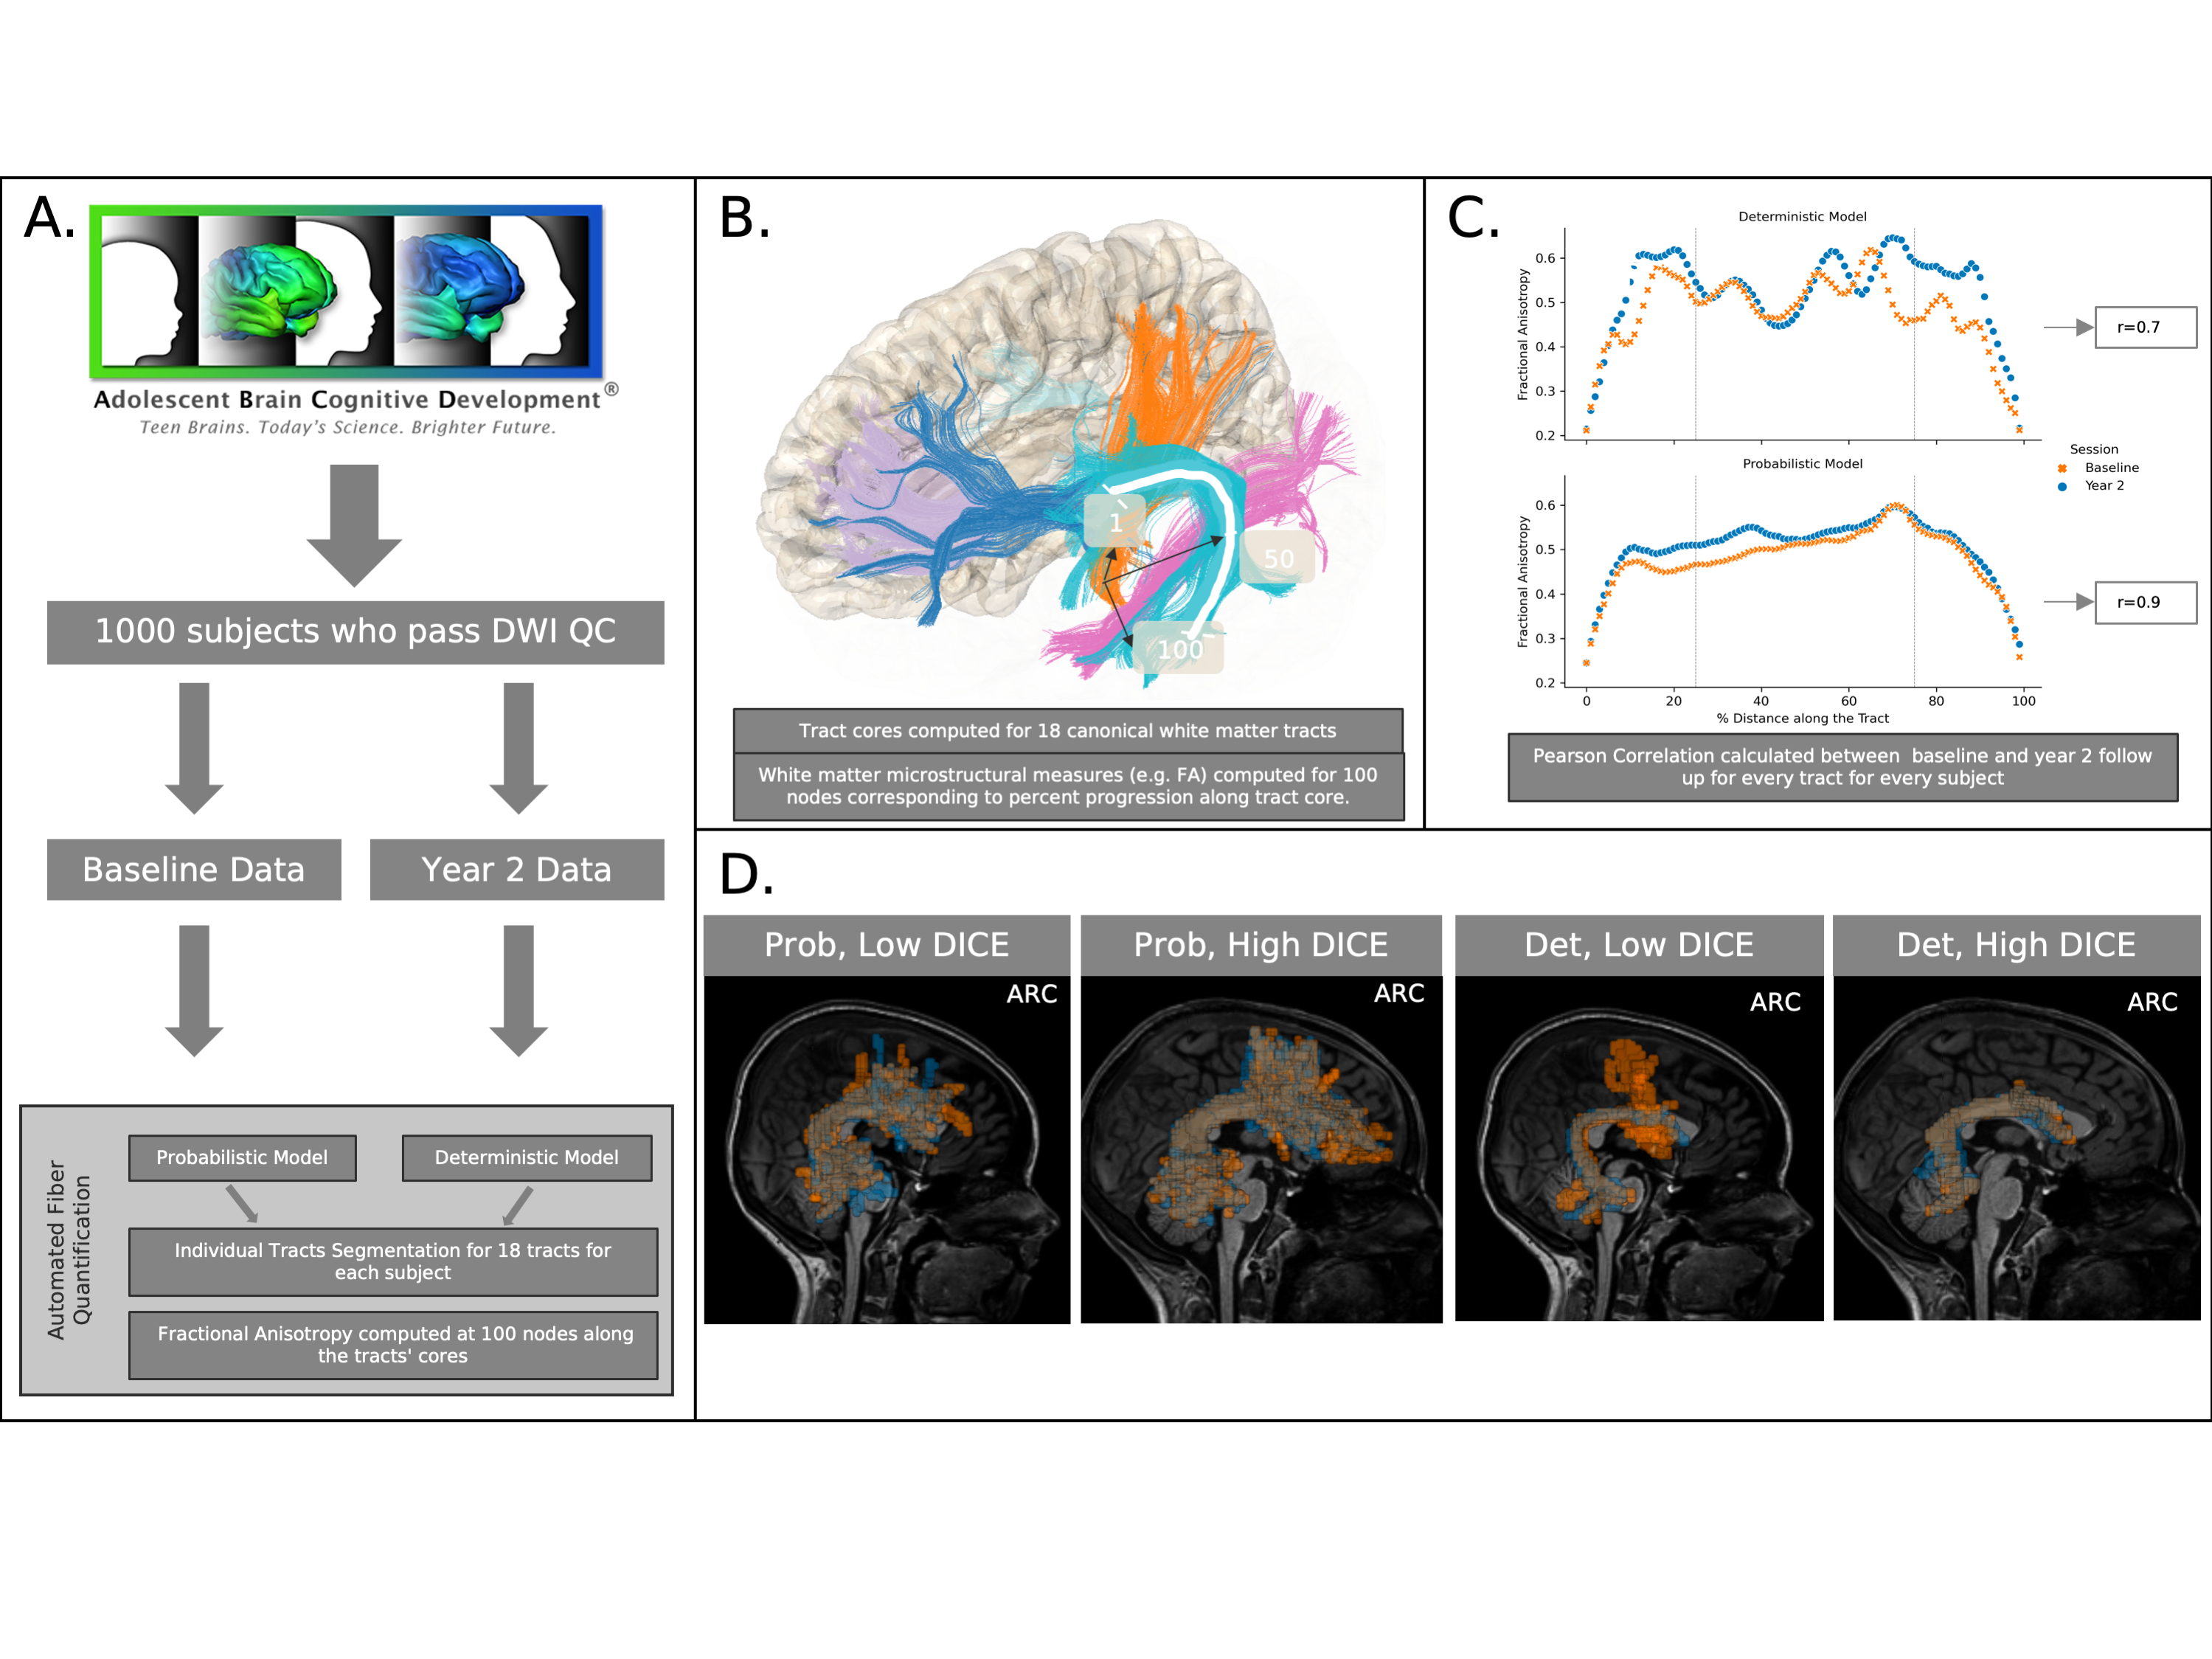
Figure 1: Tract generation pipeline and example outputs. A. Schematic outline of analysis methods. B. Example of tract streamline outputs and of a representative tract core (white curve) along which FA measurements are estimated. C. Example baseline and year-2 FA tract profiles for single subject-tract computed using either det (top) or prob (bottom) models with accompanying Pearson correlation (r). D. Volumetric spatial tract profiles according to extraction model and DICE performance.
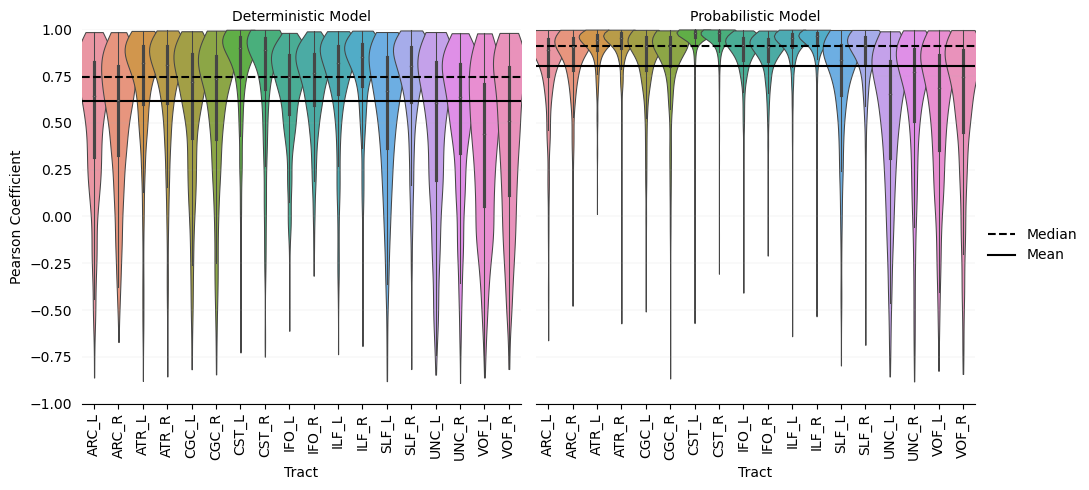
Figure 2: Violin Plots of Pearson correlation between tract FA profiles for baseline and year 2 imaging computed for 18 canonical WM tracts using either the deterministic or probabilistic model. ARC = Arcuate Fasciculus. ATR = Anterior Thalamic Radiation. CGC = Cingulum Bundle. CST = Cortico-spinal Tract. IFO = Inferior Fronto-occipital Fasciculus. ILF = Inferior Longitudinal Fasciculus. SLF = Superior Longitudinal Fasciculus. UNC = Uncinate Fasciculus. VOF = Vertical Occipital Fasciculus. *_L indicates Left Hemisphere, *_R Right Hemisphere.
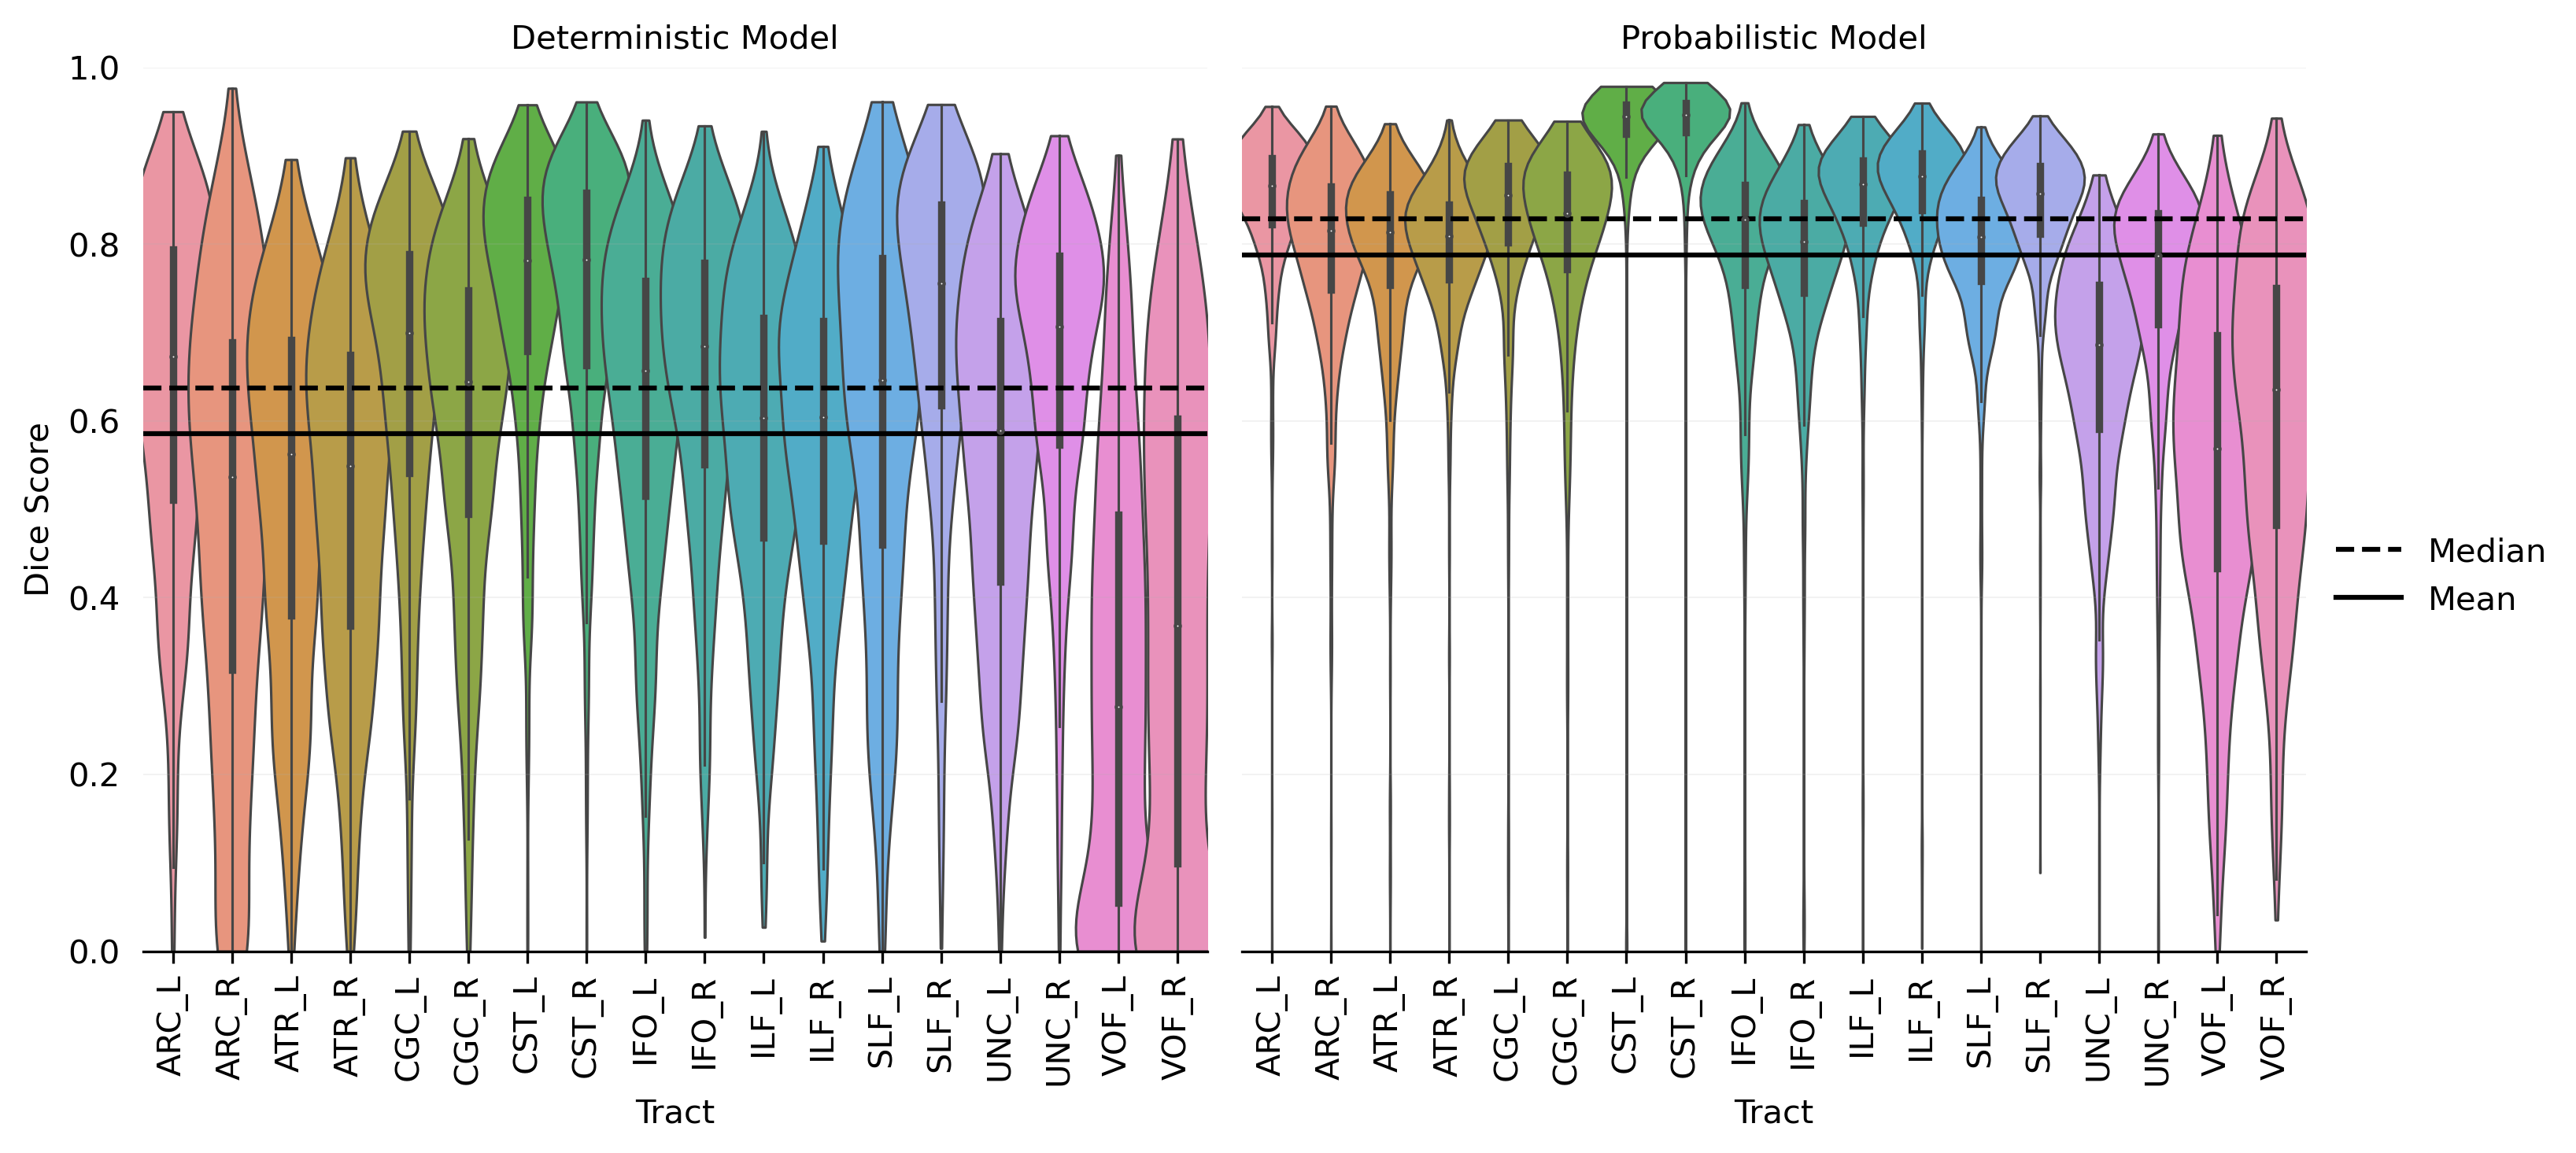
Figure 3: Violin Plots of Dice Scores quantifying overlap between tract spatial profiles for baseline and year 2 imaging for 18 canonical WM tracts using either the deterministic or probabilistic model.
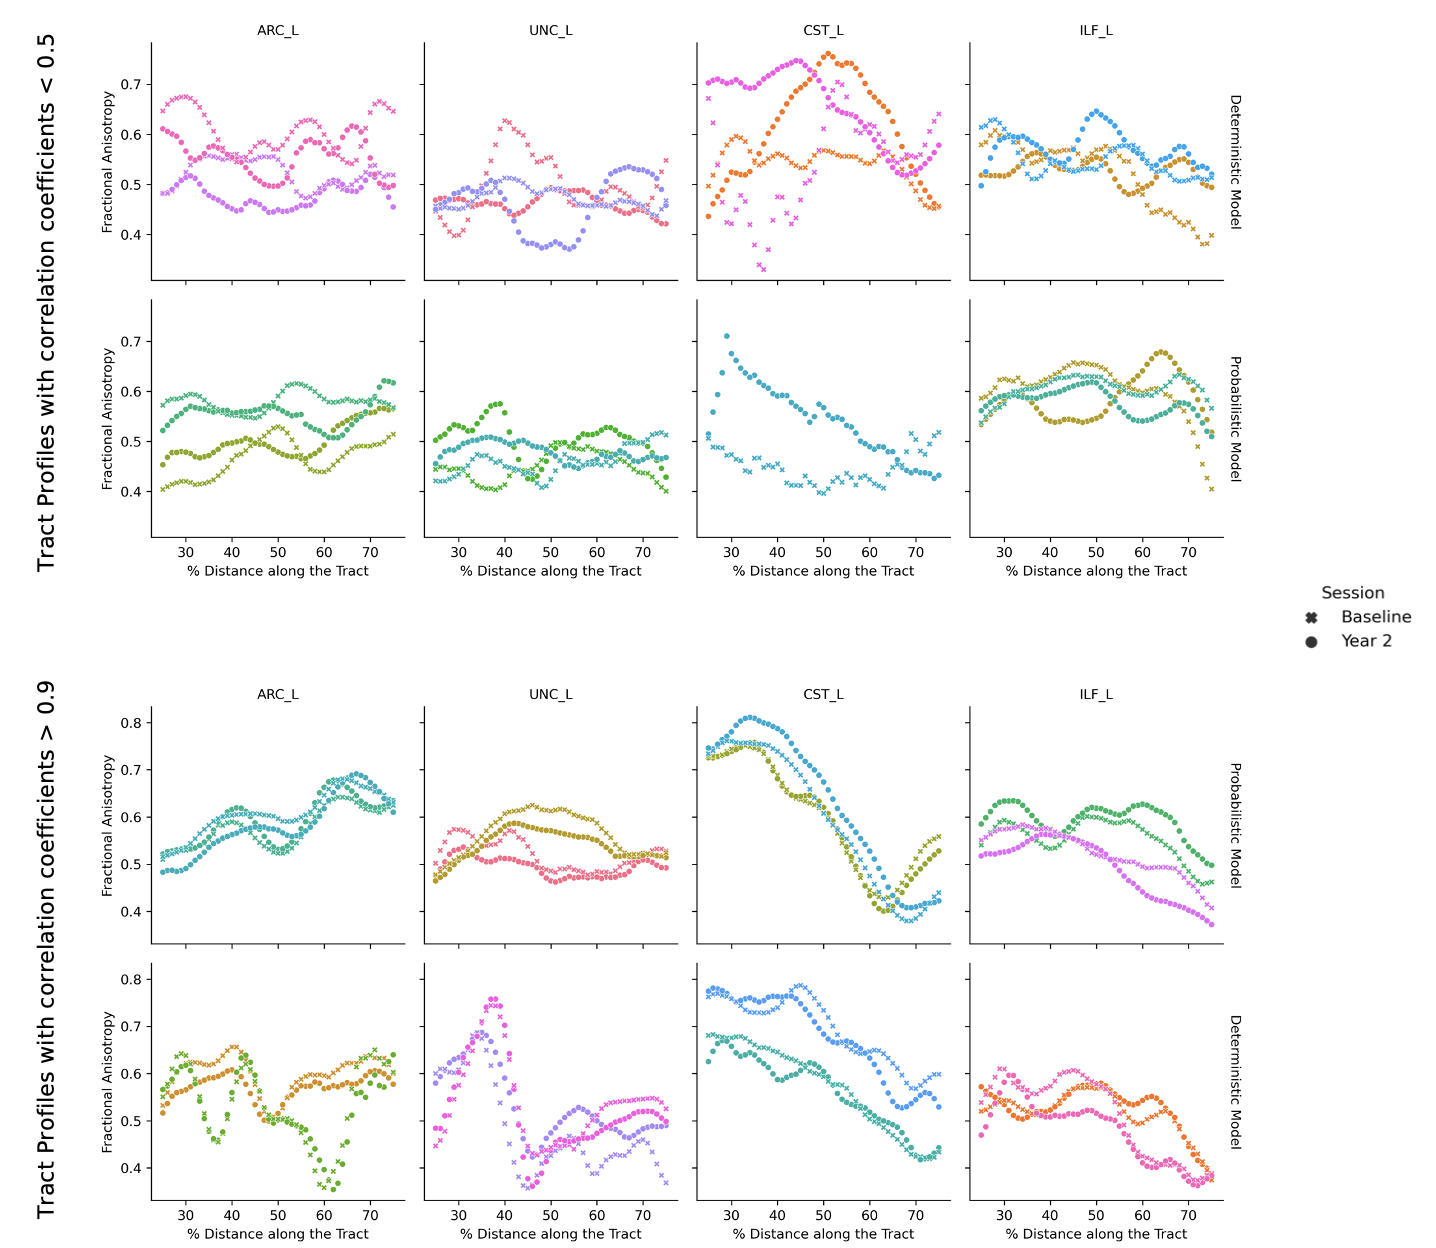
Figure 4: Examples of baseline and year-2 tract FA profiles for a random sample of individual subjects representing (top two rows) profiles whose Pearson correlation were less than 0.5, and (bottom two rows) profiles whose coefficients were greater than 0.9. Each color represents a single subject/tract, with crosses representing values at baseline imaging and disks values for the same tract for year-2 imaging. First and fourth rows show results from the deterministic model, while second and third rows show results from the probabilistic model.
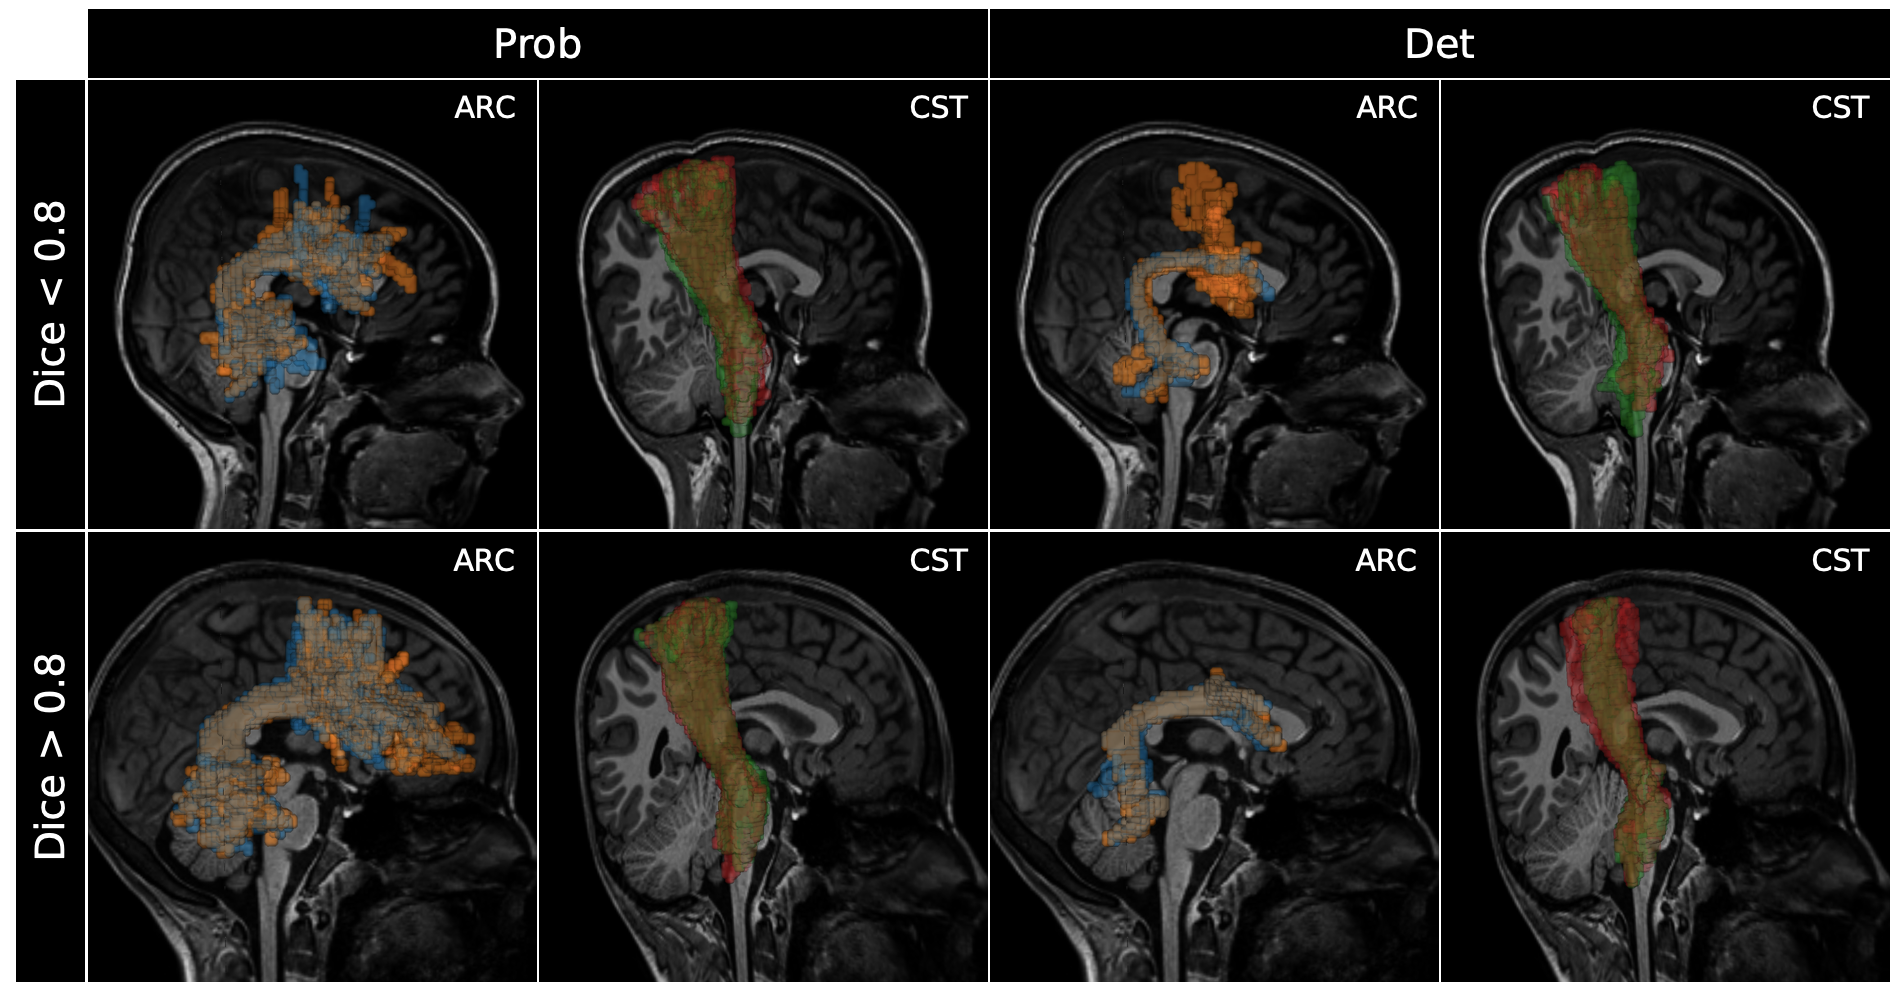
Figure 5: Examples of tract segmentations for a random subject representing (top row) segmentations whose Dice scores were less than 0.8, and (bottom row) Dice scores greater than 0.8. Different colors in each image highlight the results for a single tract at each of the two time points. Probabilistic and deterministic model results are displayed for segmentations with good (Dice > 0.8) and poor (Dice < 0.8) overlap between baseline and year-2 imaging.