0224
Hippocampal-cortical connections with high-resolution ex vivo and in vivo diffusion MRI of human brain at 7T1Department of Biomedical Engineering, Zhejiang University, HangZhou, China, 2China Brain Bank and Department of Neurology in Second Affiliated Hospital, Zhejiang University, HangZhou, China, 3Department of Pathology, The First Affiliated Hospital and School of Medicine, Zhejiang University, HangZhou, China
Synopsis
Keywords: Brain Connectivity, Diffusion/other diffusion imaging techniques, Ex-vivo, hippocampus, structure connectivity
Hippocampus is a critical brain structure associated with many brain functions. The connectivity between hippocampal sub-regions and cerebral cortex hasn’t been fully characterized, and spatial resolution is the key to resolve such connectivity. We utilized 3D high-resolution ex vivo diffusion MRI (dMRI) at 7T to investigate the structure connectivity between hippocampal sub-regions and cortex and compared the results with in vivo data. We found that different sub-regions demonstrated unique fiber projections to cortex, and the high-resolution ex-vivo dMRI resulted in more connections with temporal-occipital lobe and less connections to central gyrus and frontal lobe, compared to lower-resolution in vivo dMRI.Introduction
Hippocampus is a critical brain structure associated with many funcitons. Hippocampal-cortical connections play important roles in reflecting aging process(1), memory(2), navigation(3), and different sub-regions of the hippocampus, such as CA1, CA3, dentate gyrus (DG), take different functional roles and may be connected with different areas of the cortex(4-8). Investigation of the subregional connectivity requires high-resolution and thereby is challenging with in vivo data. A previous study(6) reported hippocampal-cortical connectivity pattern with in vivo diffusion MRI (dMRI) based on 1.05 mm resolution Human Connectome Project (HCP)(9) data without further validations. Here, we performed 3D high-resolution dMRI of ex vivo human brain at 7T and quantified the projections from hippocampal subregions to the cortex. We compared results from the original high-resolution and downsampled lower-resolution data, and also compared the ex vivo data with in vivo data from HCP that were also acquired at 7T.Methods
Data acquisition: For the ex-vivo data, brain samples were collected from three normal subjects (right hemispheres, aged between 54-64 years old, males). dMRI data were acquired at a 7T Siemens MAGNETOM scanner using a 3D diffusion-weighted steady state free precession (DW-SSFP) sequence with the following parameters: TR/TE = 29/21 ms, resolution = 0.8*0.8*0.8 mm³, FOV = 180*113*82 mm³, 10 b0 + 60 b6000 s/mm.For in-vivo data, we selected 11 healthy adults (aged between 26-35 years old) from HCP database (https://www.humanconnectome.org/), which were scanned on a 7T Siemens system, with a 2D DW-EPI sequence at TR/TE = 7000/71.2 ms, resolution = 1.05*1.05*1.05 mm³, FOV = 182*218*182 mm³, 15 b0 + 64 b1000 s/mm² + 64 b2000 s/mm².
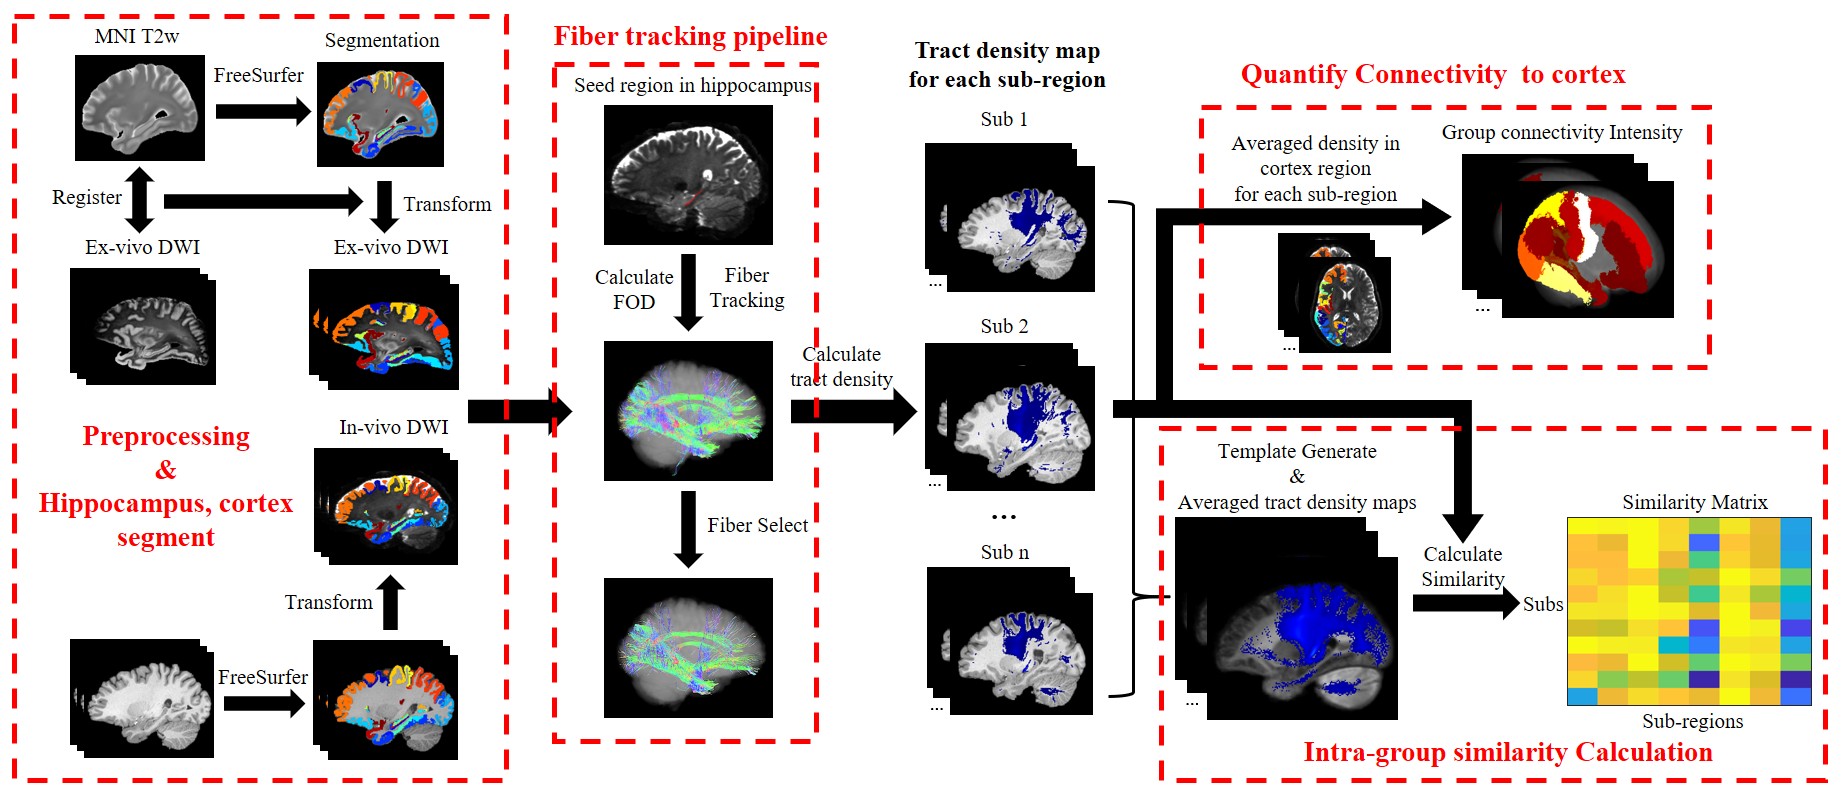
Data processing: The processing pipeline is shown in Figure 1. After preprocessing, for in-vivo data, we used FreeSurfer7(10) to obtain segmentation of cortex and hippocampus based on the T1w images and then transformed the segmentation to dMRI space. For ex-vivo data, we transformed the dMRI (half brain) to the MNI space by affine and nonlinear registration to obtain the segmentation. Downstram analysis was the same for in-vivo and ex-vivo datasets. Probabilistic fiber tracking was performed with the iFOD2 algorithm in MRtrix3(11), using eight hippocampal sub-regions as seeds, including presubiculum, subiculum, CA1, CA3, CA4, granule cell-molecular layer–dentate gyrus (GC-ML-DG), molecular layer (ML) and hippocampal tail (HT) and cortex as target region.
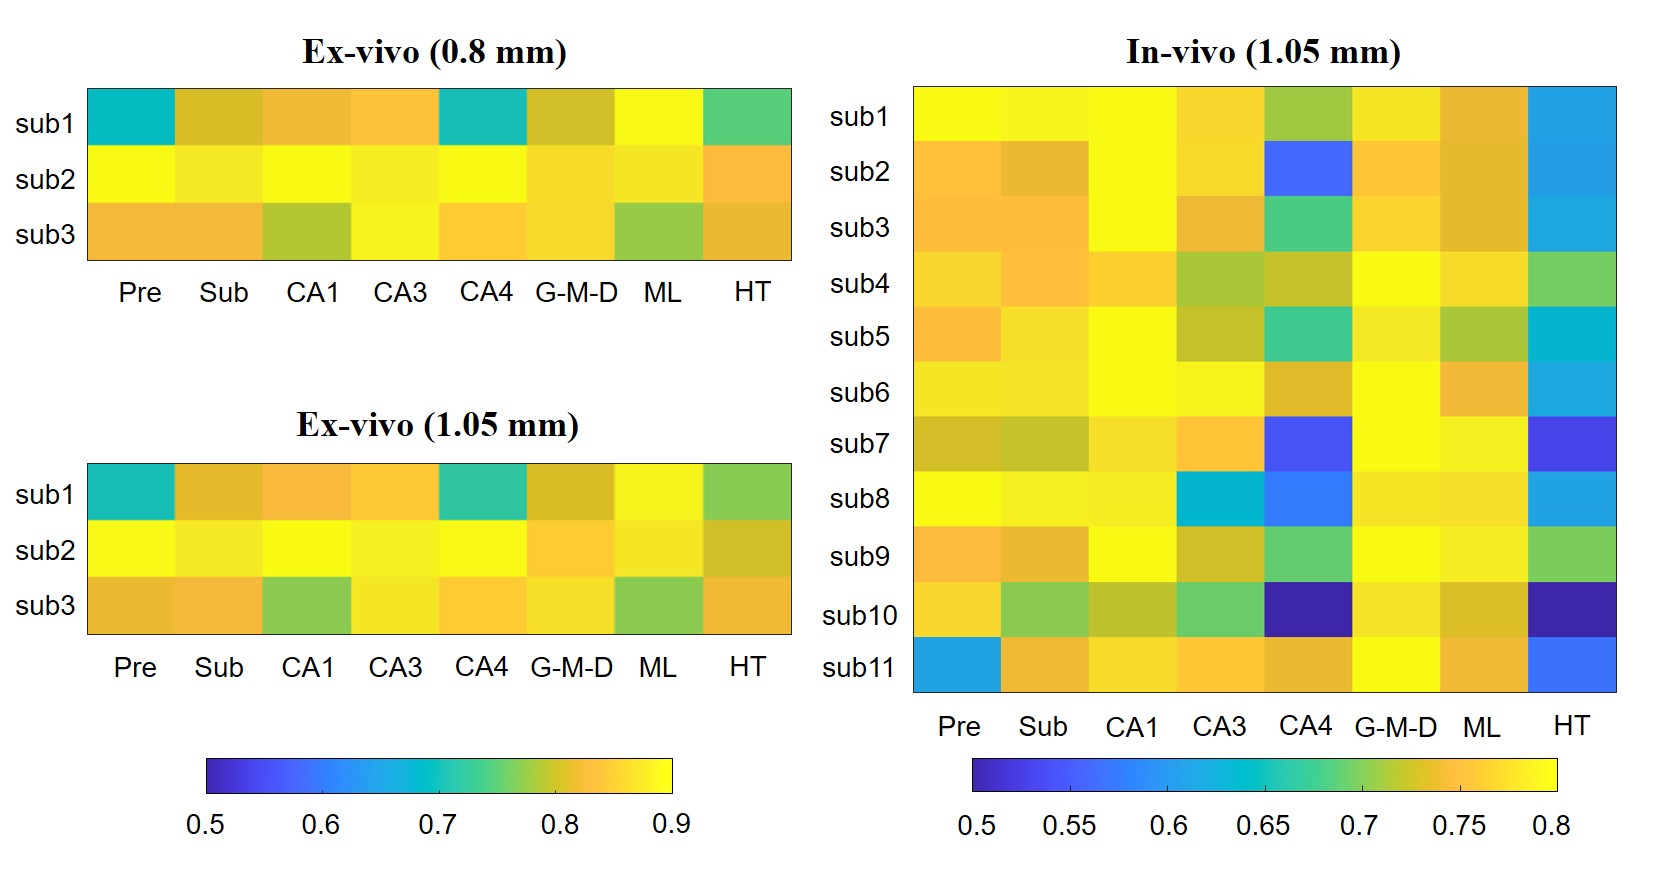
To quantifiy the hippocampal-cortical projection profiles, we calculated the sum of tract density from each hippocample subregtion to the cortex parcels, which was averaged over all subjects. In order to evaluate the reproducibility of the subregion-specific fiber tracking, a template image was generated from all subjects using MRtrix3 and ANTS(12), and individual tract density maps were compared with the template image based on the similarity between two images.
Results
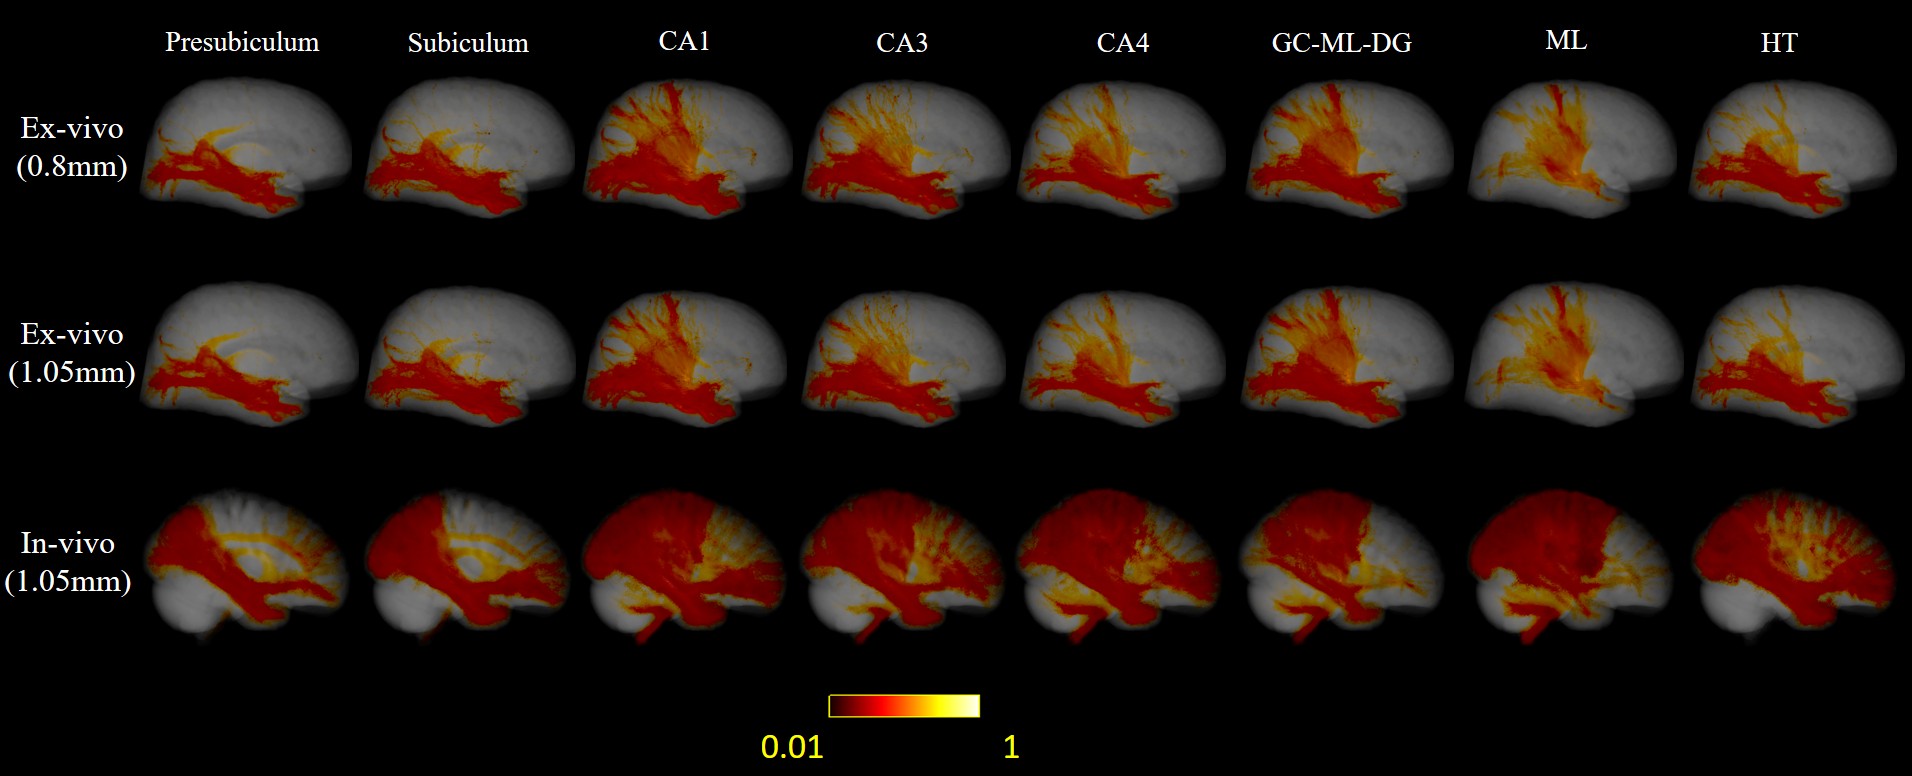
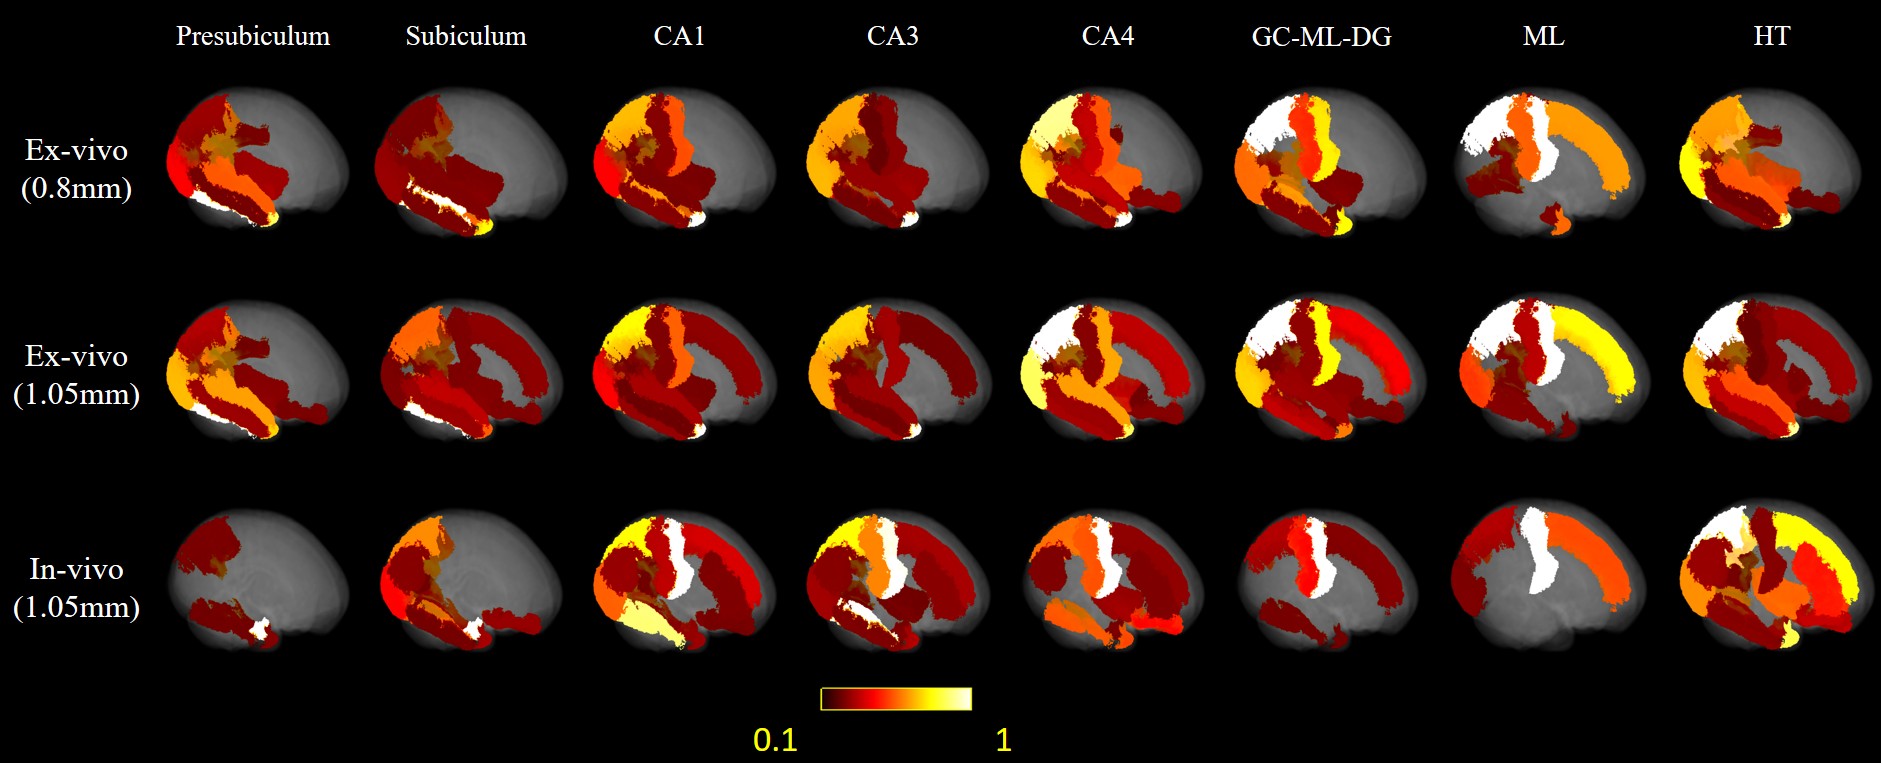
Here we downsampled the 0.8mm isotropic ex-vivo images to 1.05 mm isotropic, so that we could compared ex vivo tracktography at different resolutions and ex vivo and in vivo data at matched resolution. Only the right hemisphere of in-vivo brain was used to match the ex-vivo sample. Probabilistic tract density maps with seeds in each hippocample sub-region were shown for the ex vivo and in vivo data at different resolutions in Figure 2. Distinct hippocample cortical projection patterns can be found. For presublicum, subiculum and HT, tracts mainly were connected temporal and occipital lobe, while the other sub-regions also projected to the medial-posterior parietal lobe. Reduction of resolution by downsampling led to a reduction of parietal projections comparing the 0.8mm and 1.05mm ex vivo results. The in vivo tractography showed much denser connection with the frontal lobe and medial parietal lobe.The mean projection intensity maps in Figure 3 demonstrated similar findings. The 1.05 mm ex-vivo data showed more connection with superior frontal lobe and central gyrus than the 0.8mm data, indicating possible false positives to these cortical regions due to insufficient resolution. The in-vivo data at the same resolution showed similar projection patterns with the 1.05 mm ex viov data, but even less projection to temporal-occipital lobe and more connections with the central gyrus in partial lobe.
The similarity matrix in Figure 4 showed the reproducibility between subjects wass generally high (>0.7) for both ex vivo and in vivo data, except for CA4 and HT in in-vivo group.
Discussion and Conclusion
In this study, we used both ex-vivo and in-vivo dMRI to characterize the structure connectivity between hippocampal sub-regions and cortex. Results revealed that: (1) the hippocampal sub-regions had unique connectivity patterns with cortex. (2) compared to lower resolution in vivo data, high resolution ex-vivo dMRI pointed to denser connctions between hippocampus and temporal-occipital lobe, which is associated with memory(13) and visual functiuons, and less connections with central gyrus, which was agree with previous study(14). The difference in connectivity pattern may be associated with the resolution difference, acquisition protocol, sample preparation, as well as biological differences before and after fixation.Acknowledgements
This work was supported by the Ministry of Science and Technology of the People’s Republic of China (2018YFE0114600), the National Natural Science Foundation of China (61801424, 81971606, 82122032, 2021ZD0200202), and the Science and Technology Department of Zhejiang Province (202006140, 2022C03057).References
1.Elsaid NMH, Coupe P, Saykin AJ, Wu YC. Structural connectivity mapping in human hippocampal-subfields using super-resolution hybrid diffusion imaging: a feasibility study. Neuroradiology. 2022;64(10):1989-2000.
2.Llufriu S, Rocca MA, Pagani E, Riccitelli GC, Solana E, Colombo B, et al. Hippocampal-related memory network in multiple sclerosis: A structural connectivity analysis. Mult Scler. 2019;25(6):801-10.
3.Rolls ET. Hippocampal spatial view cells for memory and navigation, and their underlying connectivity in humans. Hippocampus. 2022.
4.Deuker L, Doeller CF, Fell J, Axmacher N. Human neuroimaging studies on the hippocampal CA3 region - integrating evidence for pattern separation and completion. Front Cell Neurosci. 2014;8:64.
5. Dong H-W, Swanson LW, Chen L, Fanselow MS, Toga AWJPotNAoS. Genomic–anatomic evidence for distinct functional domains in hippocampal field CA1. 2009;106(28):11794-9.
6.Huang CC, Rolls ET, Hsu CH, Feng J, Lin CP. Extensive Cortical Connectivity of the Human Hippocampal Memory System: Beyond the "What" and "Where" Dual Stream Model. Cereb Cortex. 2021;31(10):4652-69.
7.Kesner RP. An analysis of dentate gyrus function (an update). Behav Brain Res. 2018;354:84-91.
8. Rockland KS, Van Hoesen GWJCC. Some temporal and parietal cortical connections converge in CA1 of the primate hippocampus. 1999;9(3):232-7.
9.Van Essen DC, Ugurbil K, Auerbach E, Barch D, Behrens TE, Bucholz R, et al. The Human Connectome Project: a data acquisition perspective. Neuroimage. 2012;62(4):2222-31.
10.Fischl B. FreeSurfer. Neuroimage. 2012;62(2):774-81.
11.Tournier JD, Smith R, Raffelt D, Tabbara R, Dhollander T, Pietsch M, et al. MRtrix3: A fast, flexible and open software framework for medical image processing and visualisation. Neuroimage. 2019;202:116137.
12. Avants BB, Tustison N, Song GJIj. Advanced normalization tools (ANTS). 2009;2(365):1-35.
13.Opitz B. Memory function and the hippocampus. Front Neurol Neurosci. 2014;34:51-9.
14.Maller JJ, Welton T, Middione M, Callaghan FM, Rosenfeld JV, Grieve SM. Revealing the Hippocampal Connectome through Super-Resolution 1150-Direction Diffusion MRI. Sci Rep. 2019;9(1):2418.
Figures