0223
Investigating the endfolial pathway of the human hippocampus using ex vivo dMRI at high spatio-angular resolution1Department of Radiology and Radiological Science, Johns Hopkins University, Baltimore, MD, United States
Synopsis
Keywords: Brain Connectivity, Tractography & Fibre Modelling, Hippocampus internal circuitry; probabilistic tractography.
The endfolial pathway is a collection of fibers within the hilus of the human hippocampus that forms part of the complex intra-hippocampal circuitry. We investigate this pathway using high-field (11.7 T), high spatio-angular resolution diffusion MRI (dMRI) of 3 intact, excised hippocampi. Using probabilistic tractography and computational unfolding of the hippocampal strata, we demonstrate a unique sensitivity of dMRI to the 3D trajectory of the intra-hippocampal fibers.
Keywords: Ex vivo high spatio-angular resolution diffusion MRI; hippocampus internal circuitry; probabilistic tractography.
Introduction
Although the hippocampus is a well-studied part of the medial temporal lobe1, some elements of its complex internal circuitry are not fully understood. One such feature is the endfolial pathway, a collection of short-range myelinated axons from pyramidal neurons within the hilus of dentate gyrus (DG).2 Since this pathway is thought to be specific to humans and other primates, it is an intriguing target for research, but has only been investigated in a few previous studies using polarized-light microscopy (PLM) and high-field structural MRI.3,4 In this work, we investigate the endfolial pathway using ex vivo diffusion MRI (dMRI) at high spatio-angular resolution, probabilistic tractography, and computational unfolding of hippocampal strata, demonstrating exquisite sensitivity to its 3D trajectory.Methods
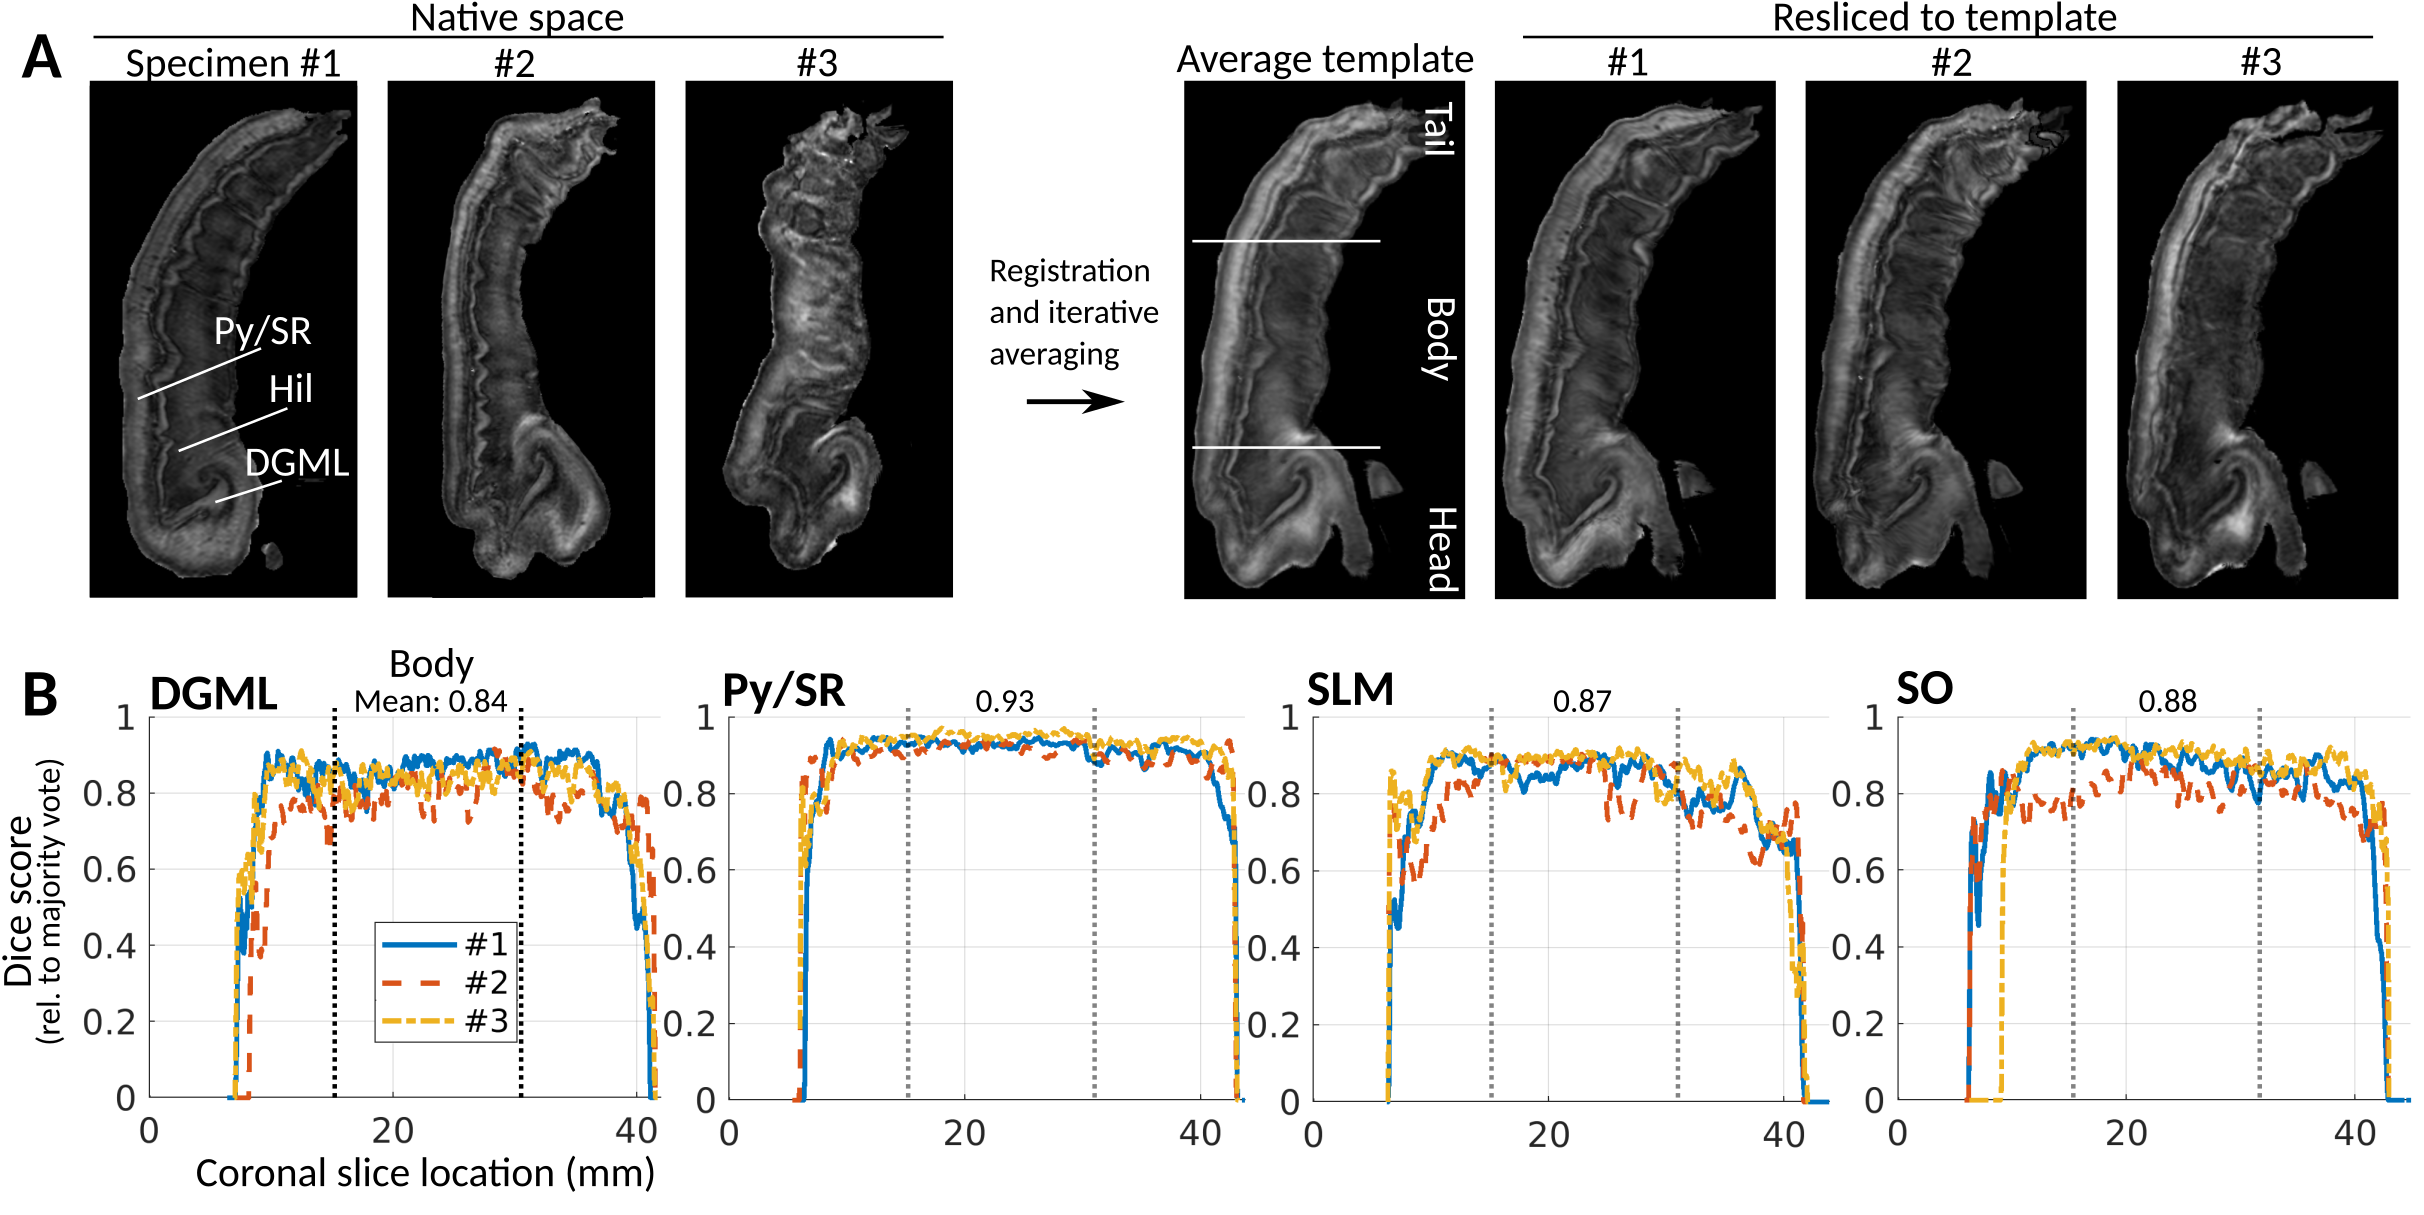
Analysis was performed on high-angular resolution dMRI datasets of adult human hippocampus specimens (n=3) acquired previously5 (30 directions, 0.16 mm isotropic resolution, b = 4000 s/mm2). Fractional anisotropy (FA) maps and fiber orientation distribution functions (FODs) were calculated from the signal attenuations in MRtrix36, the latter using constrained spherical deconvolution based on a single-fiber response function estimated from alvear white matter.7 The FODs were used to estimate FA-scaled directionally encoded colormaps (DECs)8, and to perform probabilistic tractography using the IFOD2 algorithm.9To simplify between-specimen comparison and enable population-averaged tractography, a common template was generated by iterative averaging, using the FA images along with manual layer delineations based on the FOD-DECs. MrTrix3 was used for warping and reorienting FODs to the template. Alignment of specimens to template was evaluated by Dice score overlaps between warped segmentations and a majority-voted segmentation.
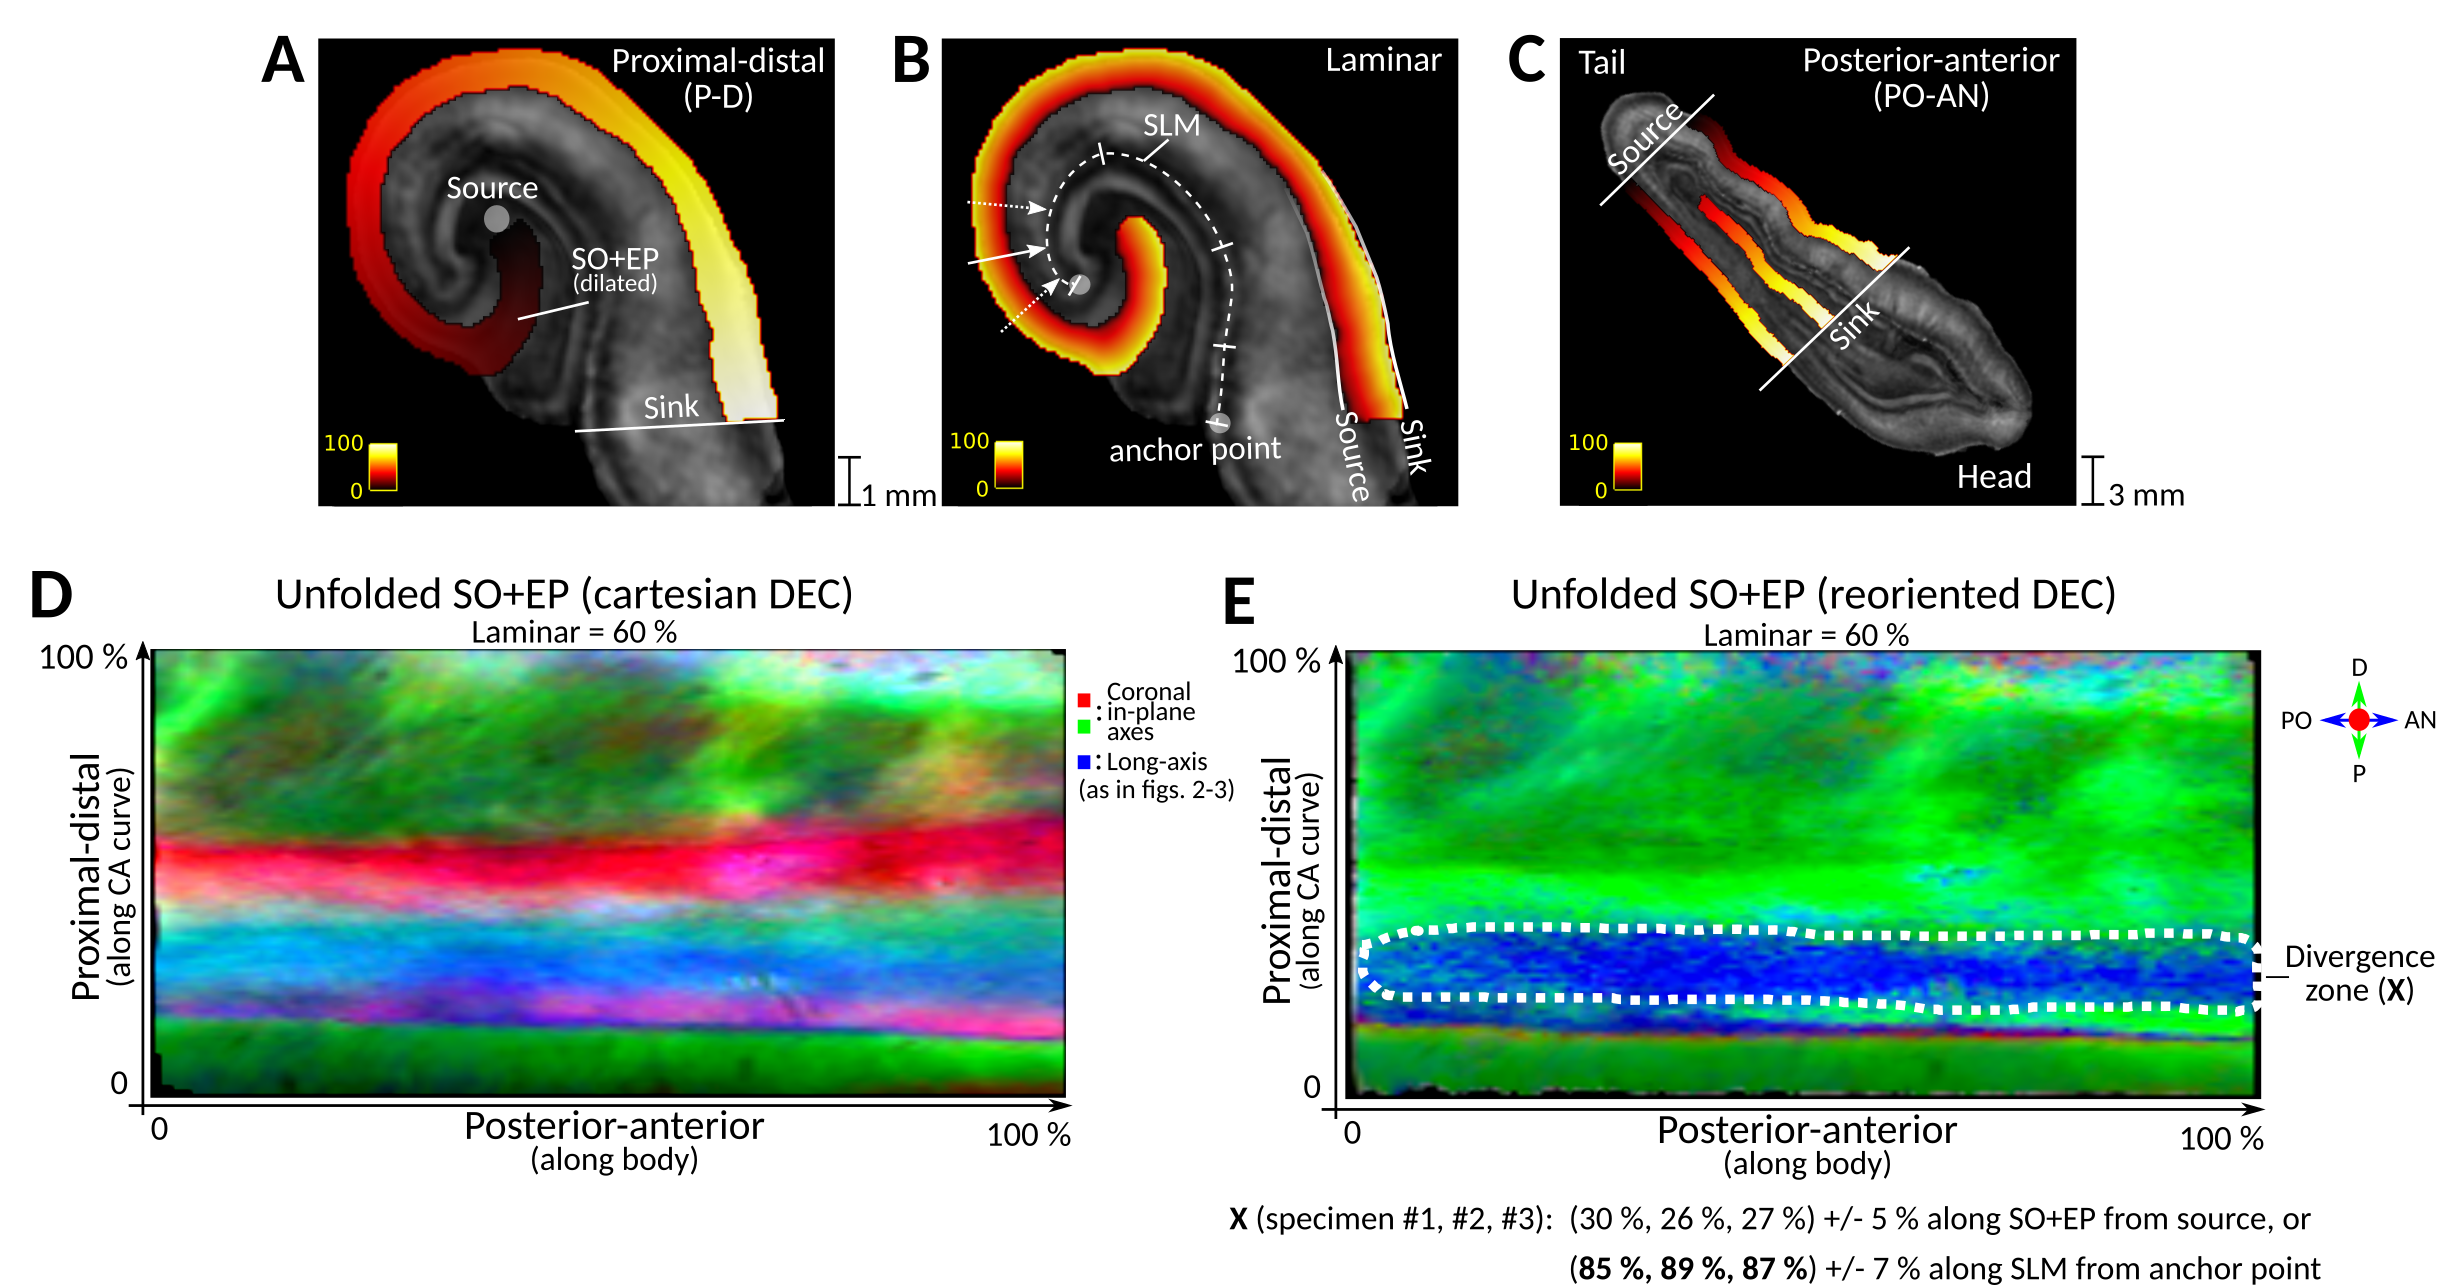
The proximal-distal (P-D) extent of the pathway along the curve of cornu ammonis (CA) was investigated by “unfolding” delineations of the stratum oriens and the endfolial pathway (SO+EP). This was achieved through numerical solution of Laplace’s equation 3 times with different boundary (source and sink) regions, as in ref. 10, resulting in 3 smoothly varying potential fields. These were used as posterior-anterior (PO-AN, tail-head), laminar, and P-D (hilus-subiculum) spatial coordinates. To reorient the cartesian-space FOD-DECs to the unfolded space, segmented fixel11 direction vectors in each voxel were expressed in Laplacian coordinates by projecting onto the potential field gradients. Red-Green-Blue triplet values were calculated as the weighted average over fixel projections, with fixel integral (apparent fiber density) as weights.
Results
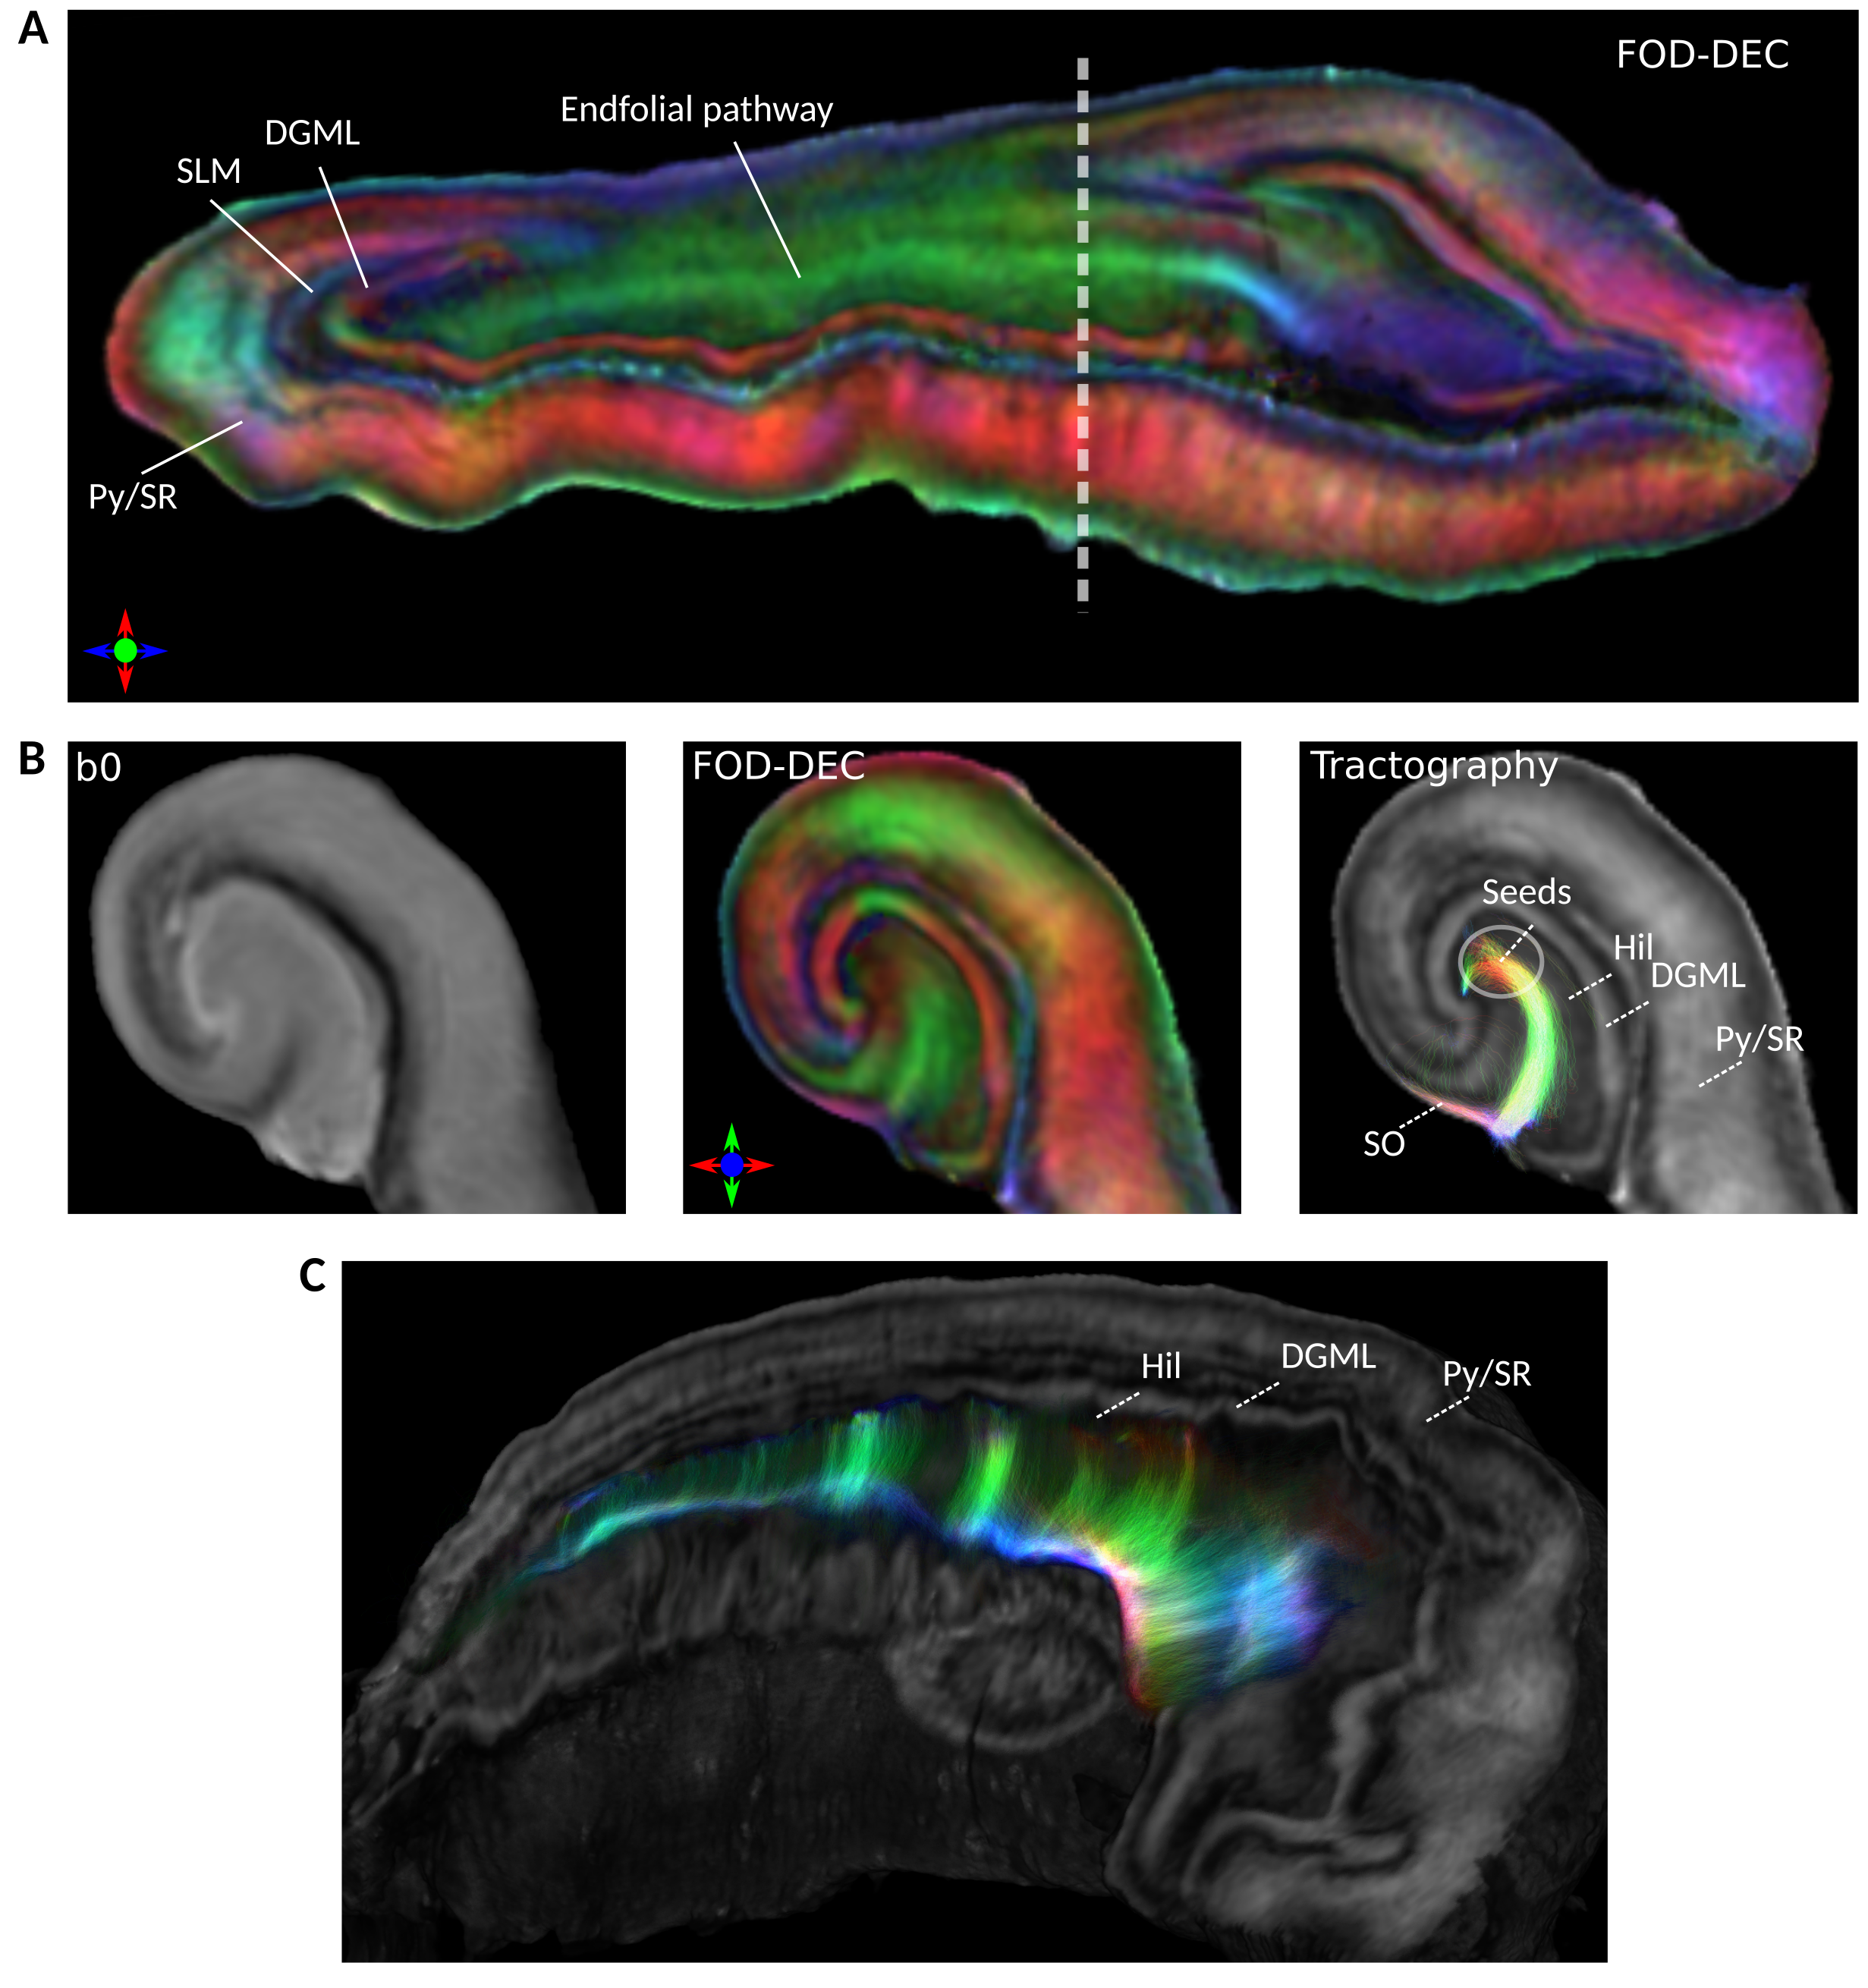
Fig 1A shows FA images in native and template space. As seen from visual inspection in fig. 1A and the Dice scores in fig. 1B, template alignment was decreased in the extreme tail and head regions; we therefore restricted numerical analysis to the indicated “body” region.Fig. 2A shows the FA-scaled FOD-DEC of the average template in a long-axis view. The pyramidal layer and the stratum radiatum (Py/SR) of CA and the DG molecular layer (DGML), separated by the stratum lacunosum-moleculare (SLM), are indicated as regions with consistent radial orientations.14 The hilus was dominated by tangential FOD components, with the endfolial pathway in a high-FA band. As illustrated by the population-averaged tractography (fig. 2B), endfolial tracts seeded in the upper hilus followed the curve of CA into the SO. The 3D cutout view in fig. 2C shows the curve of the pathway along the hippocampus.
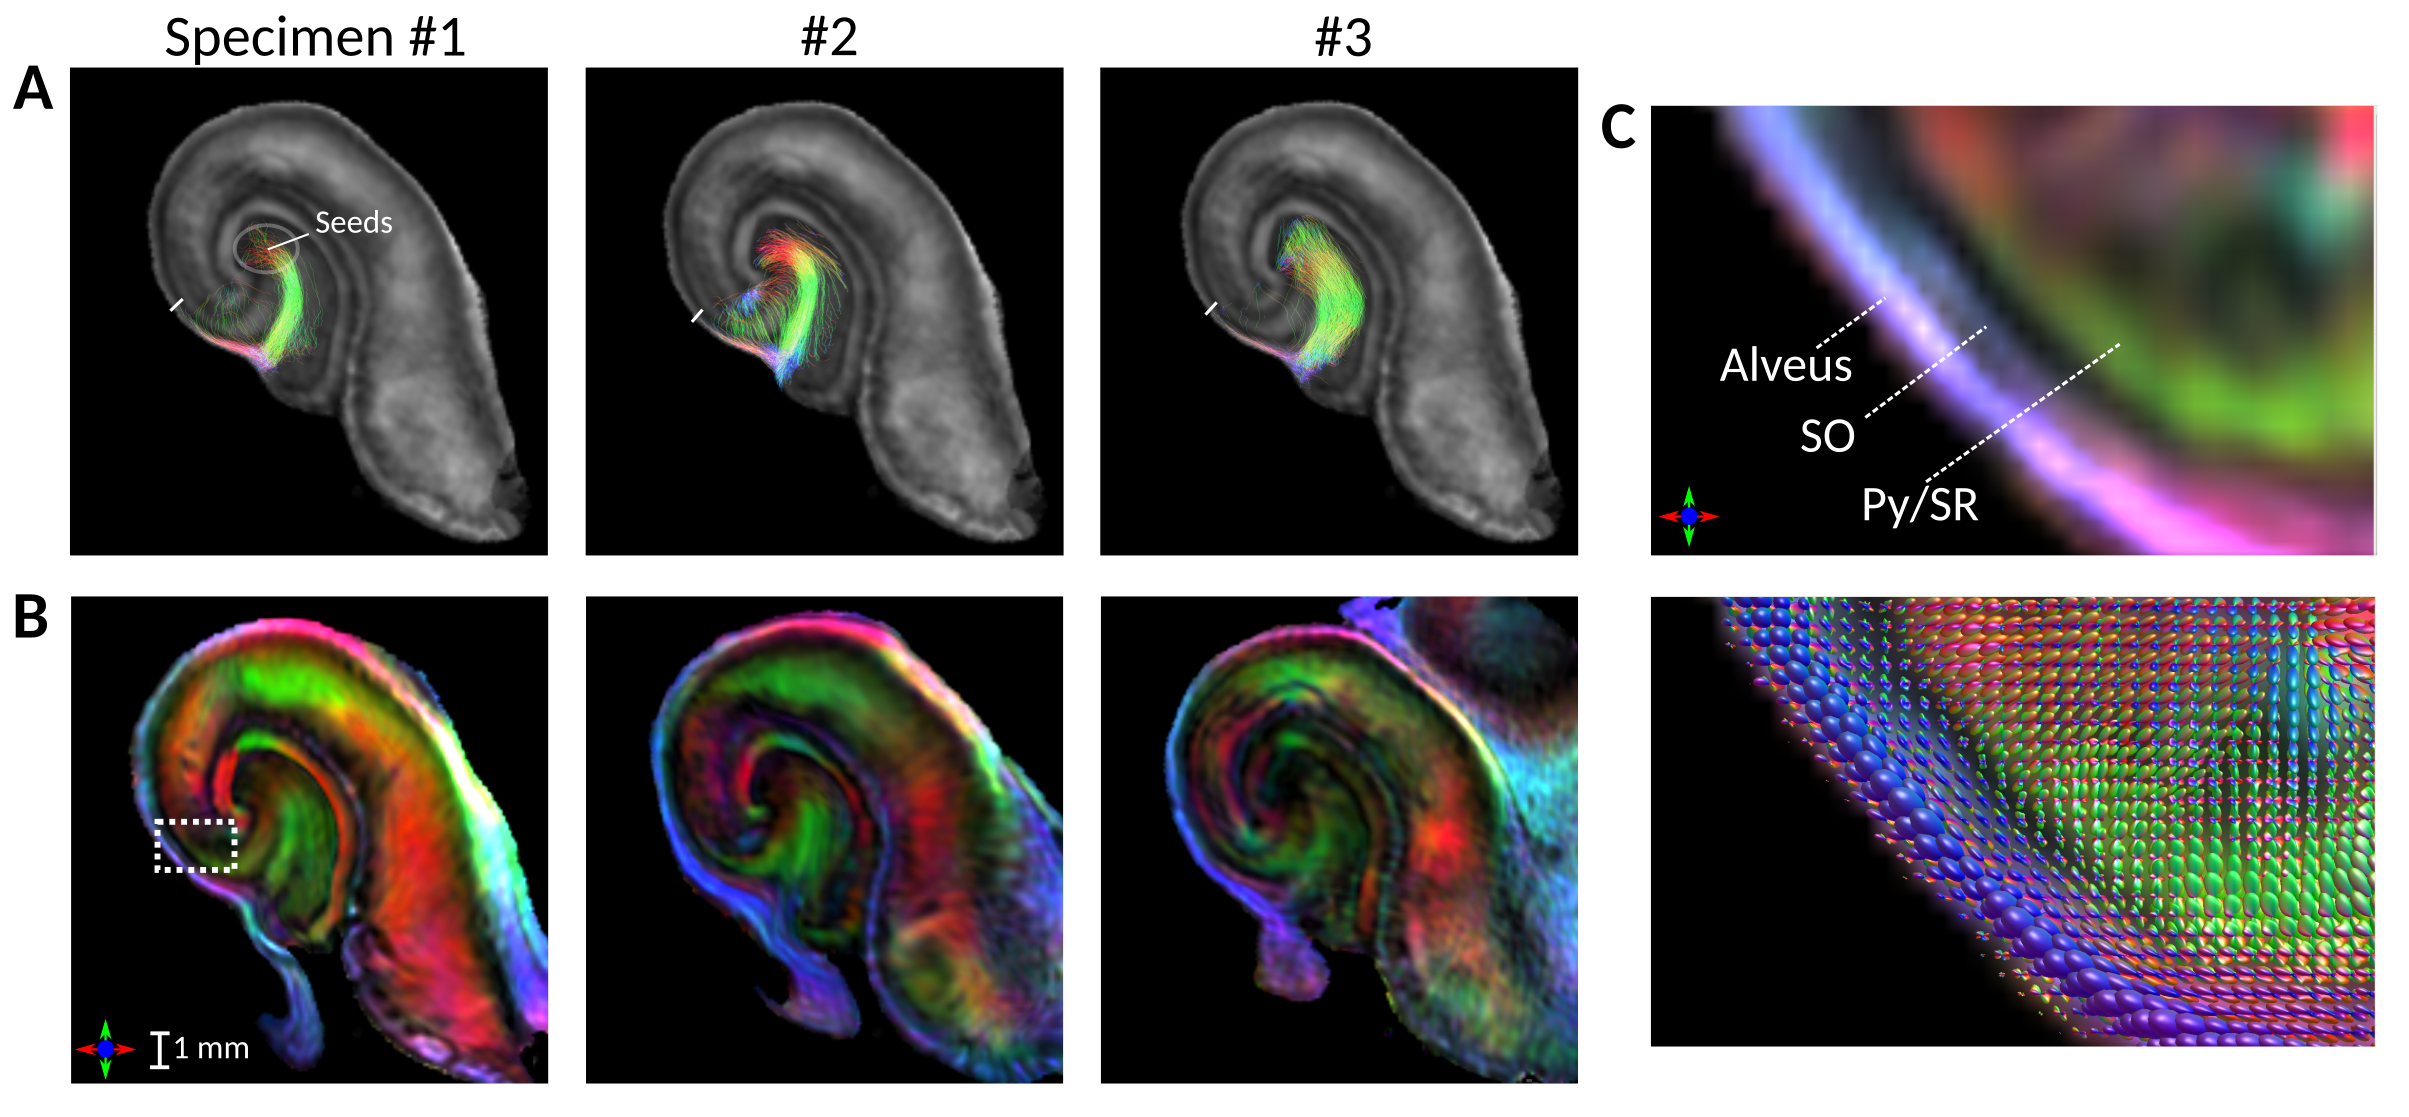
Between-specimen variations in tractography and FOD-DECs are shown in figs. 3A-B, resliced to template space. The tracts followed a similar trajectory for all specimens and extended comparable distances into the SO, where some terminated from encountering low FOD amplitude and others moved out of plane (longitudinally). As shown in fig. 3C, this occurred in a “divergence zone” containing dominant longitudinal FOD components.
To investigate this divergence zone where the tracts bent longitudinally, we unfolded the SO+EP regions into the Laplacian coordinate space shown in fig. 4A-C. Figs. 4D-E show unfolded DECs, with color triplets respectively in cartesian space (as in figs 2-3) and reoriented to encode FOD orientations in the Laplacian coordinate system; after reorientation, the divergence zone could be clearly identified by pronounced PO-AN components among predominant P-D orientations. Measuring its location in the native unfolded space of each specimen and projecting onto the SLM (fig. 4B, arrows) led to center locations of 85-89% (indicated by X in Fig. 4D). These locations are consistent with the divergence of the endfolial pathway into a longitudinal (PO-AN) trajectory near the CA2/3 subfield boundary, which has been reported in literature.2,4,16
Conclusion
High spatio-angular resolution ex vivo dMRI revealed a 3D sensitivity to the endfolial pathway via FOD-DECs and probabilistic tractography. Our results indicate a trajectory of the endfolial pathway from the upper hilus into the SO, reproducible over the three specimens and consistent with literature.2,4 Previous studies have used structural-MRI contrasts based on myelination to examine the pathway.3 Although further validation is required, our results show that while parts of the pathway displayed a pronounced decrease in b0 (structural-MRI) intensity (fig. 2B), dMRI sensitivity to fiber orientations at high spatio-angular resolution may allow for a clearer determination of the 3D trajectory of the intra-hippocampal fibers.Acknowledgements
This work was supported by National Institutes of Health grants R21NS096249 and R01AG057991References
1 Duvernoy, H. M., Cattin, F. & Risold, P. Y. The Human Hippocampus: Functional Anatomy, Vascularization and Serial Sections with MRI. (Springer Berlin Heidelberg, 2013).
2 Lim, C. et al. Connections of the hippocampal formation in humans: II. The endfolial fiber pathway. Journal of Comparative Neurology 385, 352-371, (1997).
3 Parekh, M. B., Rutt, B. K., Purcell, R., Chen, Y. & Zeineh, M. M. Ultra-high resolution in-vivo 7.0T structural imaging of the human hippocampus reveals the endfolial pathway. Neuroimage 112, 1-6, (2015).
4 Zeineh, M. M. et al. Direct Visualization and Mapping of the Spatial Course of Fiber Tracts at Microscopic Resolution in the Human Hippocampus. Cereb Cortex 27, 1779-1794, (2017).
5 Aggarwal, M., Sathyanarayan, P. & Nauen, D. Laminar microstructure and subfield connectivity of the human hippocampus revealed with ultra-high field diffusion MRI at 11.7T. Proc Intl Soc Mag Reson Med, p. 696 (2017).
6 Tournier, J. D. et al. MRtrix3: A fast, flexible and open software framework for medical image processing and visualisation. NeuroImage 202, 116137, (2019).
7 Tournier, J. D., Calamante, F. & Connelly, A. Robust determination of the fibre orientation distribution in diffusion MRI: Non-negativity constrained super-resolved spherical deconvolution. NeuroImage 35, 1459-1472, (2007).
8 Dhollander, T., Smith, R., Tournier, J.-D., Jeurissen, B. & Connelly, A. in Proc Intl Soc Mag Reson Med 1027 (2015).
9 Tournier, J. D., Calamante, F. & Connelly, A. in Proceedings of the international society for magnetic resonance in medicine. (John Wiley & Sons, Inc. New Jersey, USA).
10 DeKraker, J., Ferko, K. M., Lau, J. C., Köhler, S. & Khan, A. R. Unfolding the hippocampus: An intrinsic coordinate system for subfield segmentations and quantitative mapping. NeuroImage 167, (2018).
11 Raffelt, D. A. et al. Investigating white matter fibre density and morphology using fixel-based analysis. Neuroimage 144, 58-73, (2017).
12 Adler, D. H. et al. Characterizing the human hippocampus in aging and Alzheimer's disease using a computational atlas derived from ex vivo MRI and histology. Proc Natl Acad Sci U S A 115, (2018).
13 Yushkevich, P. A., Pluta, J., Wang, H., Wisse, L.E., Das, S. and Wolk, D. Fast Automatic Segmentation of Hippocampal Subfields and Medial Temporal Lobe Subregions in 3 Tesla and 7 Tesla MRI. Alzheimer's & Dementia: The Journal of the Alzheimer's Association 12(7), pp.P126-P127 (2016).
14 Beaujoin, J. et al. Post-mortem inference of the human hippocampal connectivity and microstructure using ultra-high field diffusion MRI at 11.7 T. Brain Struct Funct 223, 2157-2179, (2018).
15 Smith, R. E., Tournier, J. D., Calamante, F. & Connelly, A. SIFT: Spherical-deconvolution informed filtering of tractograms. Neuroimage 67, 298-312, doi:10.1016/j.neuroimage.2012.11.049 (2013).
16 de Flores, R. et al. Characterization of hippocampal subfields using ex vivo MRI and histology data: Lessons for in vivo segmentation. Hippocampus 30, 545-564, (2020).
Figures