0219
Mapping curvature responses in human V4 using VASO at 3T1Psychology, University of York, York, United Kingdom, 2York Neuroimaging Centre, University of York, York, United Kingdom, 3School of Physics, Engineering, and Technology, University of York, York, United Kingdom, 4University of York, York, United Kingdom, 5Biomolecular Sciences, University of Urbino Carlo Bo, Urbino, Italy, 6Cognitive Neuroscience, Maastricht University, Maastricht, Netherlands, 7Maastricht Brain Imaging Centre, Maastricht University, Maastricht, Netherlands, 8Cognitive Neuroscience, Maastricht Univeristy, Maastricht, Netherlands, 9German Center for Neurodegenerative Diseases (DNZE), Bonn, Germany, 10Institute of Sport, Manchester Metropolitan University, Manchester, United Kingdom, 11York Biomedical Research Institute, University of York, York, United Kingdom
Synopsis
Keywords: Gray Matter, fMRI (task based), VASO
The intermediate processing steps in human vision are not well characterised. We show however that the high specificity of VASO fMRI permits investigation functional organisation of curvature responses in human visual area V4, which is an intermediate region in the visual system. Understanding how the functional architecture and hierarchical integration of local contours (curvature) contributes to formation of shapes can inform computational models of object recognition. The emergence of inter-individual differences in these organisations can explain individual differences in healthy and impaired visual perception.Introduction
Visual area V4 represents a vital intermediate stage of processing spatial and curvature information that precedes object recognition1,2. Electrophysiological recordings of macaque V4 neurones show selective responses to contours and curvature. Additional optical imaging studies3,4 have identified a modular organisation of curvature responses, known as curvature domains, in this cortical area. fMRI work in humans5 has reported an extended network of patches involved in processing curvature, including area V4. However, research is hampered by the GE-EPI BOLD fMRI acquisition. This standard approach has low spatial specificity due to its sensitivity to large draining veins at the cortical surface6. Interpretation of brain maps is therefore confounded, and new approaches are needed to probe into the fine spatial organisation of the visual system. Vascular Space Occupancy (VASO), a Cerebral Blood Volume (CBV)-based approach, provides much higher spatial specificity enabling mapping of cortical information with high precision7. In this study we probe the functional organisation of curvature responses in human V4 by measuring CBV responses using VASO at clinically relevant field strengths (3T).Methods
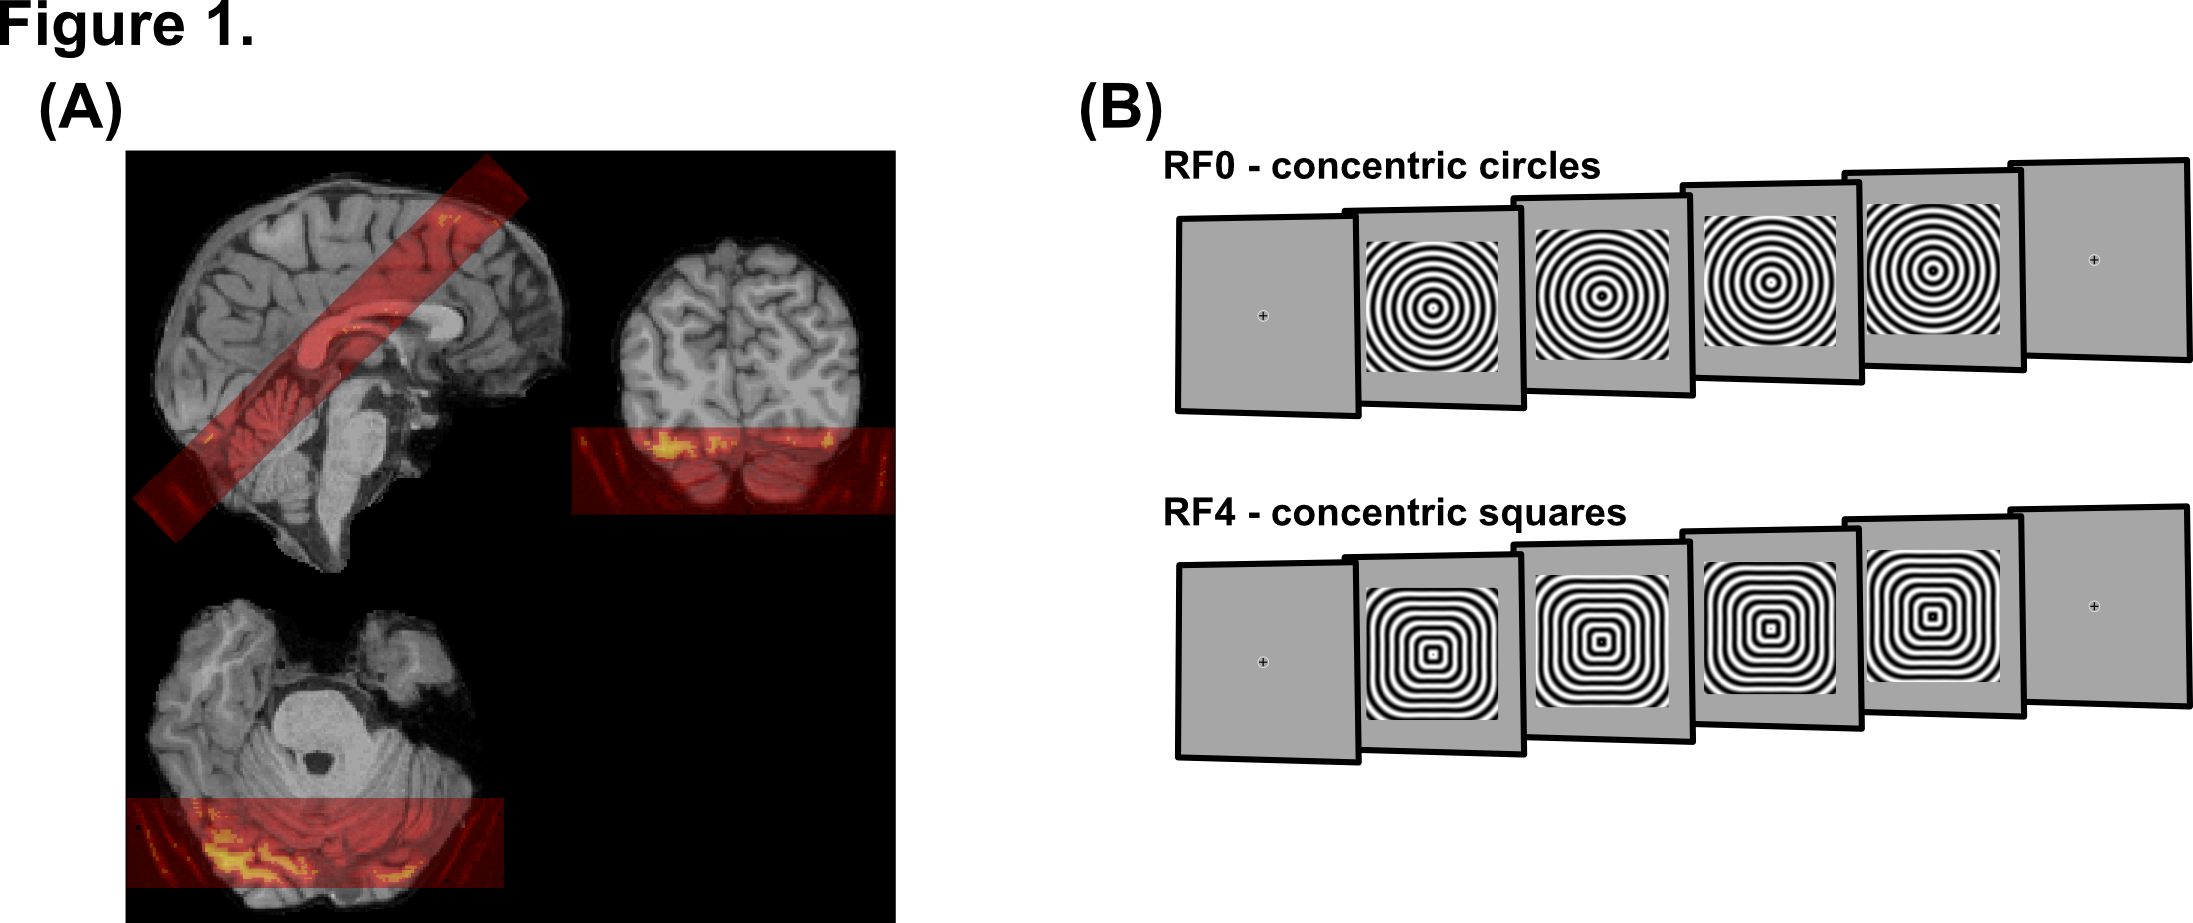
Data acquisition: We used a Siemens MAGNETOM Prisma 3T scanner with a 32 channel RX head coil at the York Neuroimaging Centre (York, UK). Functional scans were performed (n=4) using a 3D-EPI based VASO sequence optimised for use at clinical field strengths8, with a nominal resolution of 1.2mm isotropic (20 slices, TI1/TI2/TR/TE=1145/2115/2610/17.2ms, pF=6/8 with POCS#8, flip angle=30º, FLASH GRAPPA 3, bandwidth=1008Hz/Px, FoV=190mm). Slice position and orientation were adjusted individually to cover the ventrolateral visual cortex (Figure 1A). Retinotopic mapping data were acquired using standard GE-EPI sequence (52 slices, 2.5mm isotropic, TR/TE=1000/30ms, pF=7/8, flip angle=75º, Multi-Band factor=4, bandwidth=1786Hz/Px, FoV=200mm). Whole-brain T1-weighted structural images (0.8mm isotropic) were acquired using standard MP2RAGE.Paradigm: Participants performed between 1 and 4 functional runs (~17min each) and 4 retinotopic mapping runs (~2min each) per imaging session. Functional scans consisted of initial 86.13s of fixation, followed by fourteen 31.32s on-off blocks where visual stimuli spanning 9º of visual angle were presented with contrast reversing every 522ms (Figure 1B). Visual stimuli consisted of concentric radial frequency patterns with (a) radial frequency of 0 (circle, curved stimulus) and (b) radial frequency of 4 (rounded squares, with straight contours along the horizontal and vertical meridians). Area V4 was identified following standard retinotopic mapping procedure9. Throughout the session participants maintained fixation at the centre of the screen.
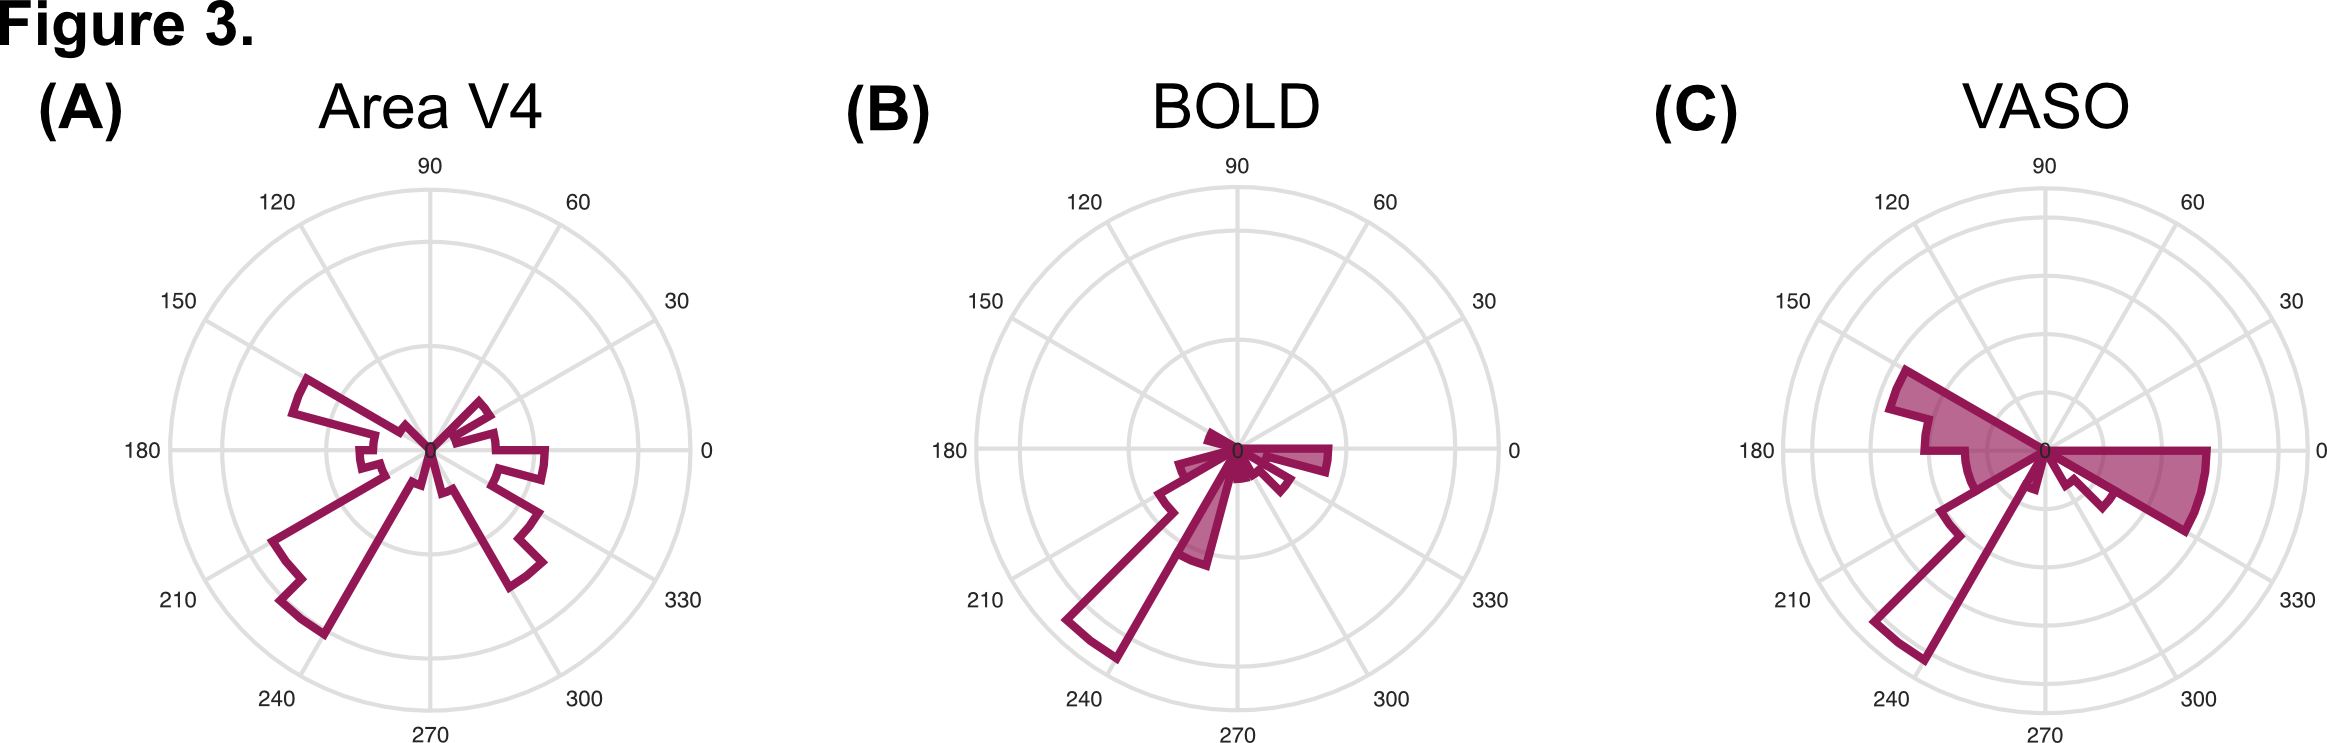
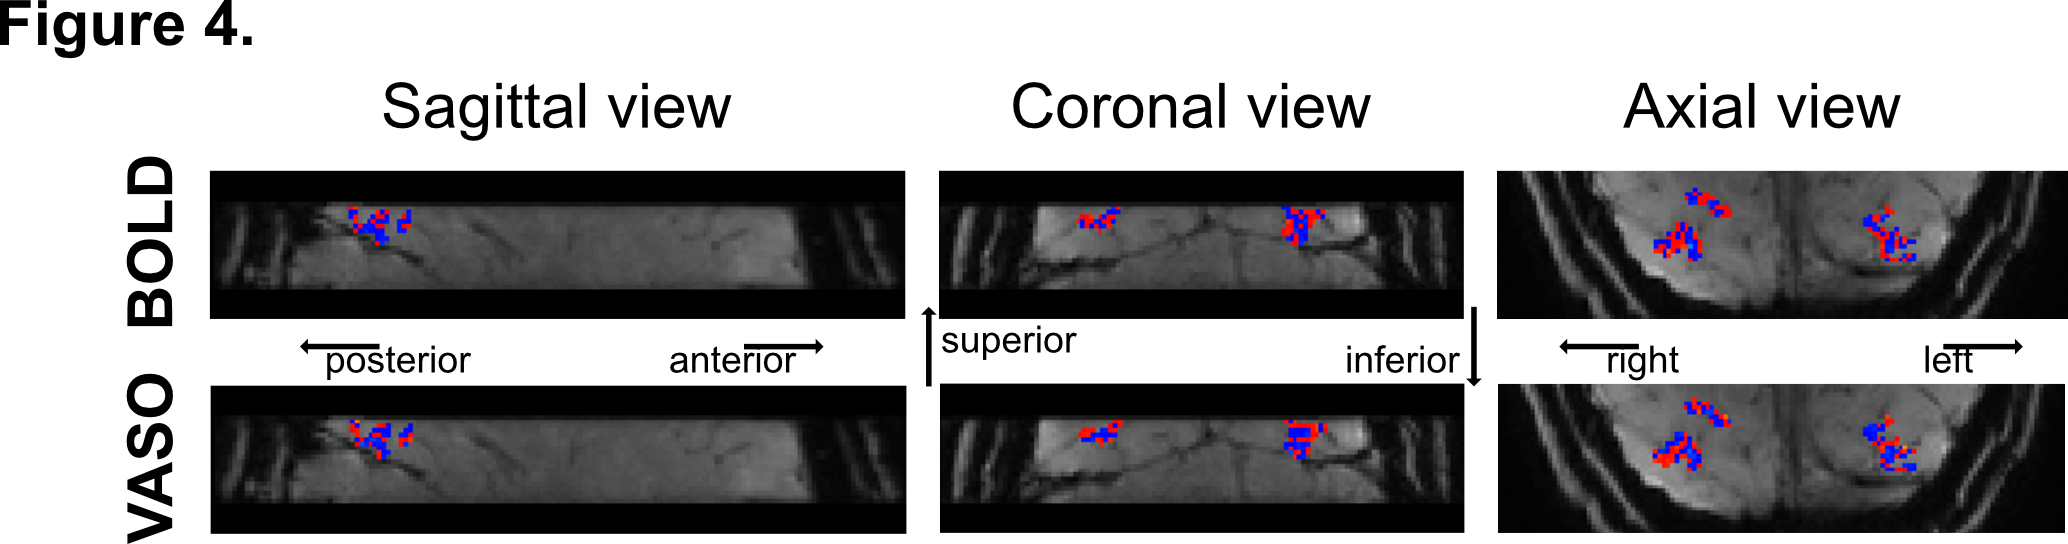
Data analysis: VASO data were motion corrected using SPM1210, BOLD contamination correction was performed using LAYNII11, GLM analysis was performed using custom Matlab scripts, tSNR maps were obtained using AFNI12. Structural data was automatically segmented using Freesurfer13. Retinotopic map (eccentricity and polar angle distribution) of area V4 was identified using mrVista14. Statistical map for the contrast 'radial frequency pattern 0 > radial frequency pattern 4' was weighted by the polar angle map from the retinotopy to obtain the distribution of curvature responsive voxels across the visual field representation of V4 (Figure 3). To obtain curvature preference maps (Figure 4), the difference in peak of haemodynamic response (5 to 14s after stimulus onset) between visual stimuli was computed for each voxel in V4, with positive values indicating preference for curvature.
Results & Discussion
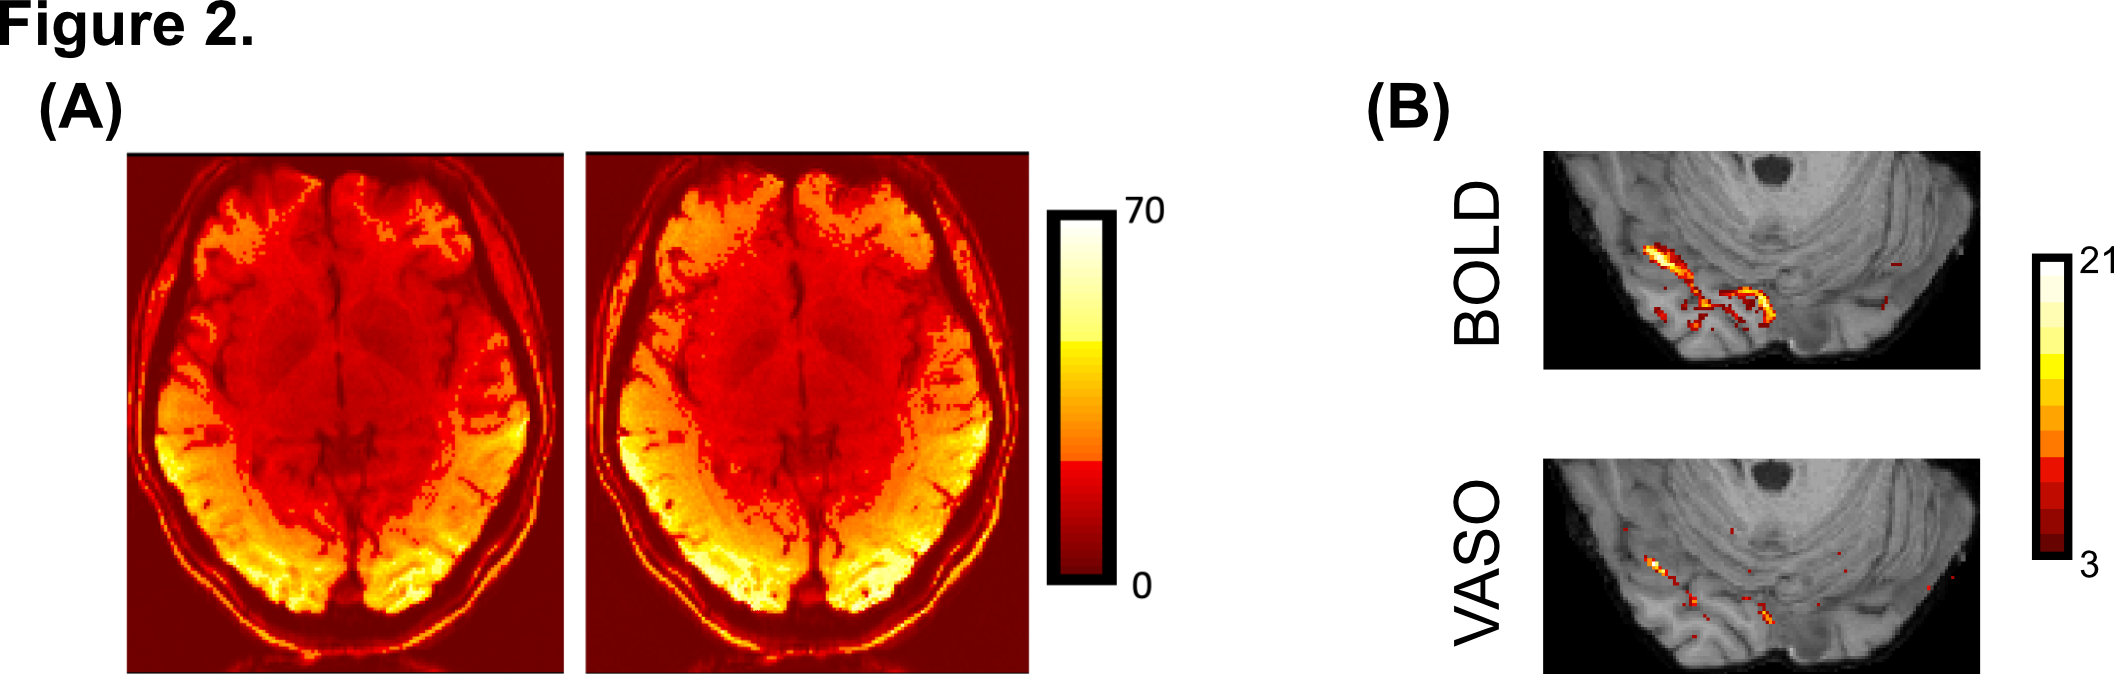
tSNR maps for BOLD and VASO (Figure 2A) in the visual cortex are ~40:1 and ~30:1, respectively. Lower tSNR is expected due to the signal inversion for blood nulling. Importantly, BOLD activation maps for stimulus vs fixation contrast (Figure 2B, top) show significantly more activated voxels than VASO (Figure 2B, bottom), however counterintuitively this likely reflects lower spatial specificity of BOLD and its greater weighting of surface draining veins.Visual field mapping of curvature-responsive voxels (Figure 3B and Figure 3C, respectively) suggests that voxels representing the horizontal and vertical meridians show a preference for curvature (shaded area). VASO data (Figure 3C) show a higher proportion of curvature responsive voxels per polar angle bin compared to BOLD, further confirming higher spatial specificity of VASO in identifying curvature-responsive voxels. Furthermore, clusters of voxels representing the oblique axes also show preference for curvature (white areas). This could suggest a parametric response to curvature based on our visual stimuli. The topography of curvature preference in V4 (Figure 4) shows a pattern with 'blobs' alternating between curvature (in red) and straight (in blue). VASO data shows a more pronounced 'stripe-like' pattern compared to BOLD, further supporting the improved spatial specificity of this measurements in studying fine-scale cortical organisation.Conclusion & Summary
Here we utilise high-resolution VASO fMRI at 3T to investigate functional organisation of V4. Voxels that exhibit stimulus-driven responses were largely restricted to the grey matter. Voxels showing a preference for curvature clustered along the horizontal and vertical meridians of the visual field, regions where our stimuli presented the highest difference between straight and curved lines. VASO data yield a higher spatial specificity in mapping curvature-responses than BOLD data.In summary, this study demonstrates the feasibility of using high resolution VASO fMRI at 3T to understand the modular organisation of curvature responses in human vision. To date this has only been shown with invasive imaging methods on animal models.Acknowledgements
This research is supported by the York Maastricht Partnership.References
1. Kobatake E, Tanaka N. Neuronal selectivities to complex object features in the ventral visual pathway of the macaque cerebral cortex. J Neurophysiol. 1994; 71(3):856-67
2. Pasupathy A, Connor CE. Responses to contour features in macaque area V4. J Neurophysiol. 1999; 82:2490-2502
3. Hu JM, Song XM, Wang Q, et al. Curvature domains in V4 of macaque monkey. eLife 2020; 9:57261
4. Tang R, Song Q, Li Y, et al. Curvature-processing domains in primate V4. eLife 2020; 9:e57502
5. Yue X, Robert S, Ungerleider LG. Curvature processing in human visual cortical areas. NeuroImage 2020; 222:117295
6. Polimeni JR, Fischl B, Greve ND, et al. Laminar analysis of 7T BOLD using an imposed spatial activation pattern in human V1. NeuroImage 2010; 52(4):1334-46
7. Huber L, Uludag K, Möller He. Non-BOLD contrast for laminar fMRI in humans: CBF, CBV, and CMRO2. NeuroImage 2019; 197:742-760
8. Stirnberg R, Stöcker T. Segmented K-Space Blipped-Controlled Aliasing in Parallel Imaging (Skipped-CAIPI) for High Spatiotemporal Resolution Echo Planar Imaging. Magn Res Med. 2020; 85(0):1540-1551
9. Welbourne LE, Morland AB, Wade AR. Population receptive field (pRF) measurements of chromatic responses in human visual cortex using fMRI. NeuroImage 2018; 167:84-94
10. SPM12.3 - http://www.fil.ion.ucl.ac.uk/spm/software/spm12/
11. Huber L, Poser BA, Bandettini PA, et al. LayNii: A software suite for layer-fMRI. NeuroImage 2021; 237:118091
12. Cox RW, Hyde JS. Software tools for analysis and visualisation of fMRI data. NMR in Biomedicine 1997; 19:171-178
13. Freesufer - v6.0; http://surfer.nmr.mgh.harvard.edu/
14. mrVista - https://github.com/vistalab/vistasoft
Figures