0195
Multisite Intravoxel Incoherent Motion Repeatability and Reproducibility in a Breast Diffusion Phantom at 3T1Radiology, NYU Langone Health, New York, NY, United States, 2MR Application Predevelopment, Siemens Healthcare GmbH, Erlangen, Germany, 3Radiology, Memorial Sloan Kettering Cancer Center, New York, NY, United States
Synopsis
Keywords: Breast, Phantoms, IVIM, Reproducibility
Monoexponential apparent diffusion coefficient (ADC) and biexponential intravoxel incoherent motion (IVIM) analysis of diffusion-weighted imaging (DWI) is helpful in the characterization of breast tumors. Toward this goal, a novel breast phantom containing tubes of different polyvinylpyrrolidone (PVP) concentrations, water, fat, and sponge flow chambers was utilized. This work tests this breast phantom at two sites employing different vendor MRI scanners to estimate the ADC and IVIM parameters. The results are reproducible within sites, and show progress towards reproducibility across sites and vendors, and can be used in the future in multicenter clinical trials for breast cancer characterization, prediction and prognosis.Introduction
Breast cancer is a leading causes of cancer deaths in women in the U.S. 1. Diffusion-weighted imaging (DWI) provides imaging biomarkers for cancer characterization 2. Apparent diffusion coefficient (ADC), a first-order representation of the tumor environment is used to study cellularity. Intravoxel incoherent motion (IVIM), sensitive to cellularity and microvascular flow, is also increasingly used 3,4. Phantoms can evaluate reproducibility and biases across different MRI vendors. This study employed a flow phantom 5,6 mimicking the tumor environment to test the repeatability and reproducibility of IVIM across multiple sites and vendors.Methods
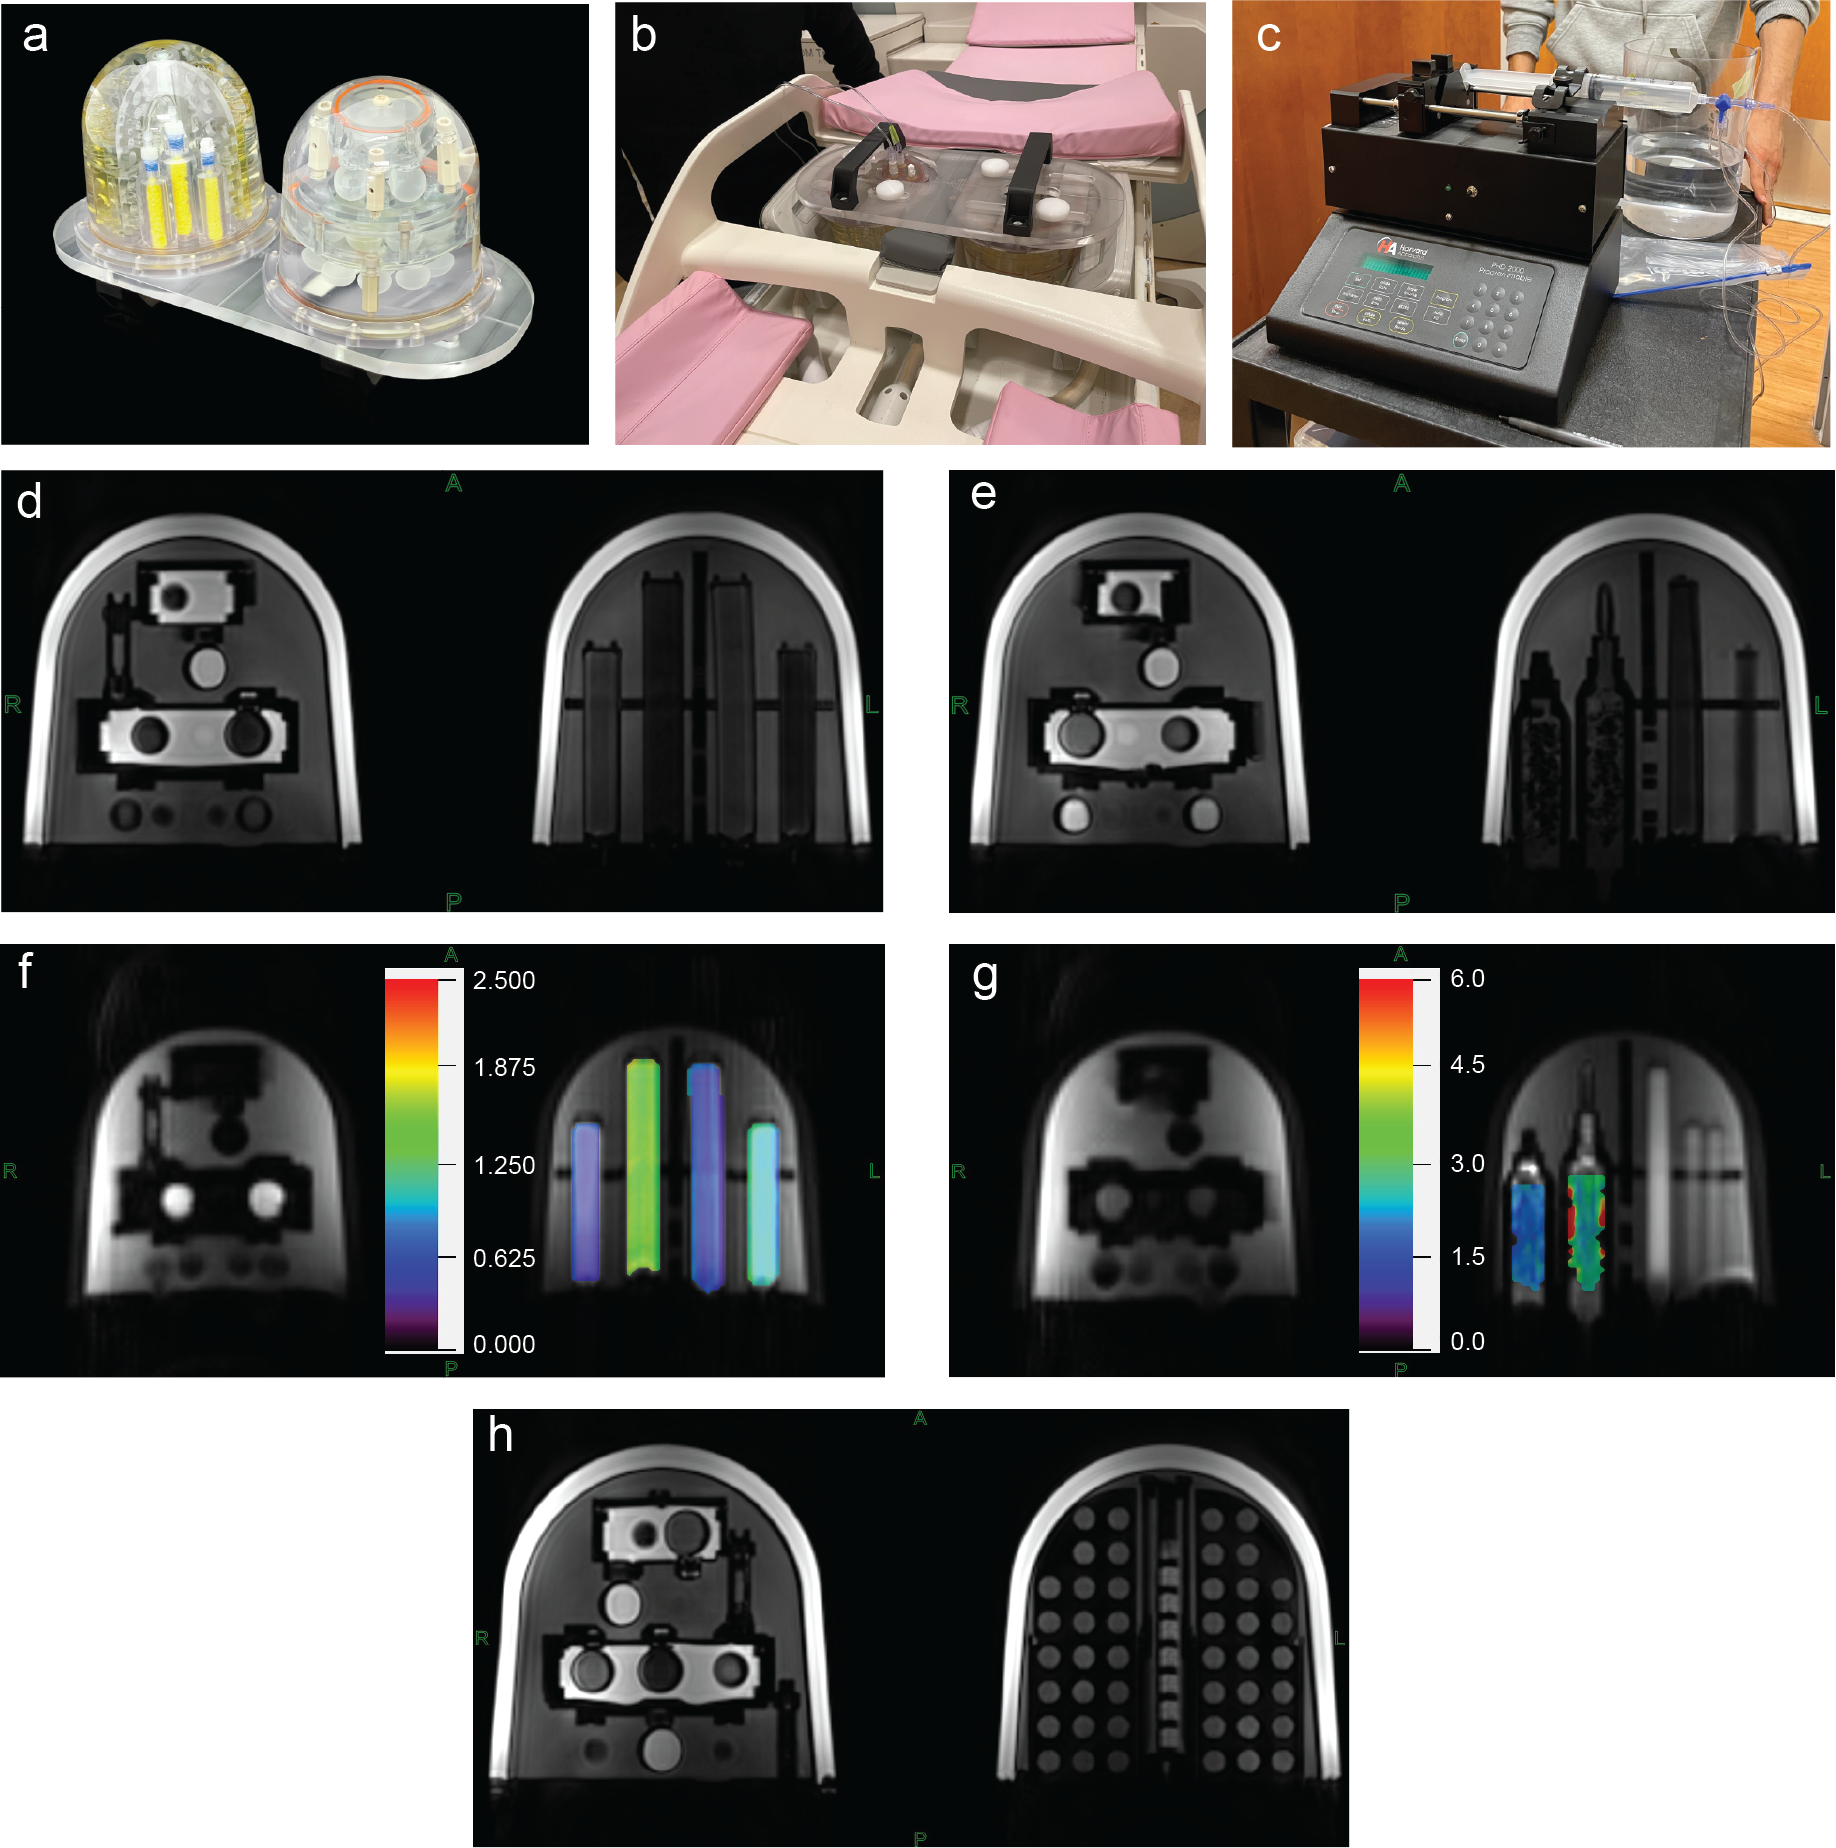
This study used a breast phantom with diffusion and T1/T2 relaxation units (CaliberMRI, Boulder, CO, USA), a prototype variant of an existing system 7 (Figure 1). There are two polyvinylpyrrolidone (PVP) 10% tubes, one PVP 14% tube, one PVP 18% tube, two PVP 25% tubes, two PVP 40% tubes, one water tube, three fat mimic tubes and three tubes containing cellulose sponge (two flow tubes and one isolated). Flow through the cellulose sponge simulates tumor incoherent blood flow.The phantom was scanned using 16-channel breast array coils in two 3 T MRI systems, Site 1: MAGNETOM Trio, Siemens Healthcare, Erlangen, Germany; Site 2: GE MR 750, GE Healthcare, Waukesha, Wisconsin, USA. The phantom was scanned with capillaries passing through a waveguide to a digitally controlled syringe pump (Harvard Apparatus PHD 2000 MRI Remote Programmable) and distilled water reservoir outside the scanner room. The phantom was scanned twice on each scanner on each of two separate days; four sessions at each site. Diffusion-weighted scans used echo planar imaging readout at Site 1 (prototype sequence, twice-refocused spin echo, TR/TE 2938/66 ms, matrix 94 x 192 x 19, resolution 2.2/2.2/5 mm, 2 averages) and Site 2 (single spin echo, TR/TE 3000/55.9 ms, matrix 192 x 192 (interpolated to 256) x 23-28, resolution 1.6/1.6/5 mm) with 10 b-values (b = 0, 10, 30, 50, 80, 120, 200, 400, 600, 800 s/mm2) in three diffusion directions (duration ~3 minutes). Axial T1-weighted gradient echo imaging (Site 1: TE/TE 5.4/1.7 ms, NFS, 0.98/0/98/1 mm resolution; Site 2: TE/TE 4.7/2.1 ms, FS, 0.78/0/78/1 mm resolution) was used to monitor temperature via an embedded array of liquid crystal samples 8. The phantom was scanned at flow levels 0, 5, 10, 15 mL/min in both Forward and Reverse flow directions. For pre-thermalization the phantom was placed in the scanning room 24-48 hours before scanning. Temperatures were 22°C, 23°C (Site 1) and 19°C, 20°C (Site 2) during scan sessions according to the internal thermometer (Figure 1h).
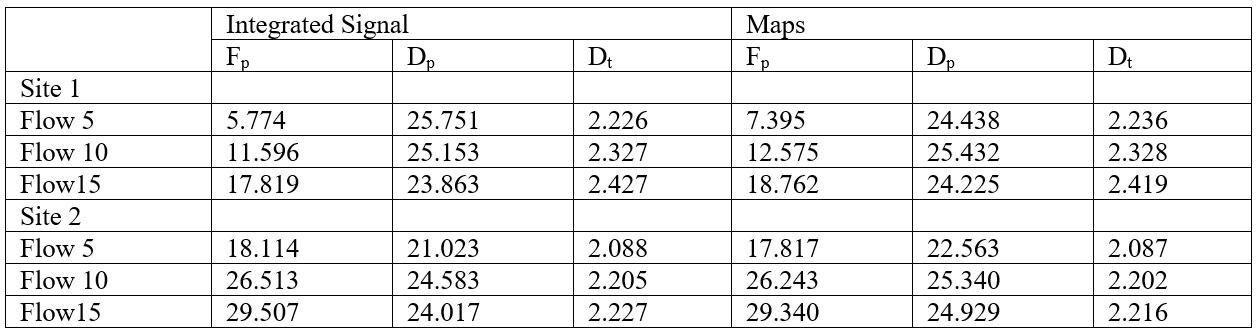
Region of interest (ROIs) were manually drawn on b0 images within the PVP, water, and flow tubes using FireVoxel, https://firevoxel.org/. ADC and IVIM parameters perfusion fraction (Fp), pseudodiffusivity (Dp), and tissue diffusivity (Dt) were extracted from flow tubes both from integrated signal analysis and parametric maps using Firevoxel. ADC accuracy for the PVP vials was estimated using the LC thermometer to compare with vendor-provided ADC calibrations. The repeatability (intraday) and reproducibility (interday) of the IVIM parameters were calculated for the flow compartments via the ratio of the difference to the average of paired measurements as a percentage. Pearson correlation coefficients between IVIM biomarkers and flow speed were also estimated. Analysis was performed in Matlab.
Results
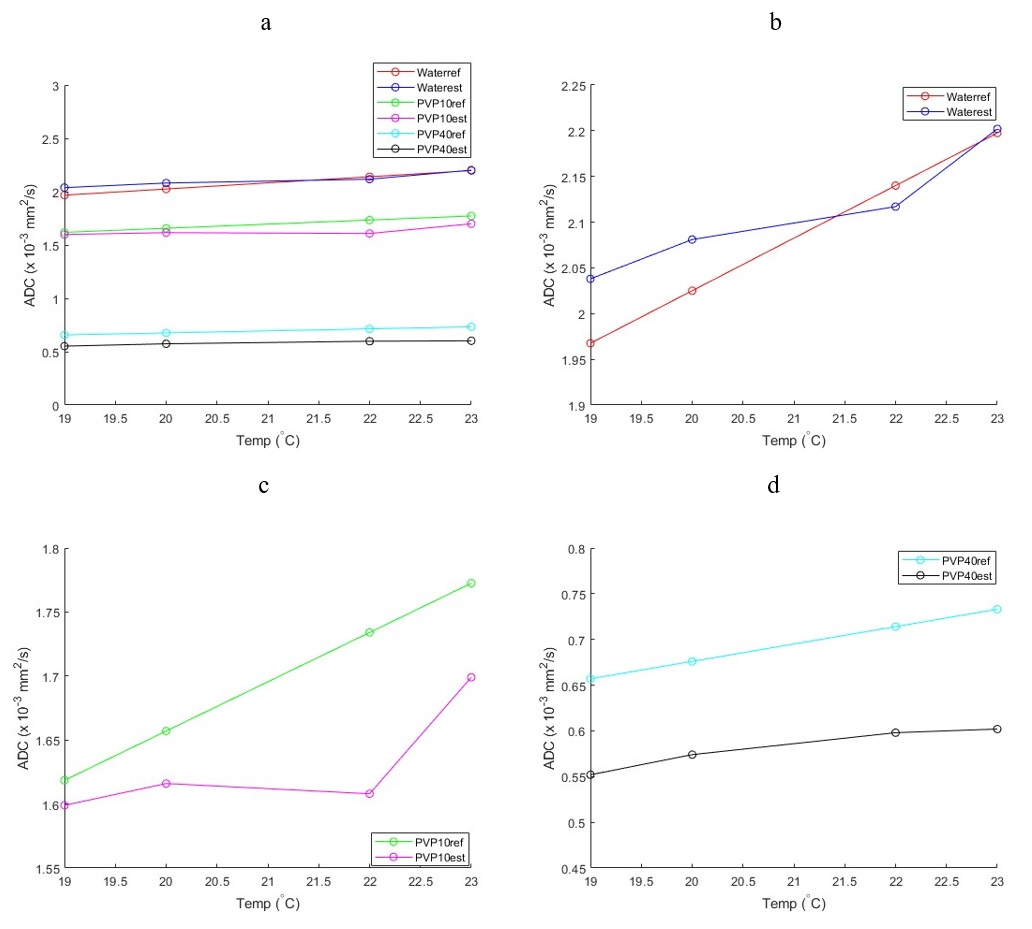
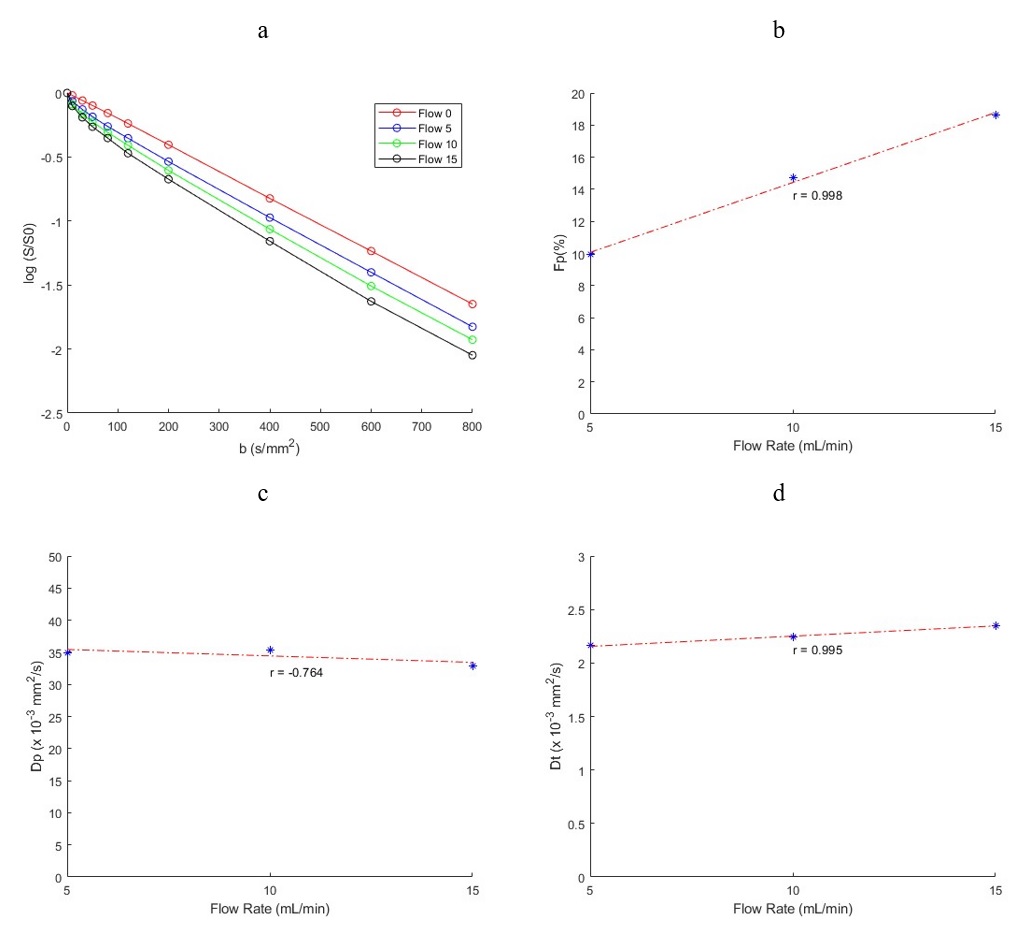
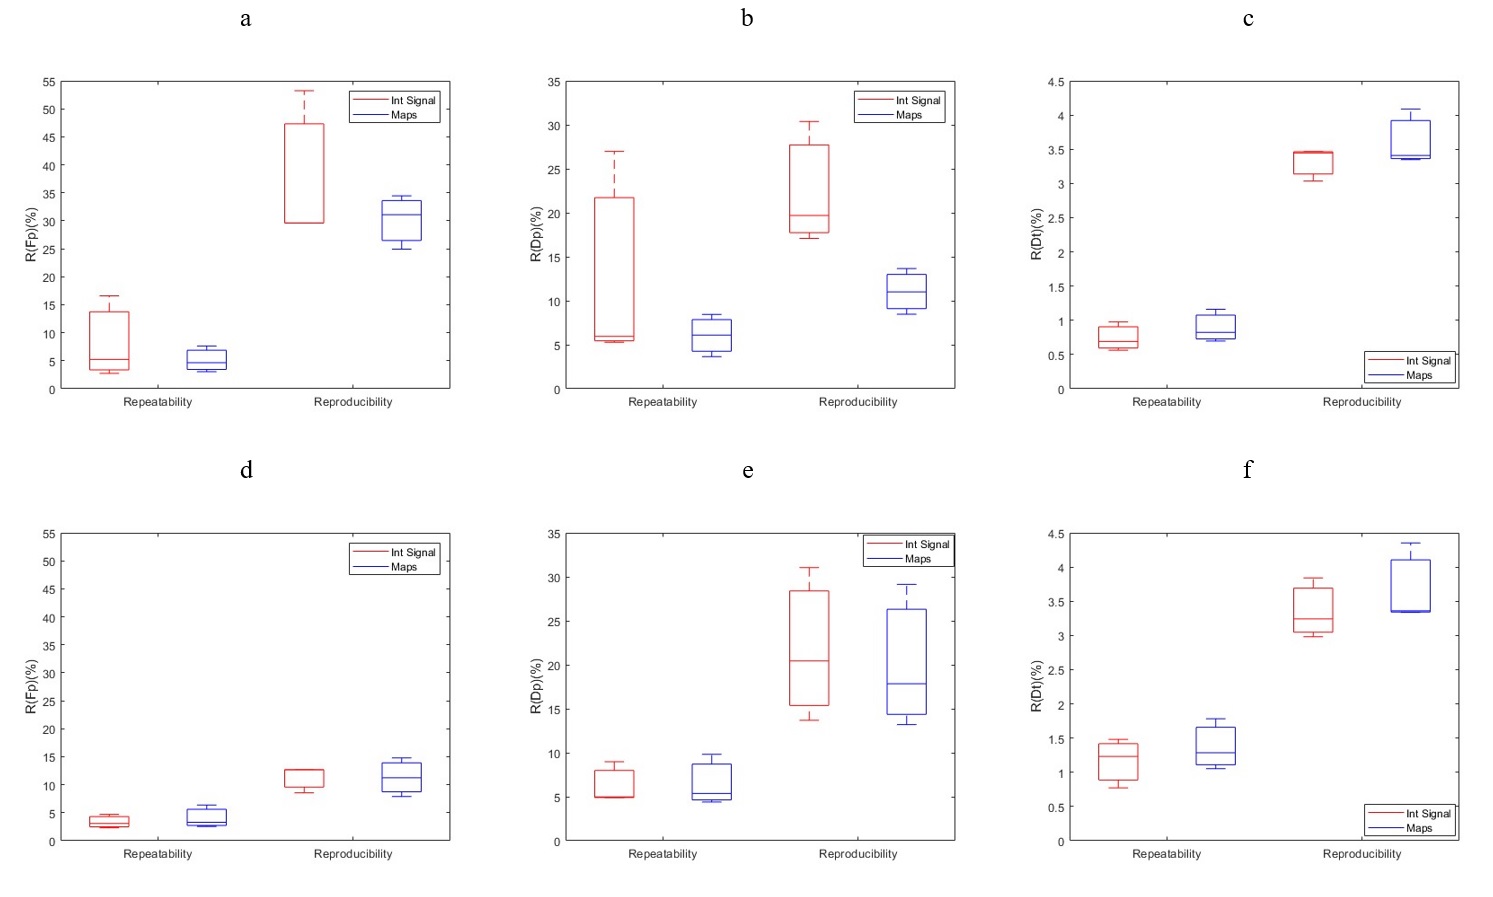
ADC values for water, PVP 10% and PVP 40% at the four different temperatures of the scan sessions are shown in Figure 2 with lines of reference from the vendor-provided ADC calibration. The average bias (%) for water, PVP 10% and PVP 40% was 1.907, 3.773 and 16.297 respectively. Example decay curves for the flow compartment for Site 1 are shown in Figure 3 along with flow correlations. At one site, forward flow cases showed nonmonotonic signal decays; all analysis was thus performed on reverse flow data. Pearson correlation coefficient were high for integrated signal/maps for Fp (r = 0.973/0.973) and Dt (r = 0.961/0.948) while Dp (r = 0.744/0.572) showed lower correlations. The average IVIM values at different sites are shown in Table 1 while repeatability and reproducibility of the IVIM parameters are shown in Figure 4. The median intersite reproducibility (%) of Fp/Dp/Dt was 78.436/21.785/8.106 and 70.463/14.423/7.889 for integrated signal and maps respectively.Discussion
Results of this study indicate good repeatability and reproducibility of IVIM parameters in a controlled phantom. The global trends indicate better intraday repeatability than interday reproducibility, and the lowest reproducibility for intersite comparison. Dt was more reproducible than Fp or Dp, and slightly better reproducibility was found for parametric maps vs. integrated signal analysis. Correlation of parameters with flow speed was strong and consistent for Dt and Fp. Some variability may have originated from residual air bubbles in the sponge media altering flow patterns for different sessions, or from vendor variations in pulse sequences.The PVP samples showed a range of ADC values and temperature dependences consistent with calibrated values 7,9. The highest PVP concentration tube (40%) showed the largest deviation, as seen previously 9,10.
Conclusion
This study revealed promising results with IVIM reproducibility approaching in some cases benchmarks achieved by more common biomarkers such as ADC. Further scrutiny of the flow media, pulse sequence variability, or normalization strategies may improve them even further.Acknowledgements
We acknowledge support from the National Institutes of Health (NIH). We also thank the staff at CaliberMRI and Dr. Katy Keenan at NIST for useful discussions.References
1. DeSantis CE, Ma JM, Gaudet MM, et al. Breast cancer statistics, 2019. Ca-Cancer J Clin. 2019;69(6):438-451.
2. Padhani AR, Liu G, Koh DM, et al. Diffusion-weighted magnetic resonance imaging as a cancer biomarker: consensus and recommendations. Neoplasia. 2009;11(2):102-25.
3. Bokacheva L, Kaplan JB, Giri DD, et al. Intravoxel Incoherent Motion Diffusion-Weighted MRI at 3.0 T Differentiates Malignant Breast Lesions From Benign Lesions and Breast Parenchyma. J Magn Reson Imaging. 2014;40(4):813-823.
4. Sigmund EE, Cho GY, Kim S, et al. Intravoxel Incoherent Motion Imaging of Tumor Microenvironment in Locally Advanced Breast Cancer. Magn Reson Med. 2011;65(5):1437-1447.
5. Cho GY, Kim S, Jensen JH, Storey P, Sodickson DK, Sigmund EE. A versatile flow phantom for intravoxel incoherent motion MRI. Magn Reson Med. 2012;67(6):1710-1720.
6. Lorenz CH, Pickens DR, Puffer DB, Price RR. Magnetic-Resonance Diffusion Perfusion Phantom Experiments. Magn Reson Med. 1991;19(2):254-260.
7. Keenan KE, Wilmes LJ, Aliu SO, et al. Design of a breast phantom for quantitative MRI. J Magn Reson Imaging. 2016;44(3):610-619.
8. Keenan KE, Stupic KF, Russek SE, Mirowski E. MRI-visible liquid crystal thermometer. Magn Reson Med. 2020;84(3):1552-1563.
9. Fang LK, Keenan KE, Carl M, Ojeda-Fournier H, Rodriguez-Soto AE, Rakow-Penner RA. Apparent Diffusion Coefficient Reproducibility Across 3 T Scanners in a Breast Diffusion Phantom. J Magn Reson Imaging. 2022.
10. Yung JP, Ding Y, Hwang K-P, et al. Quantitative Evaluation of apparent diffusion coefficient in a large multi-unit institution using the QIBA diffusion phantom. medRxiv. 2020:2020.09.09.20191403.
Figures