0194
Assessment of Breast Lesions by the Kaiser Score for Differential Diagnosis on MRI: The Added Value of ADC and Machine Learning Modeling1the First Affiliated Hospital of Wenzhou Medical University, Wenzhou, China, 2University of California, Irvine, CA, United States, 3Kaohsiung Medical University, Kaohsiung, Taiwan
Synopsis
Keywords: Breast, Breast
How ADC could be combined with Kaiser score (KS) for the diagnosis of breast cancer was emerged as an interesting research area. We modified KS to KS+ based on the dichotomized ADC >1.4×10⁻³ mm2/s, and integrated KS and the continuous ADC values to build machine learning (ML) models for assessment. The diagnostic specificity of KS+ was higher than that of KS with a slightly degraded sensitivity. The AUCs of them were not significantly different. When the KS and the continuous ADC values were used to train ML models, the performance could be further improved while maintaining at a high sensitivity.Introduction
The American College of Radiology Breast Imaging Reporting and Data System (BI-RADS) lexicon provides a common language for description of features on dynamic contrast enhanced magnetic resonance imaging (DCE-MRI), that can be interpreted by radiologists to give a final score for a lesion indicating the probability of malignancy1,2. However, for lesions not showing the typical malignant or benign features, e.g. in BI-RADS 3 and 4A categories, there were only moderate inter-reader agreements and low specificity3,4. Kaiser score (KS) is a machine-learning derived clinical decision rule based on MRI BI-RADS descriptors, which provides the structure of an intuitive flowchart to guide the reader through a stepwise lesion assessment5,6 .Several studies have evaluated its clinical utility and found KS can improve inter-observer agreement and diagnostic performance7-10. Furthermore, the apparent diffusion coefficient (ADC) with a threshold of 1.4×10⁻³ mm2/s was integrated into the KS to give a modified KS+ for improving the diagnostic specificity11. ADC is a continuous variable, and thus, the diagnostic performance may change with different threshold values. Machine learning algorithms may be applied to develop models considering the full spectrum of the ADC values. In this study, we applied the machine learning (ML) algorithms to combine the KS and ADC values to train diagnostic models and compared with KS, ADC, and KS+.Methods
A dataset of 402 malignant and 257 benign lesions was identified. Three radiologists participated in the analysis. The locations of the histologically confirmed lesions have been disclosed to the radiologists, but not the histological results. Two radiologists (both with 8 years of experience) independently assigned the KS to each lesion. For the ADC measurement, another radiologist drew a circular region of interest (ROI) on the ADC map to measure the mean ADC value for each lesion. The ROI was placed on the most restricted diffusion area, and avoided necrotic, cystic, and hemorrhagic areas by referring to other sequences. Using a third radiologist to analyze the ADC could provide a completely independent assessment of the lesion not confounded by the reading of KS. If a lesion with KS>4 had ADC>1.4×10⁻³ mm2/s, the KS was reduced by 4 to become KS+. In order to consider the full spectrum of ADC as a continuous variable, the KS and ADC values were used to train diagnostic models using 5 machine learning (ML) algorithms, including the linear kernel support vector machine, radial kernel support vector machine, naive Bayes, linear discriminant analysis, and logistic regression. The ML models were developed by training, which was performed using randomly selected 70% of cases read by the first radiologist (Reader-1). The output of the model was a probability score. The cut-off value was selected in the training dataset, by setting the sensitivity to reach 95%. The developed models with the defined the threshold values were tested in the remaining 30% held-out cases of Reader-1 and the entire dataset of KS assigned by the second radiologist (Reader-2). The performance was evaluated using the ROC analysis, compared by the DeLong test. The obtained sensitivity, specificity and accuracy were compared by the McNemar test.Result
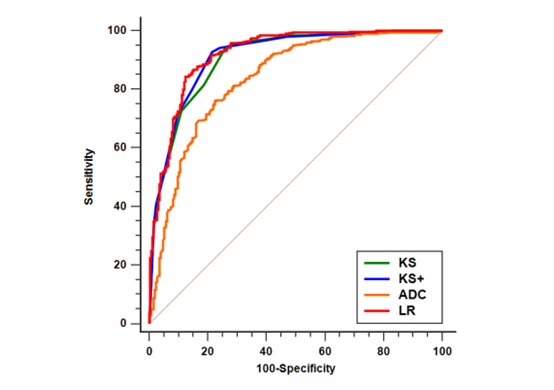
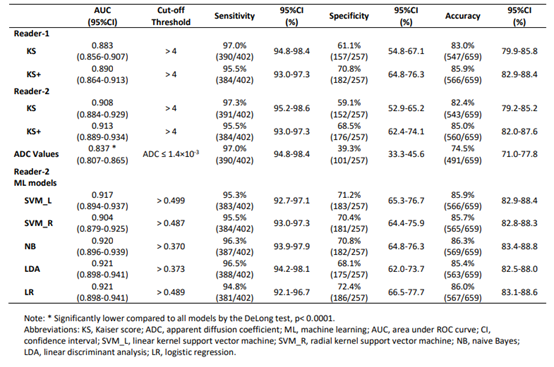
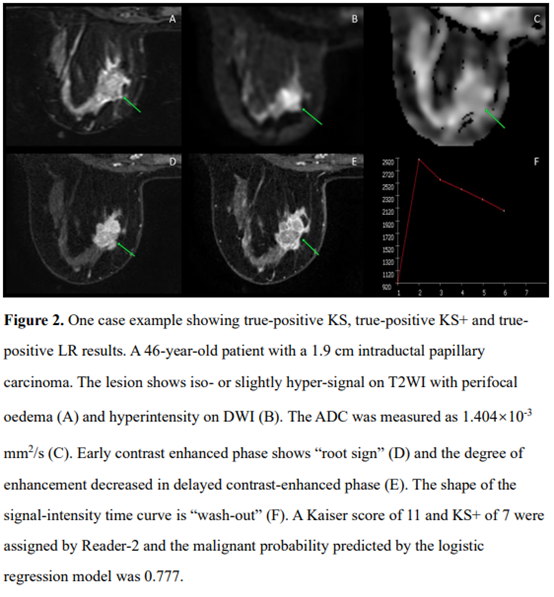
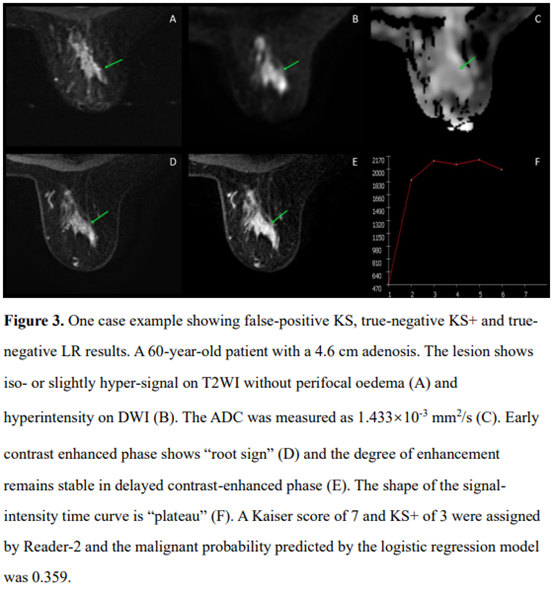
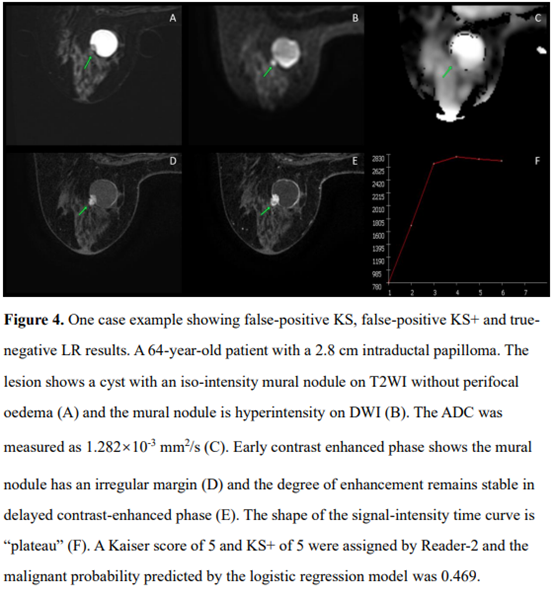
The ROC curves of KS, KS+, and all ML models had comparable AUC in the range of 0.883-0.921, significantly higher than that of ADC, 0.837, p<0.0001(Fig1). The KS had sensitivity=97.3%, specificity=59.1%; and the KS+ had sensitivity=95.5% with significantly improved specificity to 68.5% (p<0.0001) (Table 1). However, when setting at the same sensitivity of 97.3%, KS+ could not improve specificity. In ML analysis, the logistic regression model had the best performance. When using the original KS’s sensitivity at 97.3%, the specificity was 59.1% for KS, and estimated to be 56.2% for KS+ and 65.3% for the LR model., i.e. compared to KS, the LR model could avoid 16 false-positives without affecting true cancer diagnosis (p=0.0015). Figures 2 to 4 illustrate several case examples in which the KS+ or the LR model change the diagnosis made based on KS.Discussion
We have shown that when ADC was considered to modify KS to KS+, the diagnostic specificity was improved (9.4-9.7%) with a slightly degraded sensitivity (1.5-1.8%); and the overall accuracy was improved (2.6-2.9%). In ROC analysis, the KS, KS+, and all ML models did not show significant differences in AUC. When the KS and the continuous ADC values were used to train ML models, the performance could be further improved while maintaining at a high sensitivity, but the ML models were known to be dataset-specific and less likely to be generalizable. With the clear visual guidance for the assignment of KS using images acquired in a standard DCE-MRI, it is a robust diagnosis method ready for wide clinical implementation. Nonetheless, there is room for more research to evaluate its clinical utility with consideration of ADC by using more sophisticated machine learning methods in different patient populations.Conclusion
Using dichotomized ADC to modify KS to KS+ can improve specificity, but at the price of lowered sensitivity. Machine learning algorithms may be applied to consider the ADC as a continuous variable to build more accurate diagnostic models.Acknowledgements
This work was supported by the Key Laboratory of Intelligent Medical Imaging of Wenzhou (No. 2021HZSY0057), Key Laboratory of Alzheimer's Disease of Zhejiang Province, Institute of Aging, Wenzhou Medical University, Wenzhou, Zhejiang, China, Wenzhou Science & Technology Bureau (No. Y20180185), Medical Health Science and Technology Project of Zhejiang Province Health Commission (No. 2019KY102), the National Cancer Institute of the National Institutes of Health under award number P30 CA062203, R01 CA127927, R21 CA208938 and the UC Irvine Comprehensive Cancer Center using UCI Anti-Cancer Challenge funds.References
1. D'Orsi C, Morris E, Mendelson E (2013) ACR BI-RADS® Atlas, Breast Imaging Reporting and Data System.
2. Eghtedari M, Chong A, Rakow-Penner R, Ojeda-Fournier H (2021) Current Status and Future of BI-RADS in Multimodality Imaging, From the AJR Special Series on Radiology Reporting and Data Systems. AJR Am J Roentgenol 216:860-873
3. Rawashdeh M, Lewis S, Zaitoun M, Brennan P (2018) Breast lesion shape and margin evaluation: BI-RADS based metrics understate radiologists' actual levels of agreement. Comput Biol Med 96:294-298
4. Pinker K, Moy L, Sutton EJ et al (2018) Diffusion-Weighted Imaging With Apparent Diffusion Coefficient Mapping for Breast Cancer Detection as a Stand-Alone Parameter: Comparison With Dynamic Contrast-Enhanced and Multiparametric Magnetic Resonance Imaging. Invest Radiol 53:587-595
5. Dietzel M, Baltzer PAT (2018) How to use the Kaiser score as a clinical decision rule for diagnosis in multiparametric breast MRI: a pictorial essay. Insights Imaging 9:325-335
6. Baltzer PA, Dietzel M, Kaiser WA (2013) A simple and robust classification tree for differentiation between benign and malignant lesions in MR-mammography. Eur Radiol 23:2051-2060
7. Milos RI, Pipan F, Kalovidouri A et al (2020) The Kaiser score reliably excludes malignancy in benign contrast-enhancing lesions classified as BI-RADS 4 on breast MRI high-risk screening exams. Eur Radiol 30:6052-6061
8. Marino MA, Clauser P, Woitek R et al (2016) A simple scoring system for breast MRI interpretation: does it compensate for reader experience? Eur Radiol 26:2529-2537
9. Wengert GJ, Pipan F, Almohanna J et al (2020) Impact of the Kaiser score on clinical decision-making in BI-RADS 4 mammographic calcifications examined with breast MRI. Eur Radiol 30:1451-1459
10. Jajodia A, Sindhwani G, Pasricha S et al (2021) Application of the Kaiser score to increase diagnostic accuracy in equivocal lesions on diagnostic mammograms referred for MR mammography. Eur J Radiol 134:109413
11. Baltzer A, Dietzel M, Kaiser CG, Baltzer PA (2016) Combined reading of Contrast Enhanced and Diffusion Weighted Magnetic Resonance Imaging by using a simple sum score. Eur Radiol 26:884-891
Figures