0190
T2 and ADC correlated mapping of breast cancer lesions: A spatiotemporal encoding 3T MRI analysis1Weizmann Institute of Science, Rehovot, Israel, 2Sheba Medical Center, Ramat Gan, Israel, 3Ben Gurion University Hospital, Beer Sheva, Israel, 4Sackler School of Medicine, Tel Aviv, Israel
Synopsis
Keywords: Breast, Cancer
The possibility to improve the MRI contrast on cancerous breast lesions was explored by correlating quantitative T2 and ADC values. To this end, T2 maps of patients were measured at more than one b-value and ADC maps at more than one TE value –in all cases using spatiotemporal encoding (SPEN) MRI. SPEN delivered quality, artifact-free TE-weighted DW images, from which ADC and T2 maps could be correlated despite relatively long acquisitions and heavy signal weighting. Data suggest there may be potential value in combining T2 and ADC mappings, as these low-correlated variables can provide complementary information about breast lesions.Introduction
Diffusion weighted imaging (DWI) is an important part of the multiparametric breast cancer MRI scan protocol (1). T2-weighted imaging also plays a central role in breast MRI, and demonstrations of its potential benefits for diagnostics have been reported (2–4). Still, quantitative T2 mapping of potential breast cancer patients is relatively uncommon, as a result of relatively long scan times, and relatively limited contrast between benign and malignant tissues. One way of improving the contrast provided by T2 is to associate it to different degrees of diffusivity (b-value) weighting. This has been shown to improve diagnostic accuracy in case of prostate imaging (5–7), but to our knowledge has not been assessed in the context of breast cancer diagnosis. Herein, we bridge this gap by resorting to customized spatiotemporal encoding (SPEN) sequences (8–10).Methods
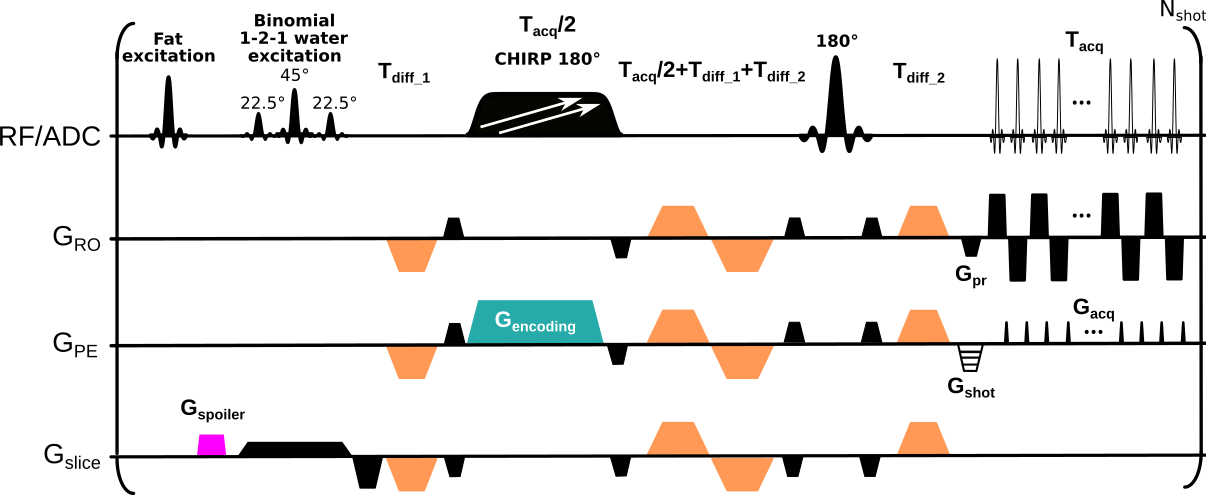
SPEN is an ultrafast imaging method relying on a linear frequency swept 180˚pulse applied in the presence of an encoding gradient. Spins thus spatially encoded are thereafter read directly in image space by an acquisition gradient, leading to higher immunity than EPI to effects caused by inhomogeneous magnetic fields (11,12). SPEN’s utility for both sub-mm ADC mapping of breast lesions (13,14) and T2 mapping (15), have been demonstrated. This study performed SPEN breast acquisitions by concurrently applying two pulses with different frequency sweeps to encode (from right-to-left) contra- and ipsi-lateral breasts (16), Figure 1. SPEN data were compared against multishot readout-segmented (RESOLVE) acquisitions collected with a scanner-supplied protocol (17). In all cases, dynamic contrast enhanced (DCE) MRI data were recorded for assessing the cancer diagnosis.All images were acquired at 3T on a Siemens Prisma scanner using a 16-channel bilateral receiving breast coil for n=12 consenting breast cancer patients. Axial breast images were collected at a 1.2×1.2×3.0 mm3 resolution with diffusion weightings (repetitions) of 0 (1) and 800 (3) s/mm2 applied at three orthogonal diffusion directions. RESOLVE was acquired using a 300×180 (RO×PE) mm2 FOV with 3 RO segments, GRAPPA acceleration of 2, effective PE bandwidth (BW) of 4 kHz, TE of 67 ms. T2/ADC-weighted SPEN data were collected at three different TEs (75, 90 and 105 ms), with breast-covering FOVs of 140×94 (RO×PE) mm2. Each breast was addressed by concurrent frequency-swept pulses, and subsequently resolved by the coils’ sensitivity maps (acquired for each breast using single-sweep separate SPEN scans, b=0 s/mm2, TE=75 ms). Three interleaved segments were collected along the SPEN dimension, leading to an effective BW = 3.3 kHz. Acquisition times for each of the DW image series was 6 min; total acquisition time for hybrid T2 and ADC mapping was 19 min.
Results & Discussion
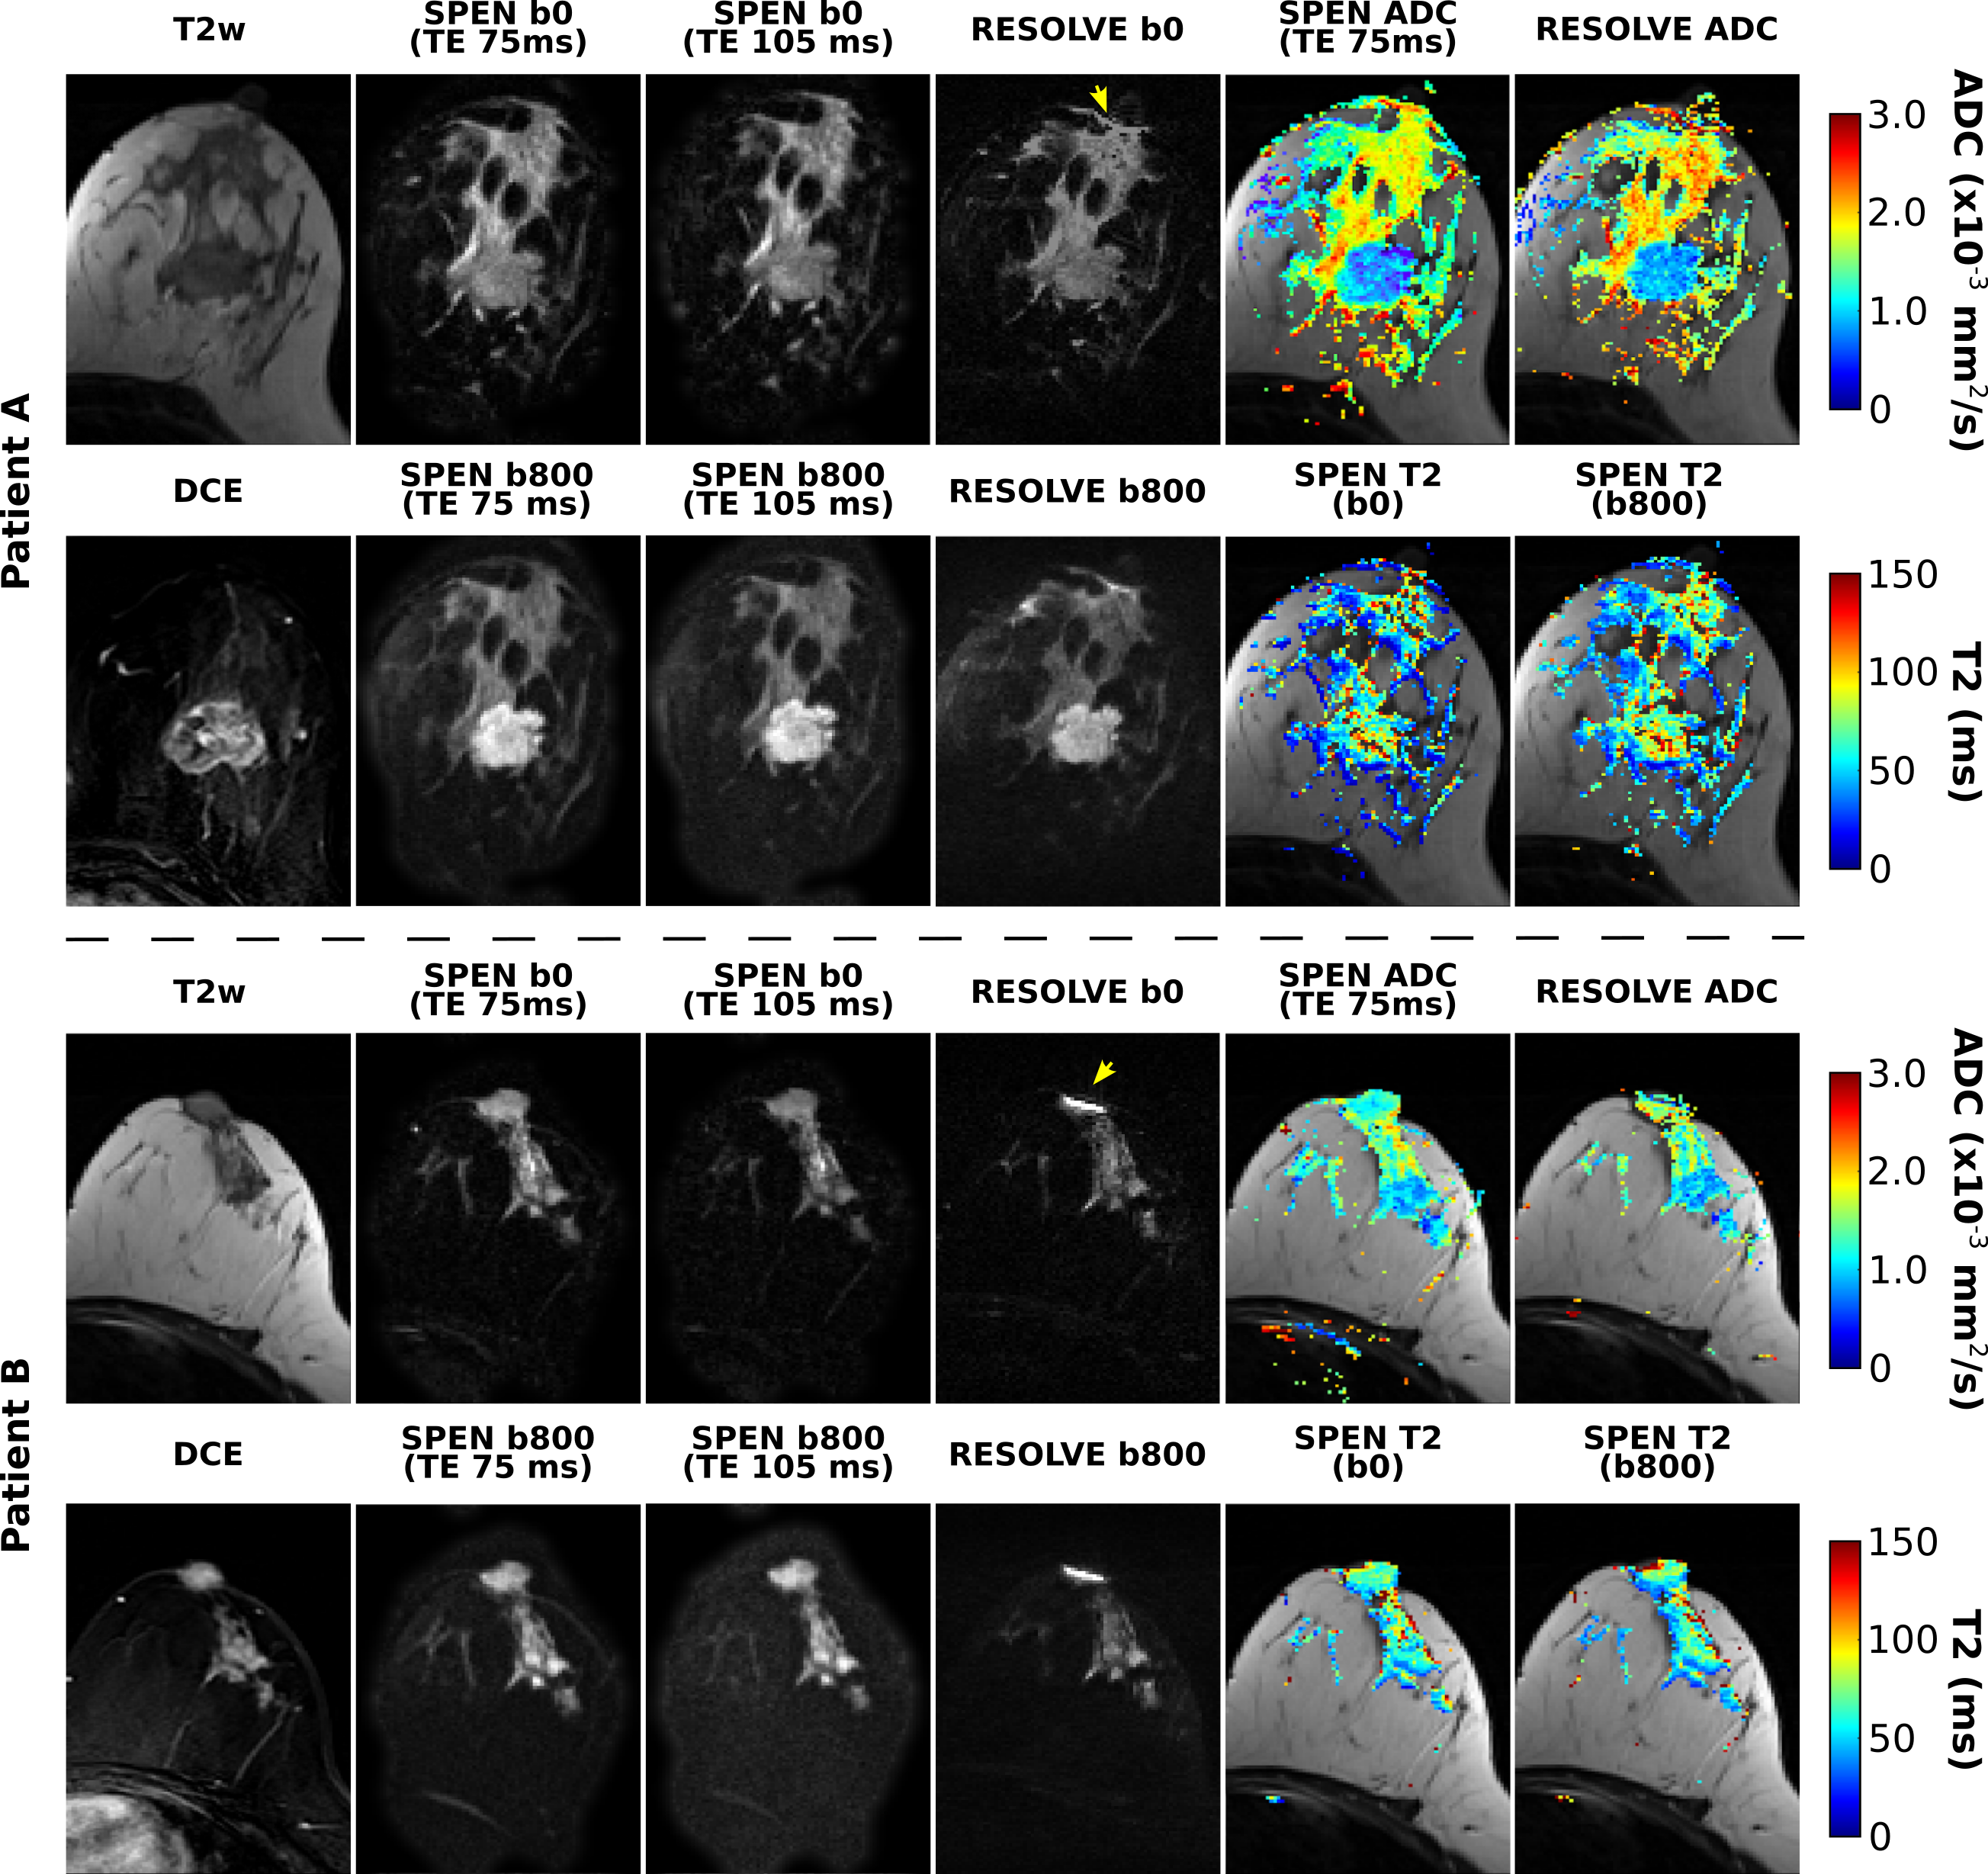
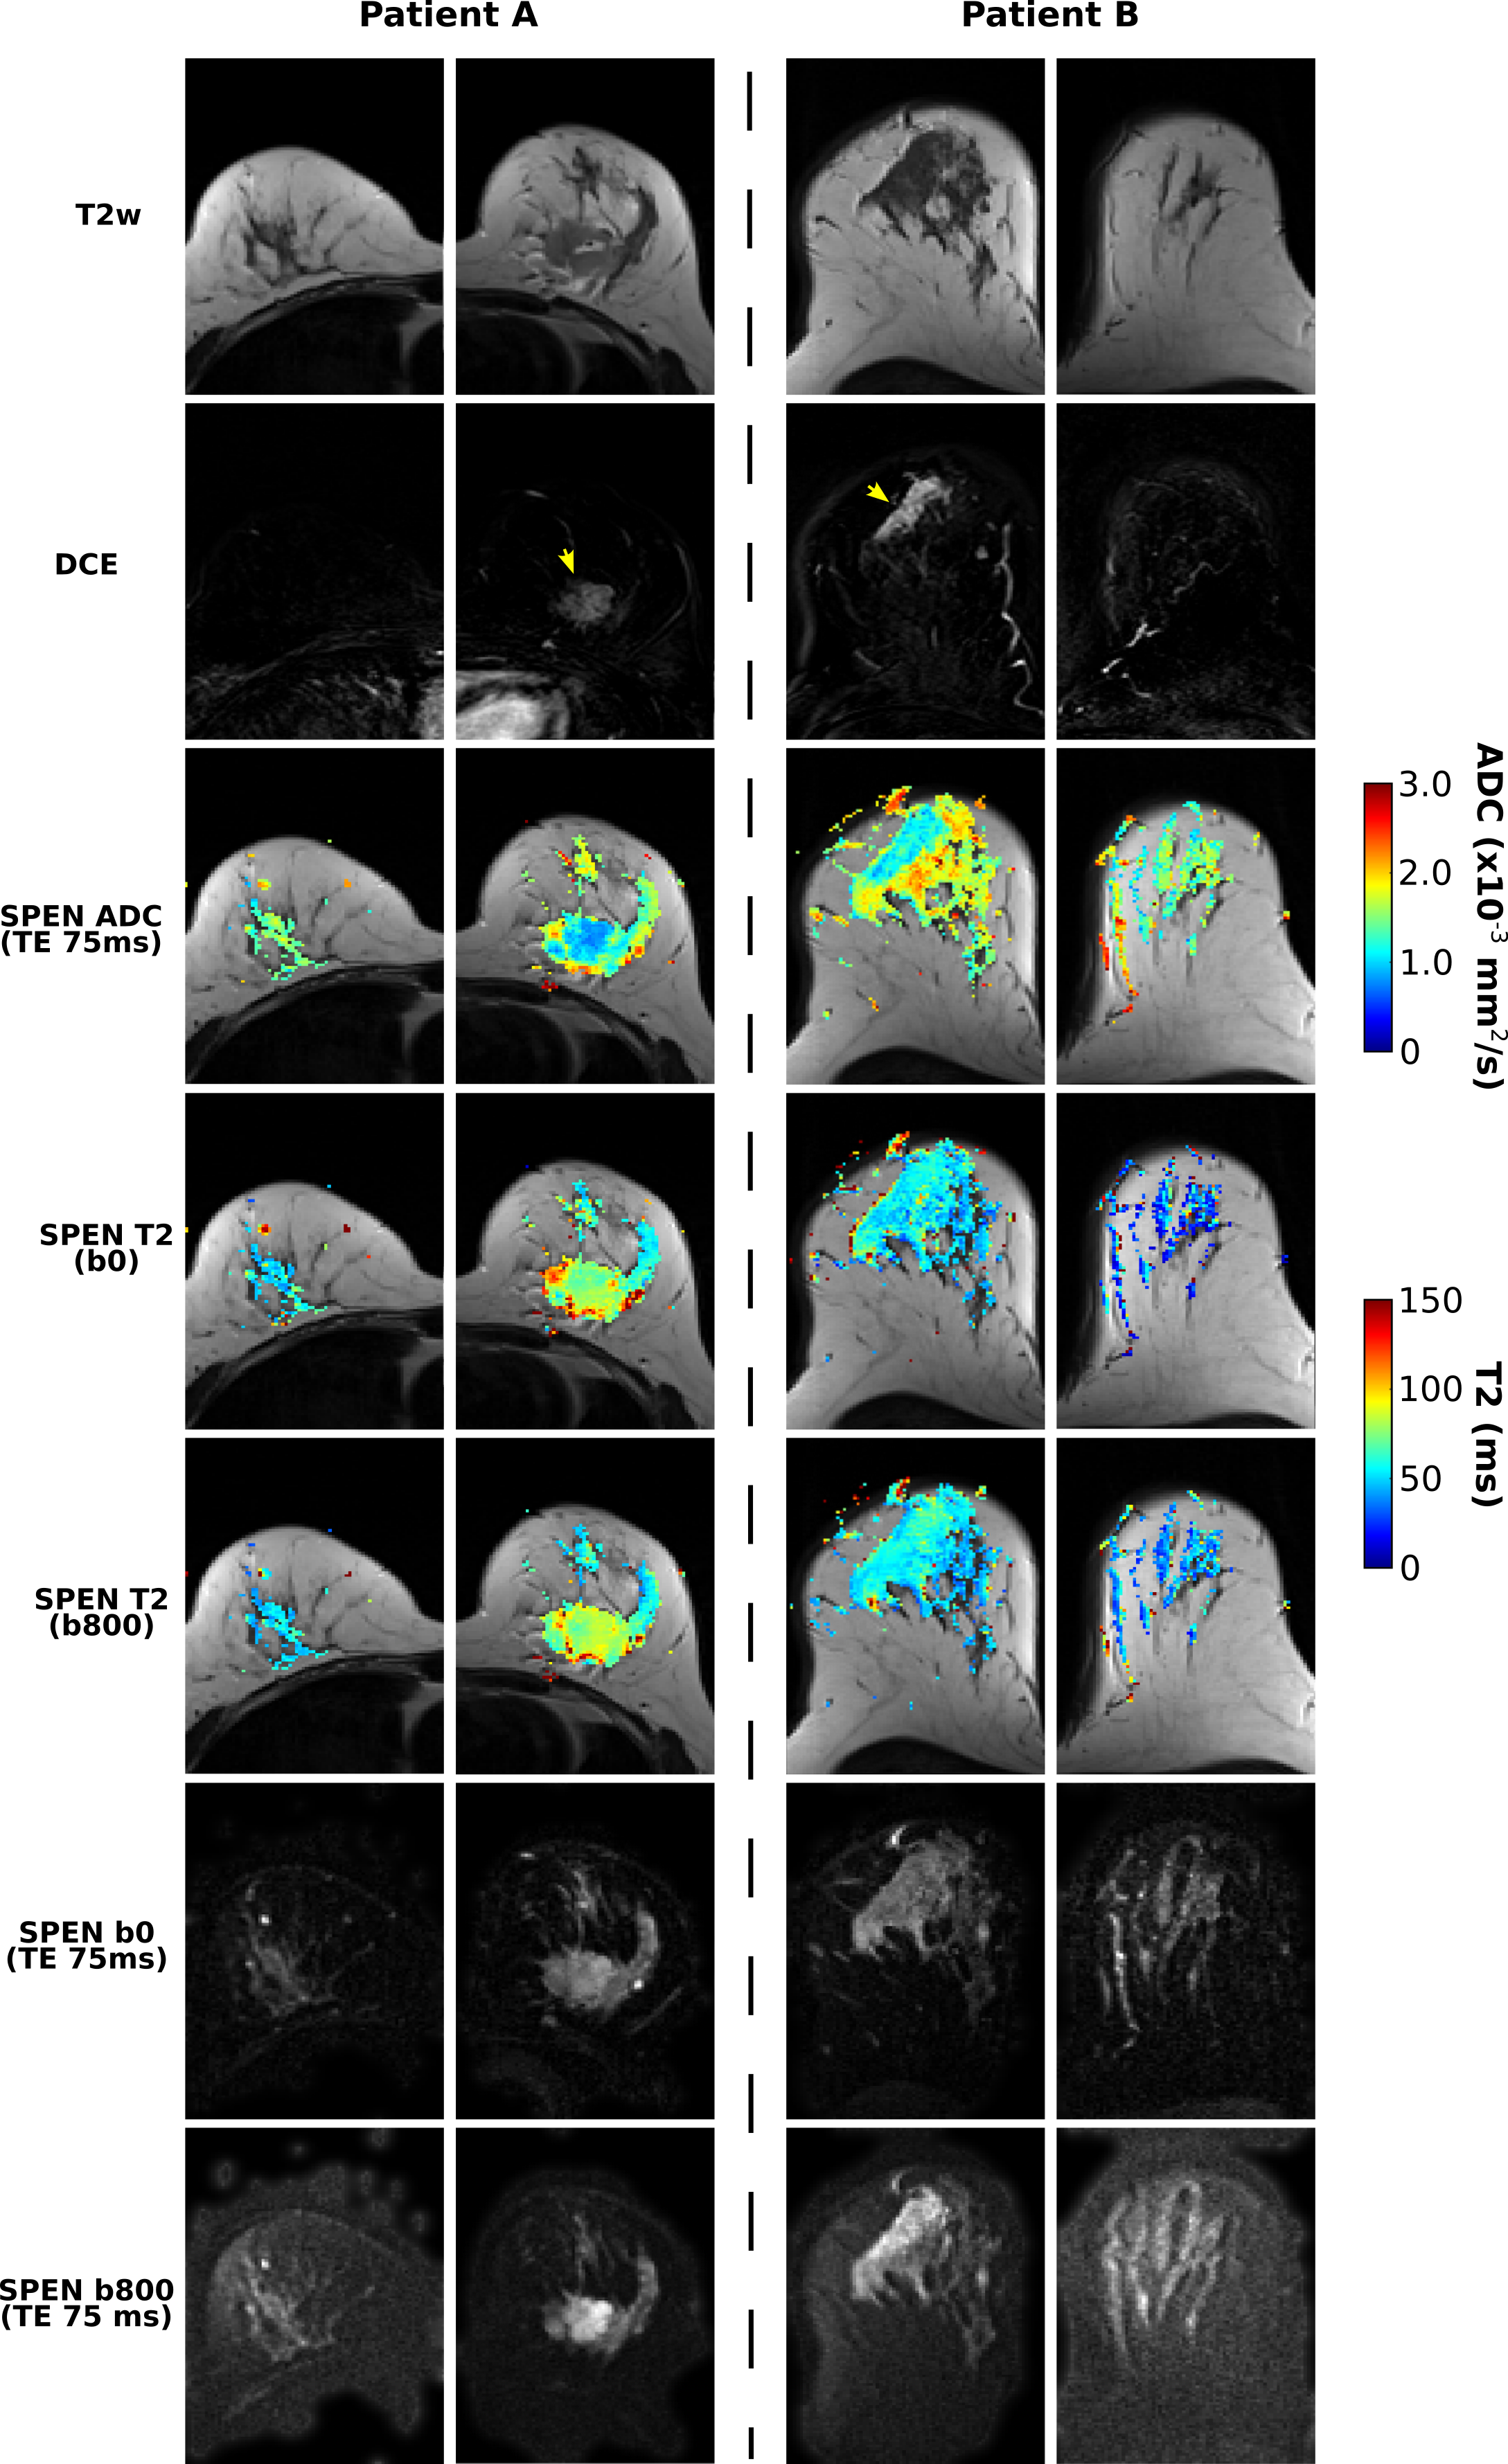
Figure 2 compares diffusivity- and TE-weighted images acquired for two breast cancer patients, using RESOLVE and SPEN MRI. RESOLVE generally showed lower immunity to susceptibility induced artifacts compared to SPEN, suffering from signal pile-up in the vicinity of nipples and in other regions.Figure 3 presents bilateral SPEN breast images along with corresponding ADC and T2 maps. These have good quality even after application of relatively strong diffusion encoding. Notice the attenuation of voxels with long T2 components arising upon comparing b=800 vs b=0 mm/s2 T2 maps, presumably reflecting the erasure of rapidly diffusing component (e.g., cystic regions) next to the tumors. No such behavior is evidenced in the healthy tissue T2 maps.
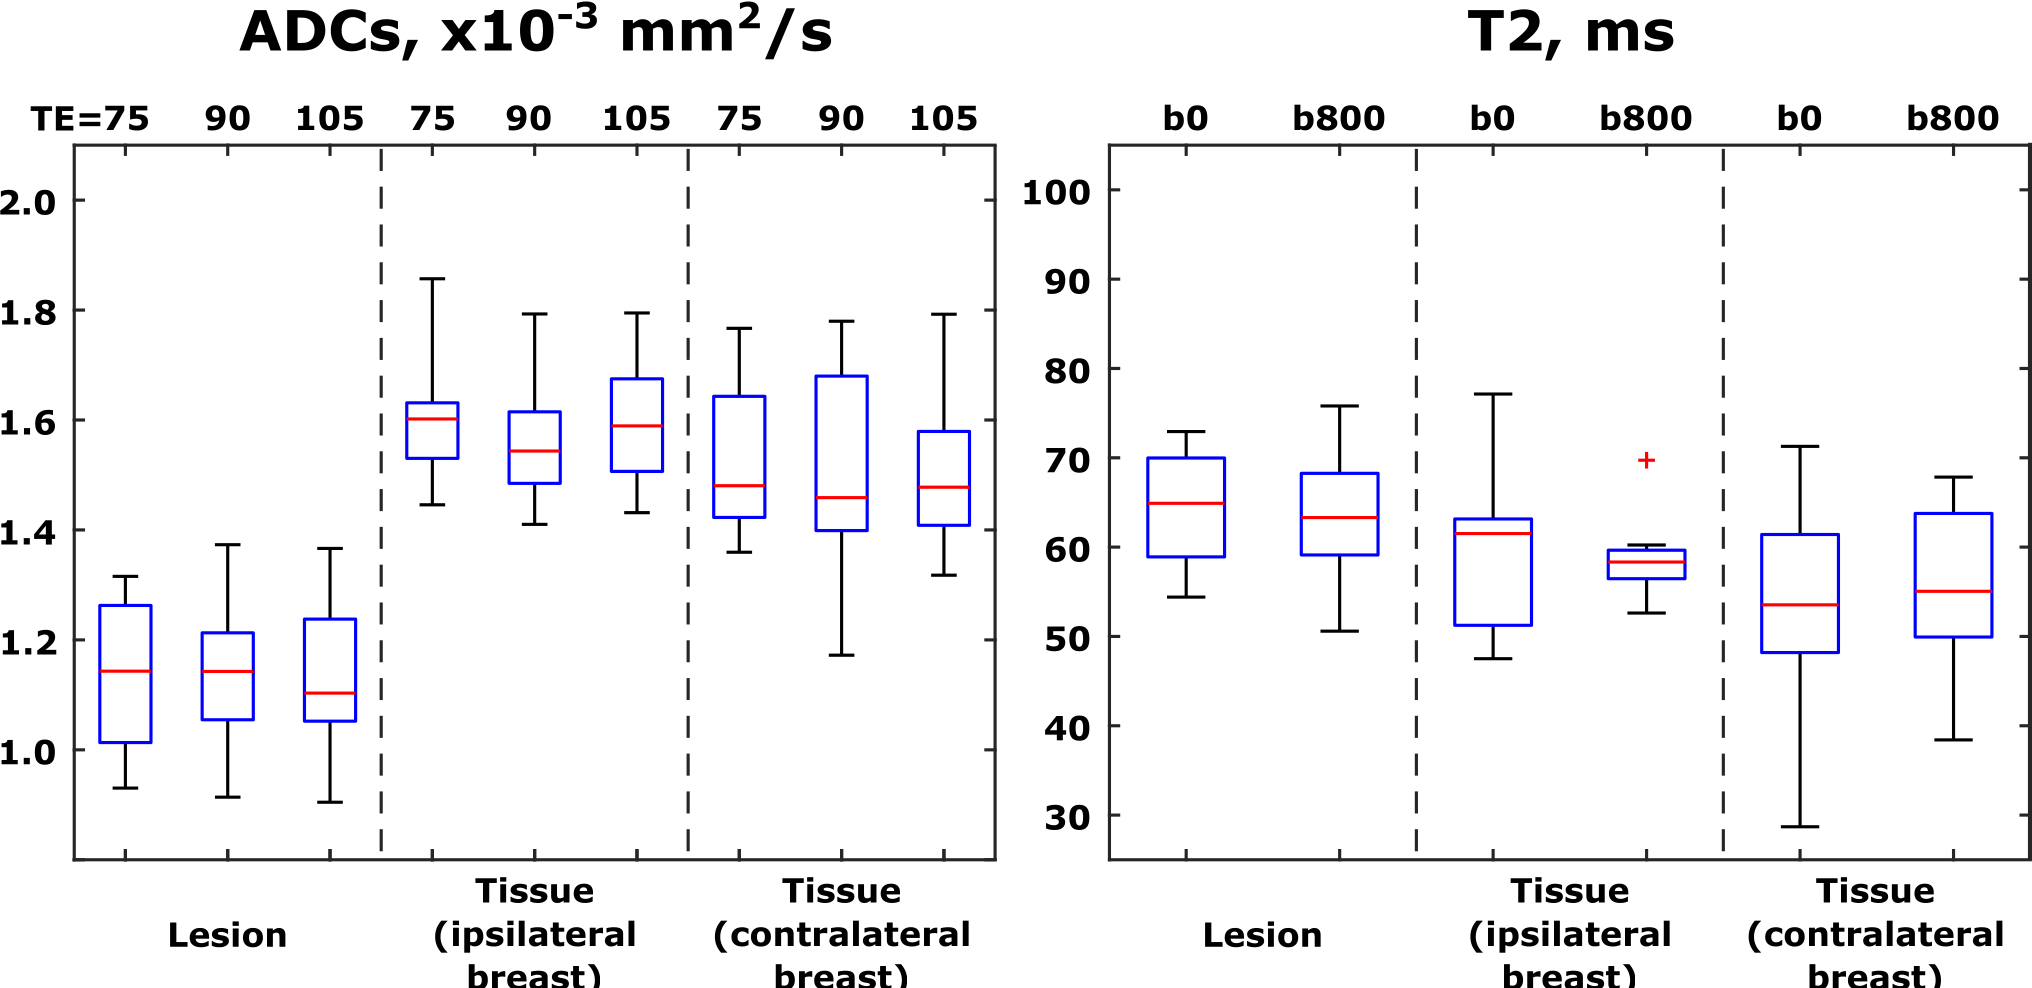
Figure 4 summarizes ADC and T2 values calculated from the various TE- and b-weighted scans, for all patients. Here, each of the patients contributed a single data point per boxplot, reflecting an average over the whole ROIs presented. As known from the literature, (19,20) ADC values provide clear diagnostic separation between healthy and cancerous tissue; while T2s of lesions are on average longer than those of healthier tissues, this discriminating ability is clearly inferior to that provided by ADCs.
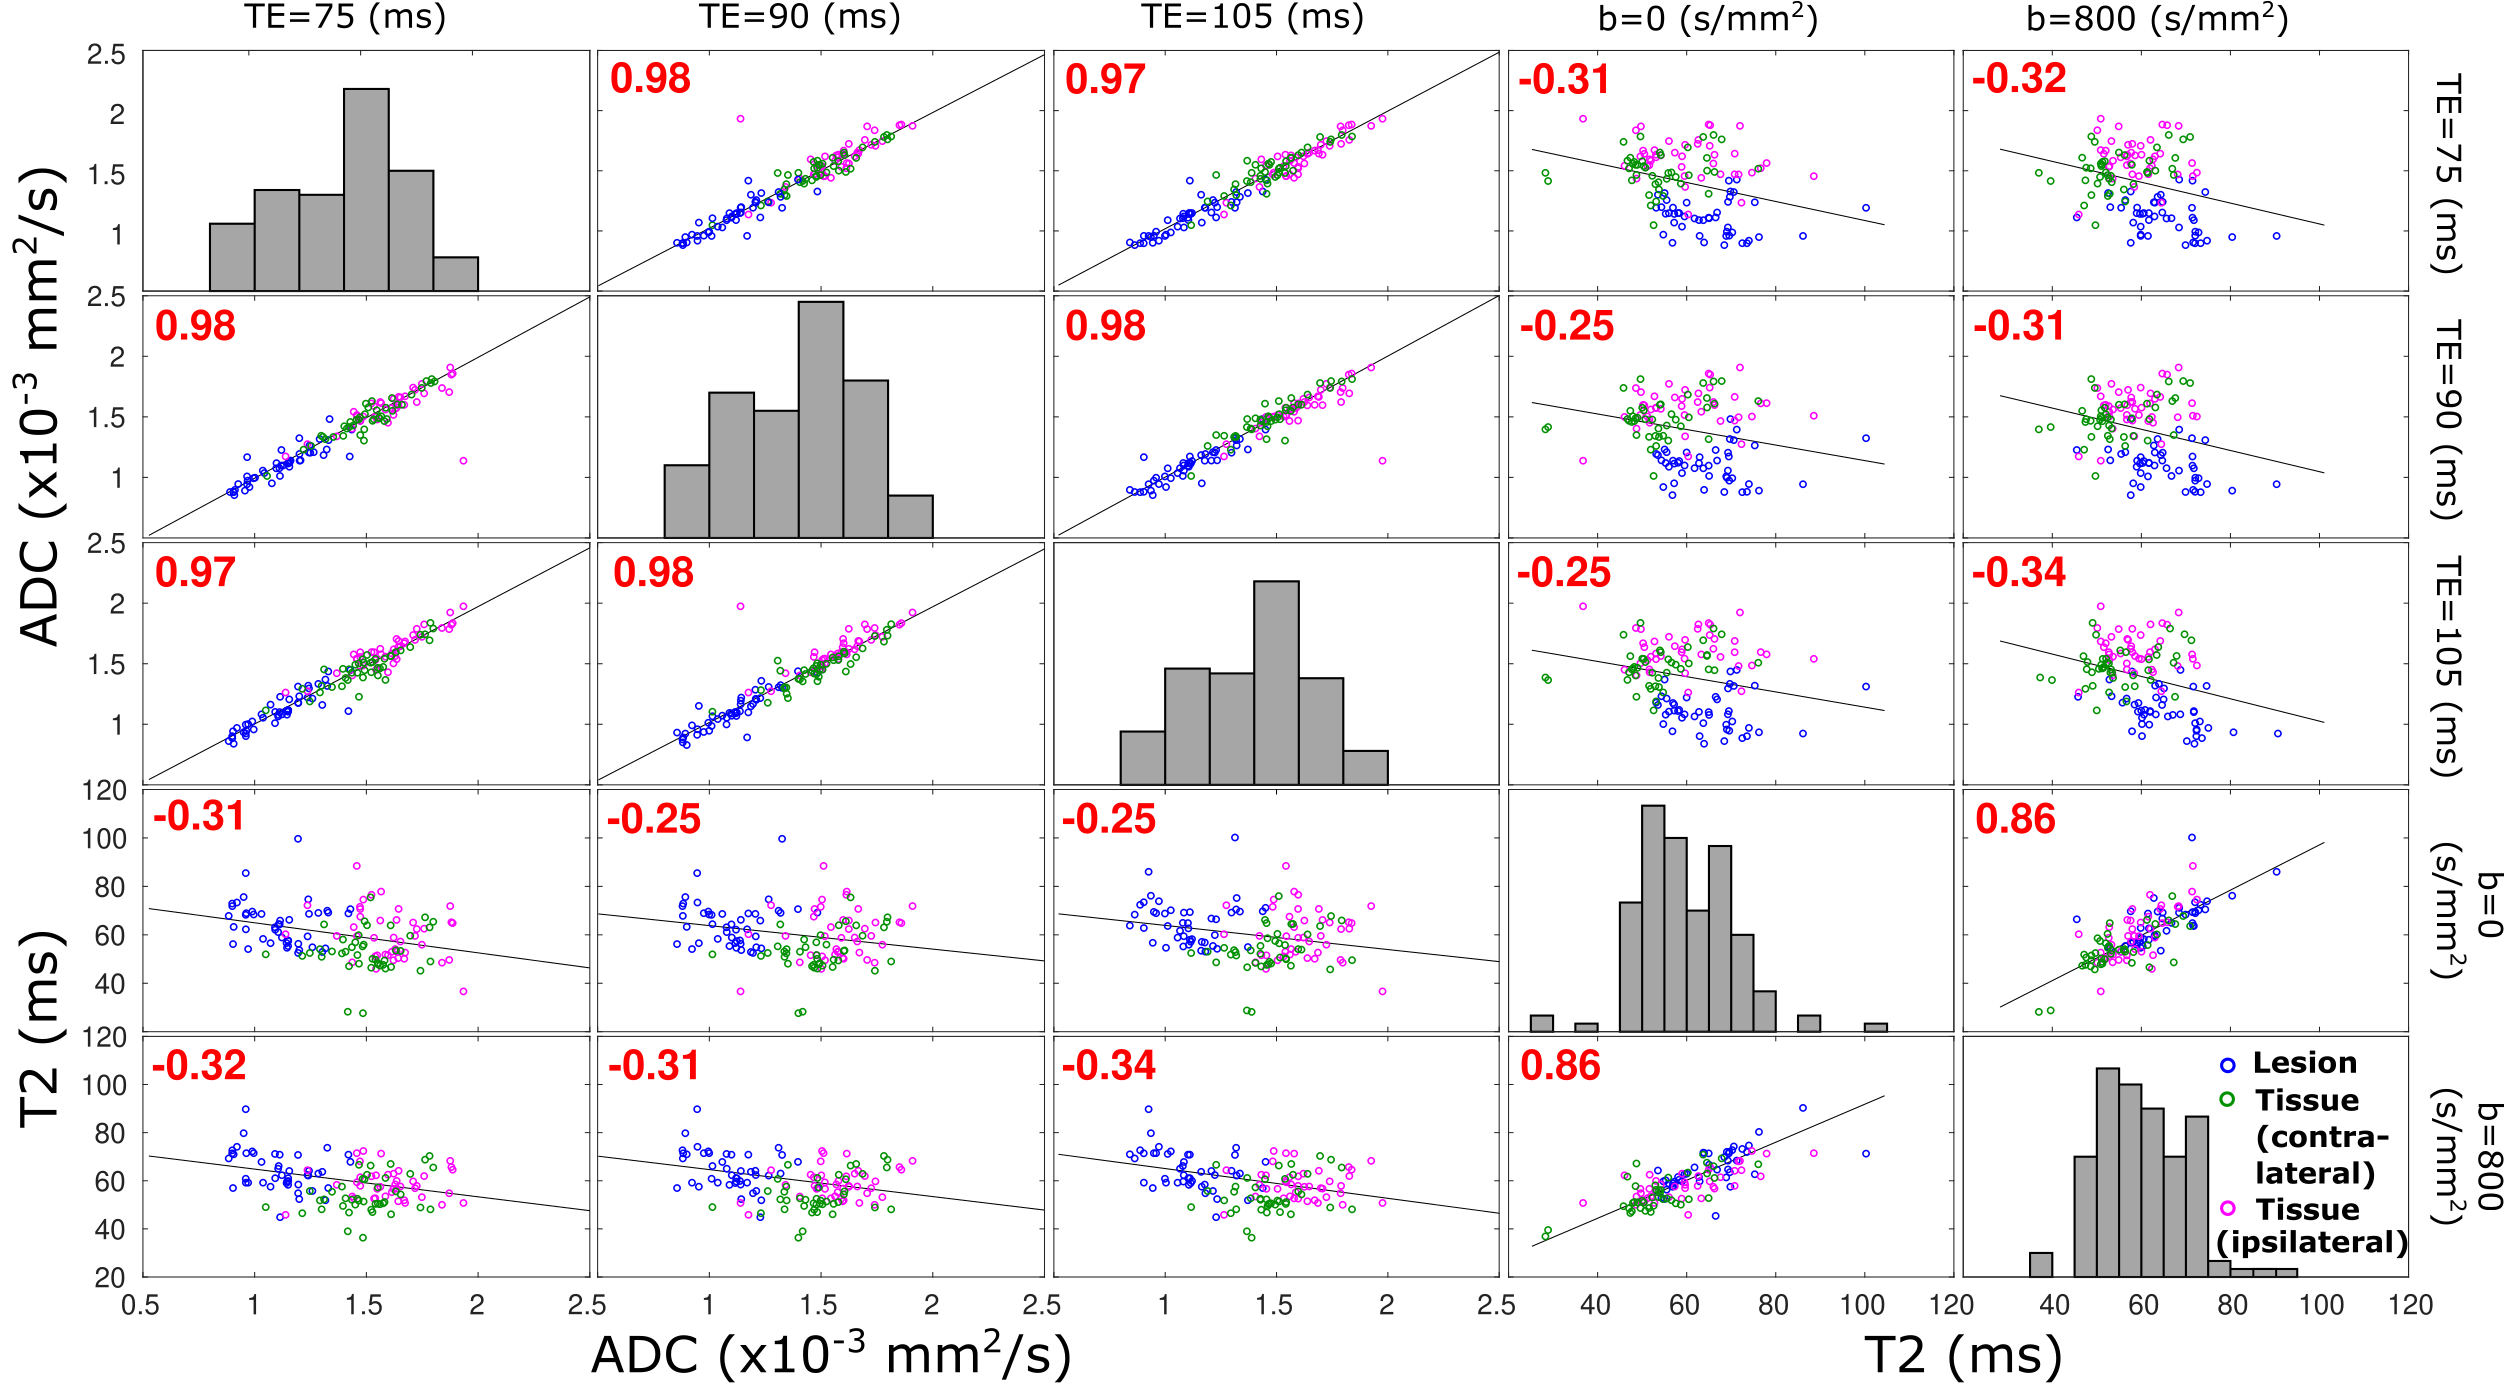
Figure 5 assesses correlations between the T2 and ADC values for different voxels. An almost perfect correlation exists between ADC values derived at different TEs. Weaker correlations are observed between T2 values derived for different b-weightings, reflecting how the latter assists in differentiating compartments with faster/slower diffusing components, by removing the formers’ contributions from the apparent T2 values. As ideally best discrimination arises from parameters that are anticorrelated, this T2/ADC discrimination suggests that there is potential for a more accurate detection of breast cancer lesions by the combined measurement of these non-redundant reporters. Notice as well the anticorrelation between ADC and T2 values arising upon plotting these against one another, suggesting that –sensitivity aside– best discrimination between malignant tissues characterized by slow diffusion and longer relaxation times would benefit from strong b-weighting and long echo times.
Conclusion
The potential of SPEN-based T2 and ADC correlative mapping was here explored on a breast cancer patient cohort. Essentially artifact-free DW images and ADC and T2 maps delivered by SPEN demonstrate this method’s robustness even during these relatively long acquisitions. The presented data suggest potential value of combined use of T2 and ADC mapping, for an improved breast lesion detection and characterization.Acknowledgements
Support from the Minerva Foundation (Germany), the Israel Science Foundation, and the Clore Institute for Magnetic Resonance (Weizmann Institute), are acknowledged.References
1. Baltzer P, Mann RM, Iima M, et al. Diffusion-weighted imaging of the breast-a consensus and mission statement from the EUSOBI International Breast Diffusion-Weighted Imaging working group. Eur. Radiol. 2020;30:1436–1450.
2. Tan PC, Pickles MD, Lowry M, Manton DJ, Turnbull LW. Lesion T(2) relaxation times and volumes predict the response of malignant breast lesions to neoadjuvant chemotherapy. Magn. Reson. Imaging 2008;26:26–34.
3. Manton DJ, Chaturvedi A, Hubbard A, et al. Neoadjuvant chemotherapy in breast cancer: early response prediction with quantitative MR imaging and spectroscopy. Br. J. Cancer 2006;94:427–435.
4. Du S, Gao S, Zhao R, et al. Contrast-free MRI quantitative parameters for early prediction of pathological response to neoadjuvant chemotherapy in breast cancer. Eur. Radiol. 2022;32:5759–5772.
5. Wang S, Peng Y, Medved M, et al. Hybrid multidimensional T(2) and diffusion-weighted MRI for prostate cancer detection. J. Magn. Reson. Imaging 2014;39:781–788.
6. Sadinski M, Karczmar G, Peng Y, et al. Pilot Study of the Use of Hybrid Multidimensional T2-Weighted Imaging-DWI for the Diagnosis of Prostate Cancer and Evaluation of Gleason Score. AJR Am J Roentgenol 2016;207:592–598.
7. Syversen IF, Elschot M, Sandsmark E, Bertilsson H, Bathen TF, Goa PE. Exploring the diagnostic potential of adding T2 dependence in diffusion-weighted MR imaging of the prostate. PLoS ONE 2021;16:e0252387.
8. Shrot Y, Frydman L. Spatially encoded NMR and the acquisition of 2D magnetic resonance images within a single scan. J. Magn. Reson. 2005;172:179–190.
9. Tal A, Frydman L. Single-scan multidimensional magnetic resonance. Prog. nucl. magn. reson. spectrosc. 2010;57:241–292.
10. Ben-Eliezer N, Shrot Y, Frydman L. High-definition, single-scan 2D MRI in inhomogeneous fields using spatial encoding methods. Magn. Reson. Imaging 2010;28:77–86.
11. Ben-Eliezer N, Solomon E, Harel E, Nevo N, Frydman L. Fully refocused multi-shot spatiotemporally encoded MRI: robust imaging in the presence of metallic implants. MAGMA 2012;25:433–442.
12. Schmidt R, Frydman L. New spatiotemporal approaches for fully refocused, multislice ultrafast 2D MRI. Magn. Reson. Med. 2014;71:711–722.
13. Solomon E, Liberman G, Nissan N, Furman-Haran E, Sklair-Levy M, Frydman L. Diffusion-weighted breast MRI of malignancies with submillimeter resolution and immunity to artifacts by spatiotemporal encoding at 3T. Magn. Reson. Med. 2020;84:1391–1403.
14. Solomon E, Nissan N, Furman-Haran E, et al. Overcoming limitations in diffusion-weighted MRI of breast by spatio-temporal encoding. Magn. Reson. Med. 2015;73:2163–2173.
15. Bao Q, Ma L, Liberman G, Solomon E, Martinho RP, Frydman L. Dynamic T2 mapping by multi-spin-echo spatiotemporal encoding. Magn. Reson. Med. 2020;84:895–907.
16. Schmidt R, Baishya B, Ben-Eliezer N, Seginer A, Frydman L. Super-resolved parallel MRI by spatiotemporal encoding. Magn. Reson. Imaging 2014;32:60–70.
17. Porter DA, Heidemann RM. High resolution diffusion-weighted imaging using readout-segmented echo-planar imaging, parallel imaging and a two-dimensional navigator-based reacquisition. Magn. Reson. Med. 2009;62:468–475.
18. Schmidt R, Seginer A, Frydman L. Interleaved multishot imaging by spatiotemporal encoding: A fast, self-referenced method for high-definition diffusion and functional MRI. Magn. Reson. Med. 2016;75:1935–1948.
19. Partridge SC, Rahbar H, Murthy R, et al. Improved diagnostic accuracy of breast MRI through combined apparent diffusion coefficients and dynamic contrast-enhanced kinetics. Magn. Reson. Med. 2011;65:1759–1767.
20. Guo Y, Cai Y-Q, Cai Z-L, et al. Differentiation of clinically benign and malignant breast lesions using diffusion-weighted imaging. J. Magn. Reson. Imaging 2002;16:172–178.
Figures