0189
High spatial resolution quantitative susceptibility mapping using in-phase echoes enables the depiction of breast microcalcifications1Department of Diagnostic and Interventional Radiology, School of Medicine, Klinikum rechts der Isar, Technical University of Munich, Munich, Germany, 2Philips GmbH Market DACH, Hamburg, Germany, 3Philips Research, Hamburg, Germany
Synopsis
Keywords: Breast, Susceptibility
Breast microcalcifications (MCs) can be the only sign of carcinoma and other precursor lesions of breast cancer in x-ray mammography. Mammography is routinely used for population-based breast cancer screening. However, due to the ionizing nature of x-ray radiation, the use of an MR-based technique would be desirable for repeated examinations especially in screening targeted sub-cohorts at high-risk or younger women. In this work, we present initial results on the visualization of MCs using MR with an optimized high-resolution GRE-scan and quantitative susceptibility mapping. The proposed methodology allows for the robust visualization of MC clusters in MR for the first time.Introduction
Breast microcalcifications (MCs) detected by mammography account for$$$\,$$$the detection of 30-50% of early stage malignant breast tumors1. X-ray based mammography is$$$\,$$$currently considered “gold standard” for detection and characterization of MCs due$$$\,$$$to$$$\,$$$its excellent contrast of calcified structures. Nevertheless, the real$$$\,$$$amount and extend of MCs in clinical routine mammography can be missed and additional examinations can be necessary2. However, a$$$\,$$$ionizing radiation free MR-based method would be desirable especially in sub-cohorts at$$$\,$$$high-risk or young age. Unfortunately, existing clinical breast MRI examinations cannot detect and characterize breast calcifications. Quantitative susceptibility mapping (QSM) allows for$$$\,$$$the assessment of calcified structures in MR and some works have reported on the visualization of benign macro-calcifications3,4,5 which are considerably larger than MCs. Hence, a$$$\,$$$high resolution scan$$$\,$$$is necessary for$$$\,$$$the visualization of$$$\,$$$MCs. However, the acquisition time of QSM data in the body is notoriously long due to the presence of fat and the associated need to acquire several echo times6,7. Recently, the use of effective multipeak in-phase echo times has been proposed for$$$\,$$$QSM in$$$\,$$$fat regions which allow for the removal of$$$\,$$$the$$$\,$$$fat phase contribution from the fieldmap by choosing the echo$$$\,$$$times carefully8. The optimized echo times allow for considerably faster QSM acquisition in body regions. Consequently, this work proposes the use of effective multipeak in-phase echo times$$$\,$$$to obtain high resolution QSM maps in$$$\,$$$the breast and evaluate the obtained maps in$$$\,$$$patients with respect to their ability$$$\,$$$to visualize clusters of (suspicious) MCs and distinguish them from benign macro-calcifications.Methods
In vivo measurements7$$$\,$$$patients with either a history of or at high-risk to develop breast cancer$$$\,$$$were scanned with a multi-echo gradient-echo (GRE) sequence. Scanning$$$\,$$$was performed on a 3T scanner (Ingenia, Philips Healthcare, Best, The Netherlands). In$$$\,$$$the patient study, only data was included from patients who received a mammography within 30$$$\,$$$days before or after the MRI. For the high resolution QSM scan, the imaging parameters were set to TE=[4.6,9.17]ms, FA=12, readout-direction=anterior-posterior, FOV=220×382×192mm3, TR=10ms, compressed sense acceleration R=6, and$$$\,$$$an isotropic voxel-size of 0.6mm3. Multi-echo images were reconstructed online$$$\,$$$using the vendor’s Compressed SENSE reconstruction.
QSM Processing
For$$$\,$$$the fieldmap estimation a hierarchical multi-resolution graph-cut was used$$$\,$$$that yields an unwrapped fieldmap9. For the field-to-susceptibility inversion a nonlinear preconditioned total field inversion algorithm was employed which minimizes the following cost function10:$$y=\underset{y'}{\arg\min}\left|\left|{W}(e^{id*Py'}-e^{i\alpha{f_b}})\right|\right|_2^2+\lambda||M_g\nabla{Py'}||_1,$$where $$$W$$$ is the magnitude weighting, $$$d$$$ the dipole kernel, $$$P$$$ the preconditioner, $$$\alpha$$$ a scalar value that scales the fieldmap $$$f_{b}$$$ to avoid phase wraps, $$$M_{G}$$$ a MEDI-like edge mask and the gradient operator $$$\nabla$$$. The final QSM map was computed as $$$\chi=\frac{1}{\alpha}Py$$$. The regularization parameter $$$\lambda$$$ was determined by$$$\,$$$a l-curve analysis of$$$\,$$$one scan and was fixed for$$$\,$$$all subjects to 0.003.
Radiological evaluation
The QSM maps derived from the patient scans were evaluated by$$$\,$$$a radiologist (board-certified with 24 years of experience) with respect to their ability to visualize suspicious clusters of MCs. The QSM maps were used as$$$\,$$$a qualitative map and$$$\,$$$in the reading the color bar$$$\,$$$limits where continuously adjusted for the$$$\,$$$best visualization of calcified structures.
Results
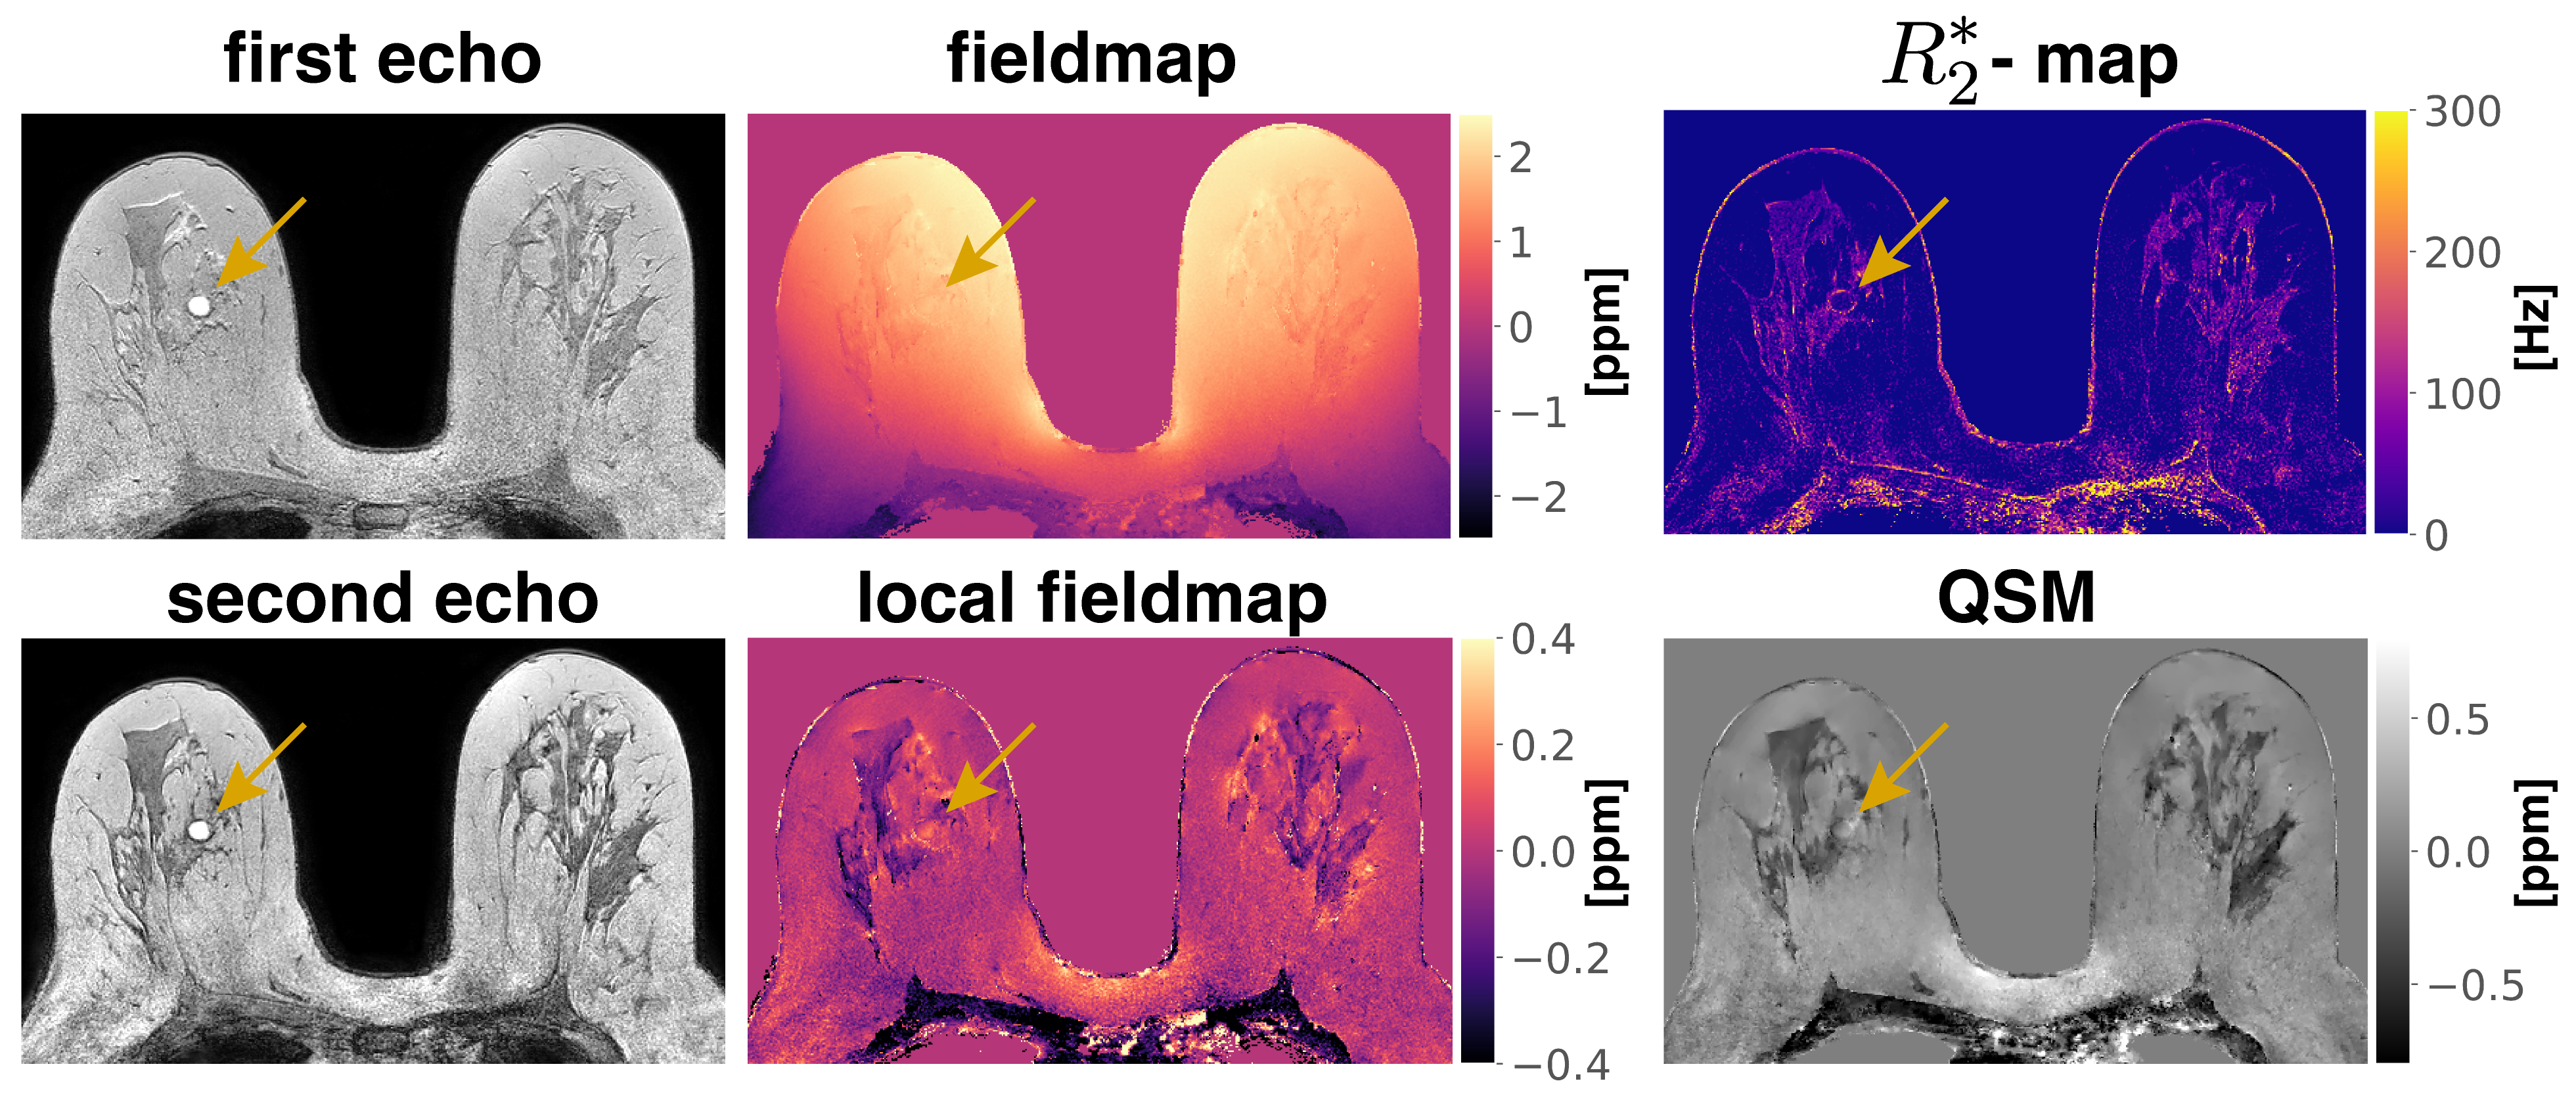
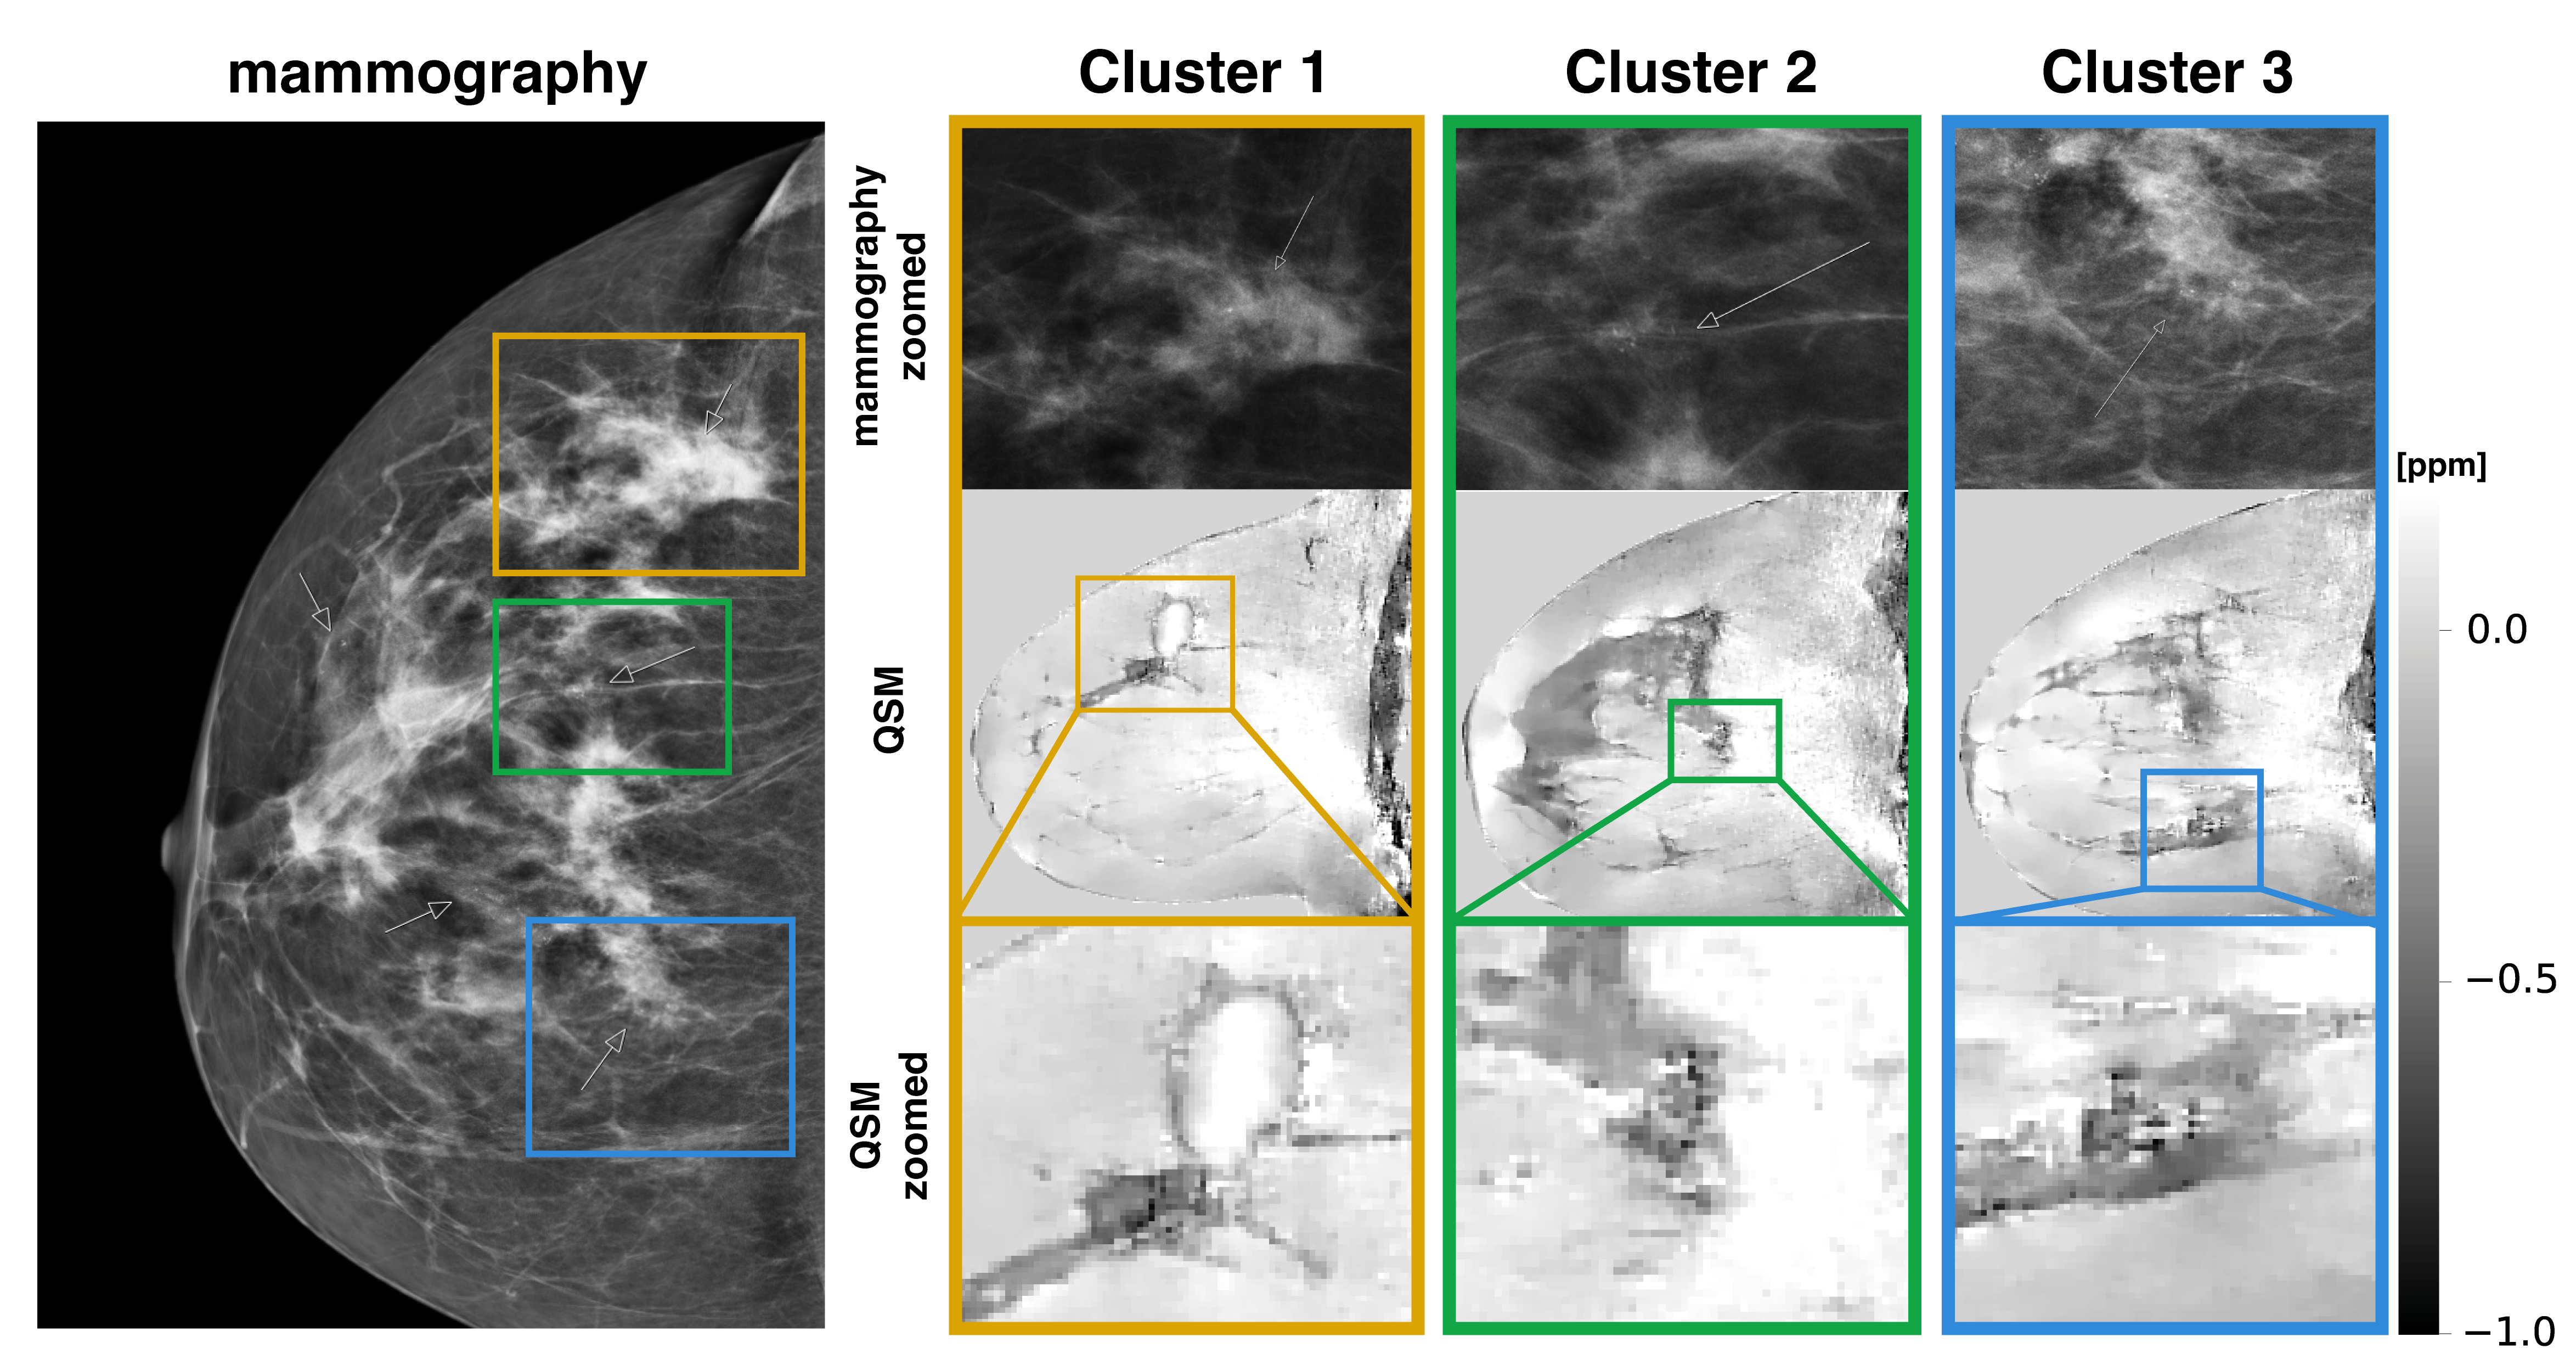
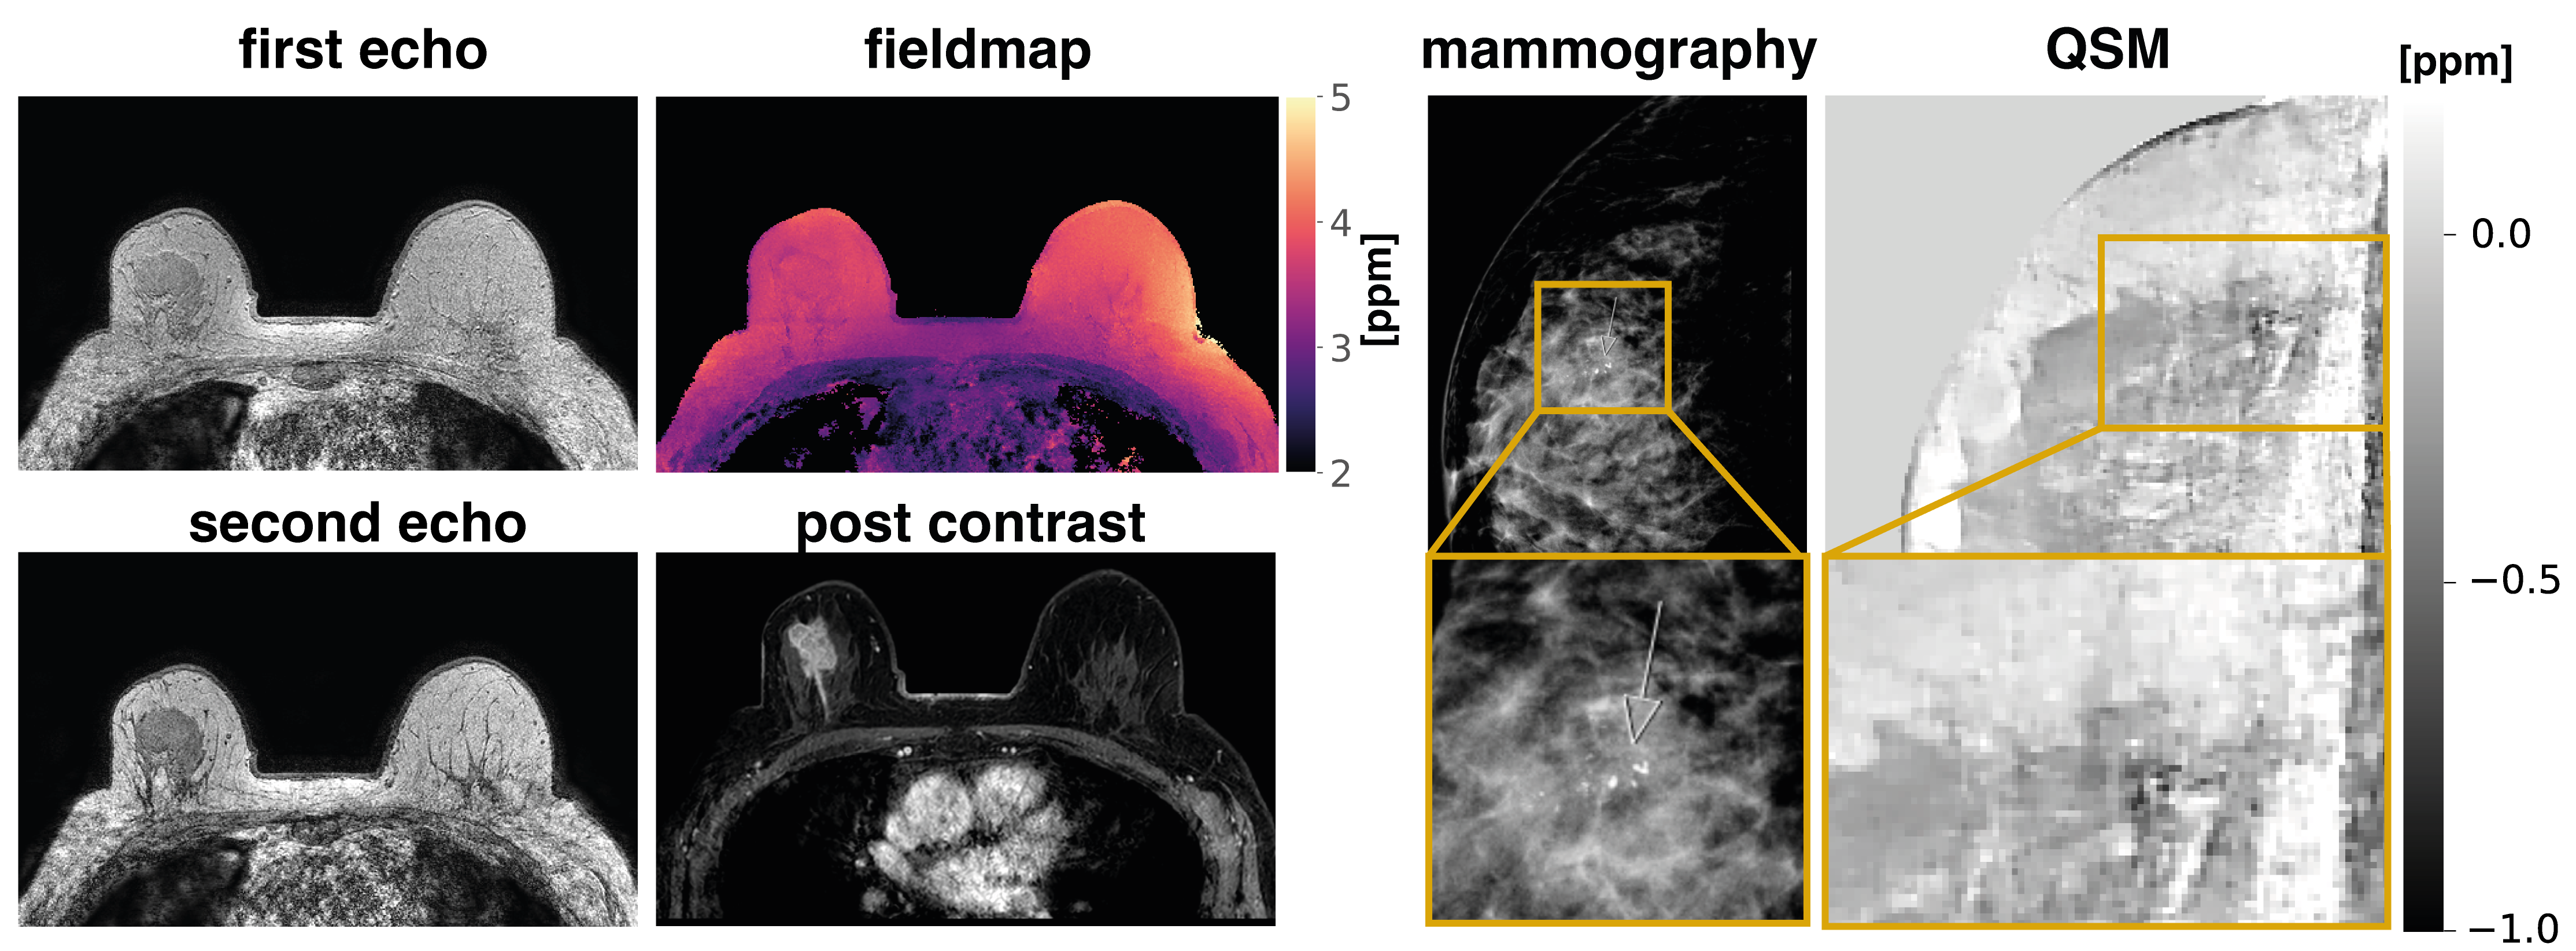
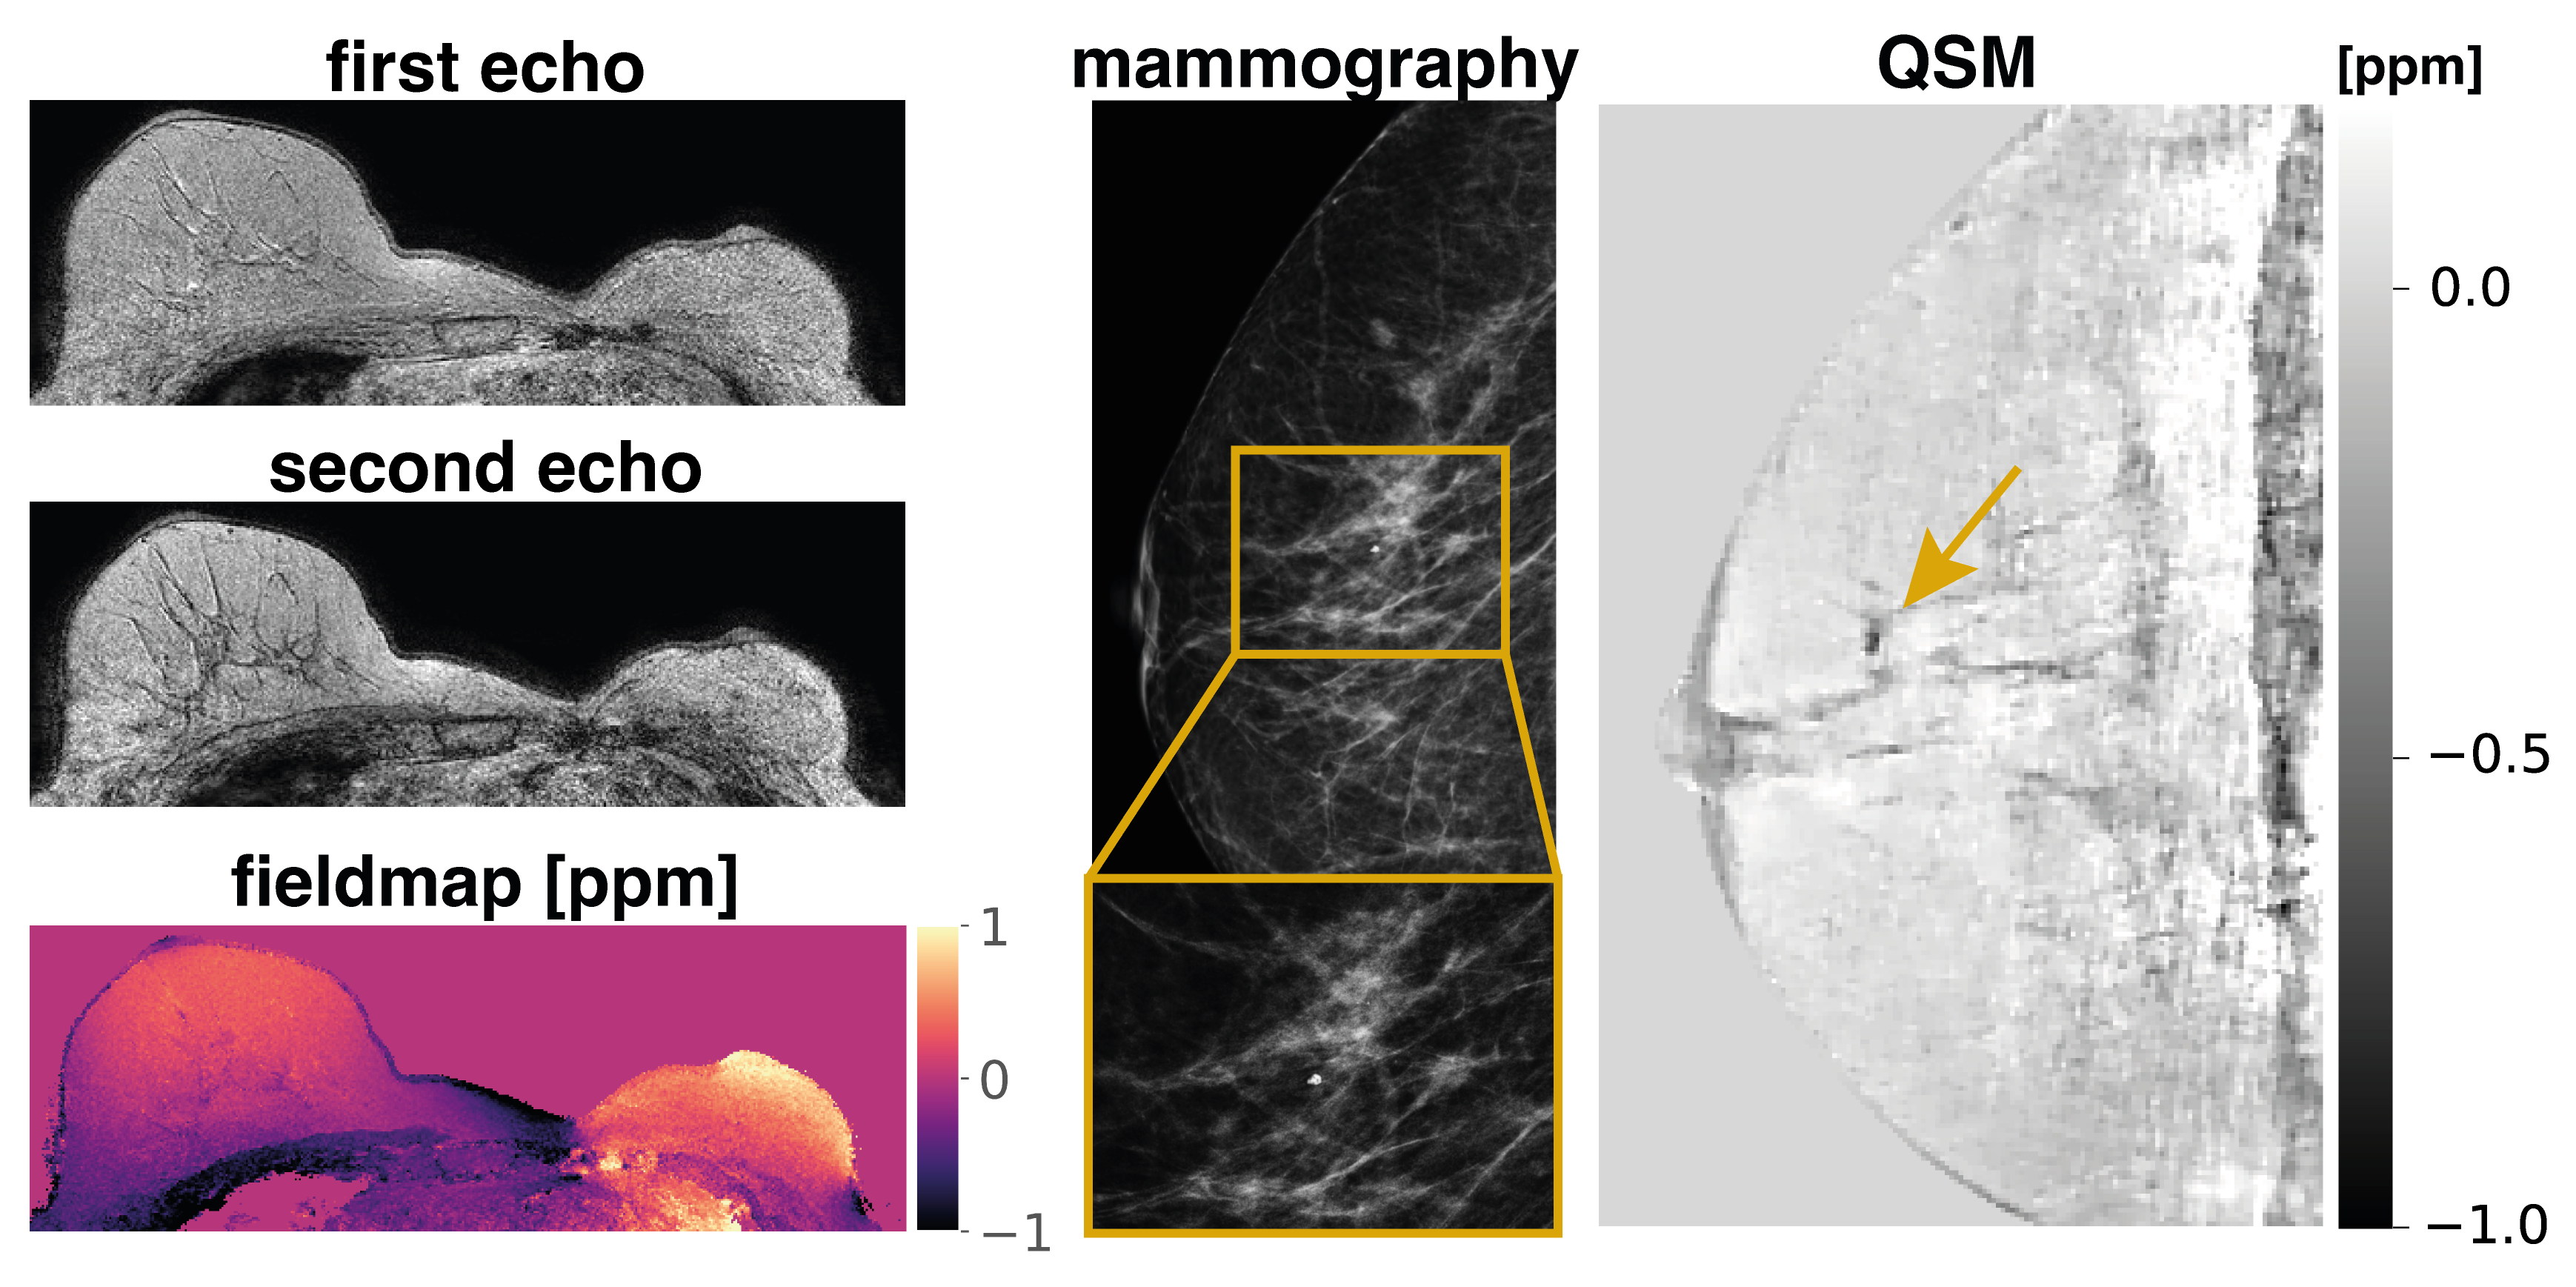
Fig.1$$$\,$$$shows the$$$\,$$$magnitude data and$$$\,$$$estimated parameter maps of the high resolution effective in-phase scan.$$$\,$$$The effective in-phase echoes allow for a$$$\,$$$bias-free high resolution 2 echo QSM acquisition in body regions,$$$\,$$$also enabling $$$R_2^*$$$ estimation. Fig.2 reveals the ability of the high resolution QSM maps to reveal clusters of MCs. Due to the tomographic nature of the QSM data, more$$$\,$$$MCs were detected by the radiologist in the MR scan than$$$\,$$$in the x-ray mammography. Fig.3 shows the$$$\,$$$results in a patient with a suspicious cluster of MCs in the right breast. QSM is able$$$\,$$$to visualize the cluster in good agreement with the mammography. A dynamic contrast-enhanced scan$$$\,$$$reveals breast cancer in close proximity to the suspicious MCs. The high resolution QSM scan furthermore allows for the robust delineation of benign macrocalcifications (Fig.4). In the reading of the QSM maps of the 7 patients, 4 scans could correctly be identified to contain suspicious MCs while 3 scans were correctly identified to only contain benign micro- and macrocalcifications.Discussion
When using$$$\,$$$effective in-phase echoes for QSM in body regions, the phase of the fat is presently accounted for by the optimized echo time selection.$$$\,$$$Consequently, the water and$$$\,$$$fat do not need to$$$\,$$$be separated as conventionally done for QSM in the$$$\,$$$body. This approach allows for the reduction of necessary echoes$$$\,$$$to the present dual echo acquisition and ultimately$$$\,$$$for the possibility to obtain high resolution QSM in a significantly shorter scan time. However, the low SNR is an increasing issue at the employed resolution$$$\,$$$and was addressed by an larger flip angle. Furthermore a$$$\,$$$non linear formulation of the QSM inversion is used which is$$$\,$$$known to have an improved performance in$$$\,$$$low SNR regions11. Even$$$\,$$$in subjects with a low breast volume and an associated increase in distance from the rigid breast coils, a robust visualization of MCs was$$$\,$$$possible.Conclusion
The$$$\,$$$use of a high resolution effective in-phase GRE acquisition and subsequent QSM was proposed for the assessment of suspicious MCs in the breast. Based$$$\,$$$on the proposed QSM maps, a radiologist was able to distinguish clusters of MCs, suspicious for malignant breast lesions, from single benign micro- and macrocalcifications.$$$\,$$$Due to the tomographic nature of the QSM maps, more calcifications were visible in the MR images hence additionally$$$\,$$$overcoming the limitation of x-ray mammographic projections where$$$\,$$$very small calcifications can be missed due to poor signal-to-noise ratio in standard planes.Acknowledgements
The present work was supported by the European Research Council (grant agreement No 677661, ProFatMRI). The authors also acknowledge research sup-port from Philips Healthcare.References
1Logullo AF, Prigenzi KCK, Nimir CCBA, Franco AFV, Campos MSDA.Breast microcalcifications: Past, present and future (Review). Mol ClinOncol 2022; 16:81.
2Fallenberg E, Dimitrijevic L, Diekmann F, Diekmann S, Kettritz U,Poellinger A, Bick U, Winzer K, Engelken F, Renz D. Impact of Magnifica-tion Views on the Characterization of Microcalcifications in Digital Mam-mography. RöFo - Fortschritte auf dem Gebiet der Röntgenstrahlen undder bildgebenden Verfahren 2013; 186:274–280. 10.1055/s-0033-1350572.
3Dimov AV, Liu T, Spincemaille P, Ecanow JS, Tan H, Edelman RR,Wang Y. Joint Estimation of Chemical Shift and Quantitative Suscep-tibility Mapping (chemical QSM). Magnetic Resonance in Medicine 2014;73:2100–2110. 10.1002/mrm.25328.
4Schweser F, Hermann KH, Deistung A, Atterbury M, Baltzer PA, Burmeis-ter HP, Kaiser WA, Reichenbach JR. Quantitative Magnetic SusceptibilityMapping (QSM) in Breast Disease Reveals Additional Information for MR-Based Characterization of Carcinoma Calcification. In: Proceedings 19.Annual Meeting International Society for Magnetic Resonance in Medicine,Montreal, 2011. p. 1014.
5FatemiArdekani A, Boylan C, Noseworthy MD. Identification of breastcalcification using magnetic resonance imaging. Medical Physics 2009;36:5429–5436. https://doi.org/10.1118/1.3250860.
6Boehm C, Diefenbach MN, Makowski MR, Karampinos DC. ImprovedBody Quantitative Susceptibility Mapping By Using a Variable-layerSingle-min-cut Graph-cut for Field-mapping. Magnetic Resonance inMedicine 2020; nil:mrm.28515. 10.1002/mrm.28515.
7Boehm C, Sollmann N, Meineke J, Ruschke S, Dieckmeyer M, Weiss K, Zim-mer C, Makowski MR, Baum T, Karampinos DC. Preconditioned water-fattotal field inversion: Application to spine quantitative susceptibility map-ping. ; n/a. https://doi.org/10.1002/mrm.28903.
8Boehm C, Schlaeger S, Meineke J, Weiss K, Makowski MR,Karampinos DC. On the Water-Fat In-phase Assumption for Quantita-tive Susceptibility Mapping. Magnetic Resonance in Medicine 2022; nil:nil.10.1002/mrm.29516.
9Stelter JK, Boehm C, Ruschke S, Weiss K, Diefenbach MN, Wu M,Borde T, Schmidt GP, Makowski MR, Fallenberg EM, Karampinos DC.Hierarchical multi-resolution graph-cuts for water-fat-silicone separationin breast MRI. IEEE Transactions on Medical Imaging 2022; pp. 1–1.10.1109/TMI.2022.3180302.
10Nguyen TD, Wen Y, Du J, Liu Z, Gillen K, Spincemaille P, Gupta A,Yang Q, Wang Y. Quantitative Susceptibility Mapping of Carotid PlaquesUsing Nonlinear Total Field Inversion: Initial Experience in PatientsWith Significant Carotid Stenosis. Magnetic Resonance in Medicine 2020;84:1501–1509. 10.1002/mrm.28227.
11Liu T, Wisnieff C, Lou M, Chen W, Spincemaille P, Wang Y. Nonlinear For-mulation of the Magnetic Field To Source Relationship for Robust Quan-titative Susceptibility Mapping. Magnetic Resonance in Medicine 2012;69:467–476. 10.1002/mrm.24272.
Figures