0187
A voxel-wise composition ratio of DCE-MRI time-intensity curve profiles allows for visualizing and quantifying hemodynamic heterogeneity1Paul C. Lauterbur Research Center for Biomedical Imaging, Shenzhen Institute of Advanced Technology, Chinese Academy of Sciences, Shenzhen, China, 2College of Computer and Information Engineering, Xiamen University of Technology, Xiamen, China, 3Department of Radiology, National Cancer Center/National Clinical Research Center for Cancer/Cancer Hospital & Shenzhen Hospital, Chinese Academy of Medical Sciences and Peking Union Medical College, Shenzhen, China
Synopsis
Keywords: Breast, Cancer
We propose a novel model-free and data-driven approach, i.e., voxel-wise composition ratio on 19 dynamic contrast-enhanced MRI (DCE-MRI) time-intensity curve (TIC) profiles (Type-19) to visualize and quantify spatial hemodynamic heterogeneity. The proposed quantitative method for breast tumor was evaluated and compared with the two existing methods (qualitative and semi-quantitative methods) in 4 different clinical applications. In distinguishing malignancy on breast cancer lesions and predicting tumor proliferation status, we found that the machine learning model based on the Type-19 feature outperformed other two models in the validation set.Introduction and Motivation
Breast cancer has become the most common, with the highest incidence rate worldwide in 20201. Heterogeneity in breast cancer can affect response to therapy and patient prognosis2. A major driver of this inter- and intra-tumor heterogeneity is the underlying microvasculature heterogeneity resulting in abnormal hemodynamics3, which calls for a non-invasively tool that allows for quantifying and visualizing 3D ‘whole-tumor’ microvascular hemodynamic heterogeneity. Dynamic contrast-enhanced magnetic resonance imaging (DCE-MRI) provides an approach to noninvasively reveal anatomical characteristics and hemodynamic heterogeneity characteristics in tumor tissue4,5, which make it a routine sequence integrated in the standard breast MRI protocol for breast lesions characterization and diagnosis. Till now, several different computational methods have been proposed to extract hemodynamic heterogeneity information from DCE-MRI, including qualitative analysis6, semi-quantitative analysis7, and model-based quantitative analysis8, but all of them are limited in clinical settings. In particular, model-based quantitative analysis has been proposed to calculate voxel-wise physiological parameters by fitting the contrast agent concentration profile based on some ideal models, such as Tofts9, etc. But it remains doubtful whether the physiological parameters obtained are the correct tissue hemodynamic parameters because MRI scan parameters, pre-contrast T1 values of the tissue, arterial input function and specific tissue properties 10,11, instrumentation artifacts, noise, deformation, and temporal resolution12 all could influence the computation result. Herein, in this study, we propose a model-free and data-driven approach to visualize and quantify hemodynamic heterogeneity from DCE-MRI.Methods
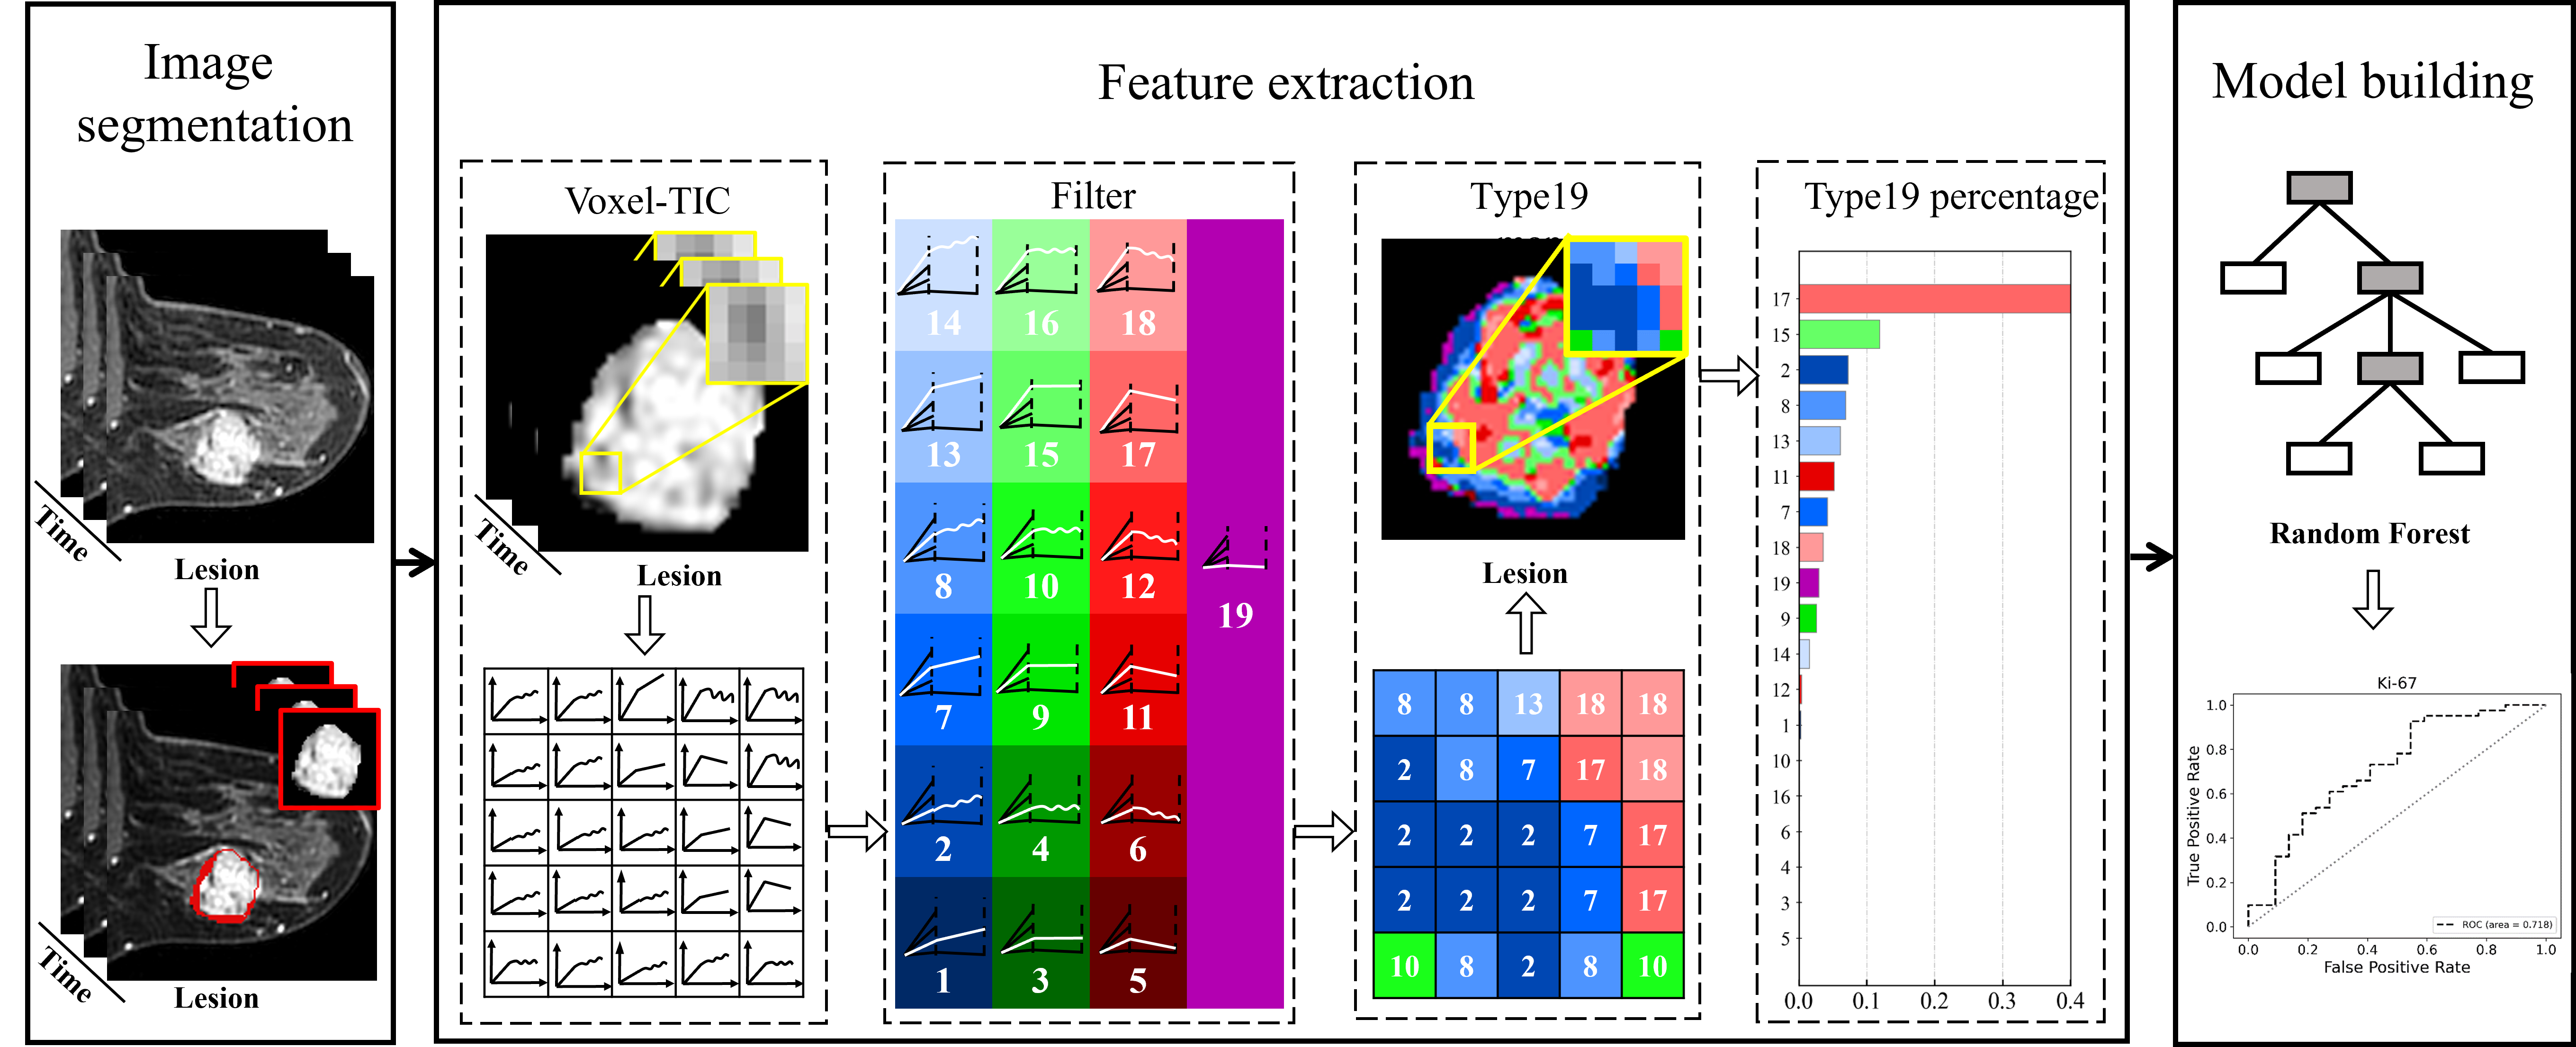
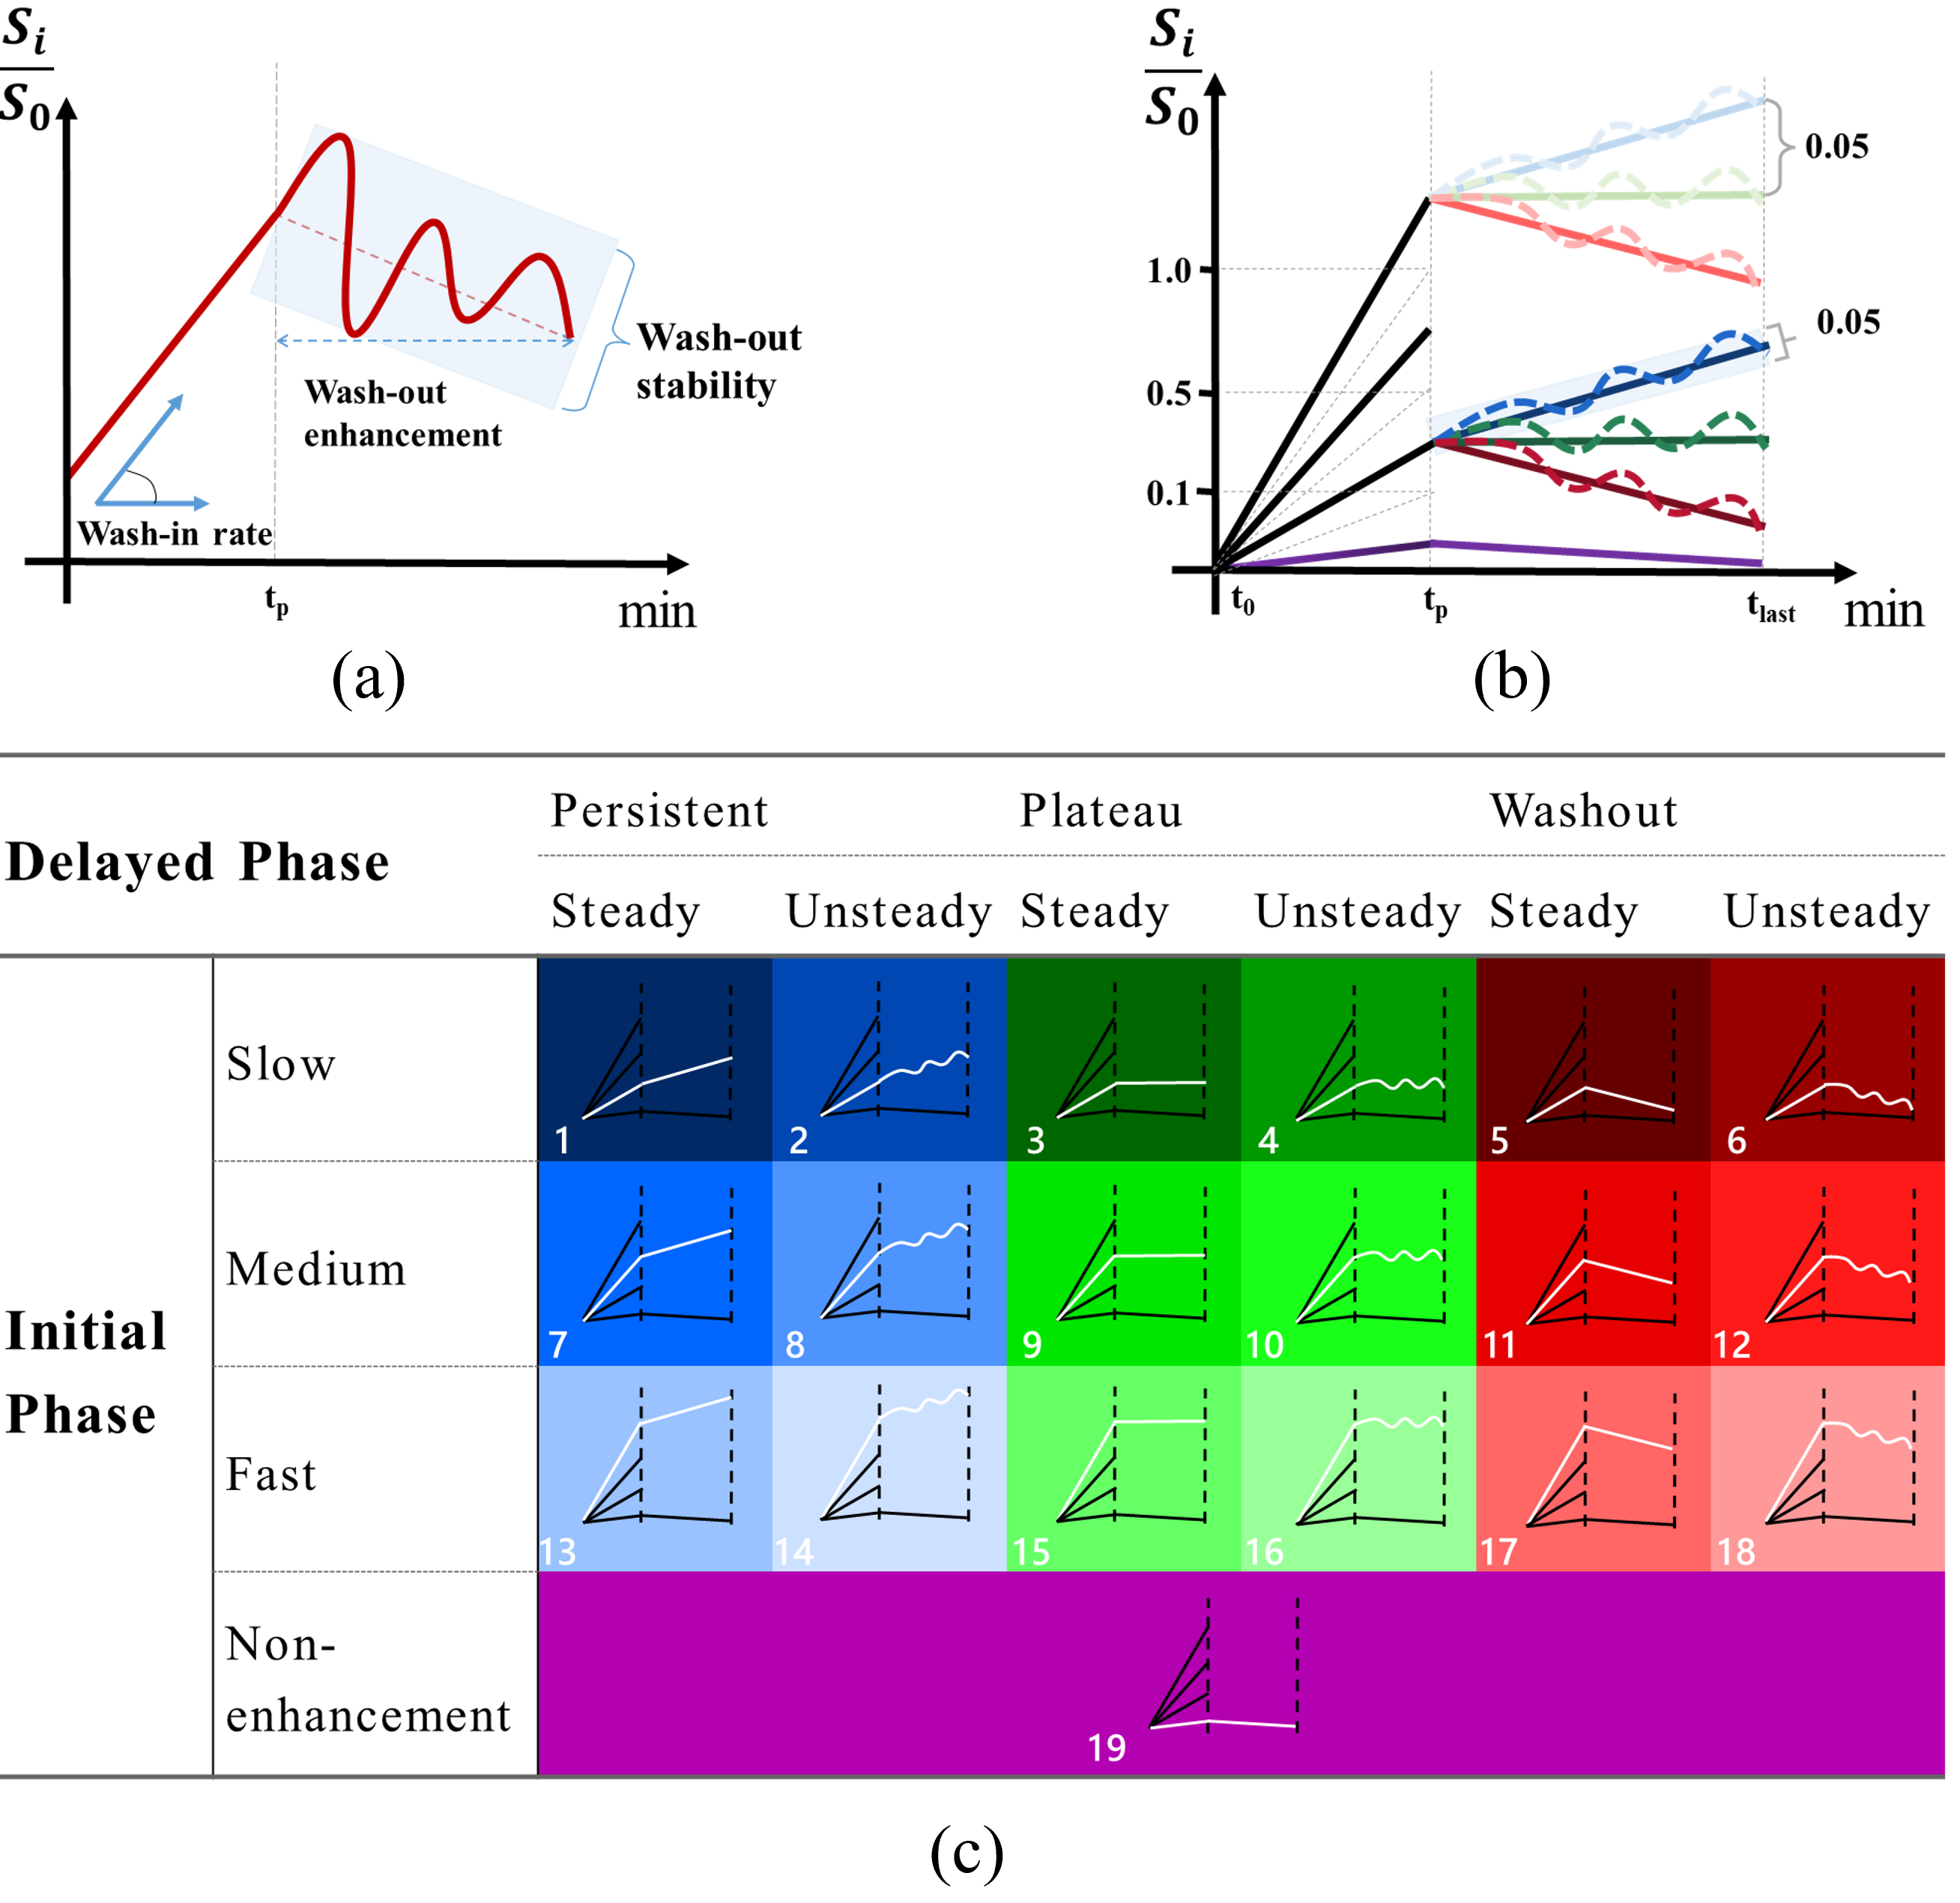
259 patients with 325 pathologically confirmed breast lesions who underwent breast DCE-MRI were retrospectively enrolled. The whole process of this study is shown in Figure 1. Based on manually segmented breast lesions, a time-intensity-curve (TIC) profile for each voxel was generated and then was classified into 19 different subtypes of voxel by voxel based on wash-in rate (non-enhanced, slow, medium, and fast), wash-out ratio (persistent, plateau, and decline), and wash-out stability (steady and unsteady) (Figure 2). The percentages of voxels with each of the 19 subtypes of TIC comprise a new feature set, i.e., the composition ratio of TICs profiles (Type-19 feature), calculated as follows:$$\operatorname{Type}_i=\frac{\sum \operatorname{num}(i)}{N}, i \in\{1,2, \ldots, 19\}$$
Where $$$N$$$ is the total number of voxels in the lesion, and $$$Num(i)$$$ is the voxel number of class $$$i$$$.
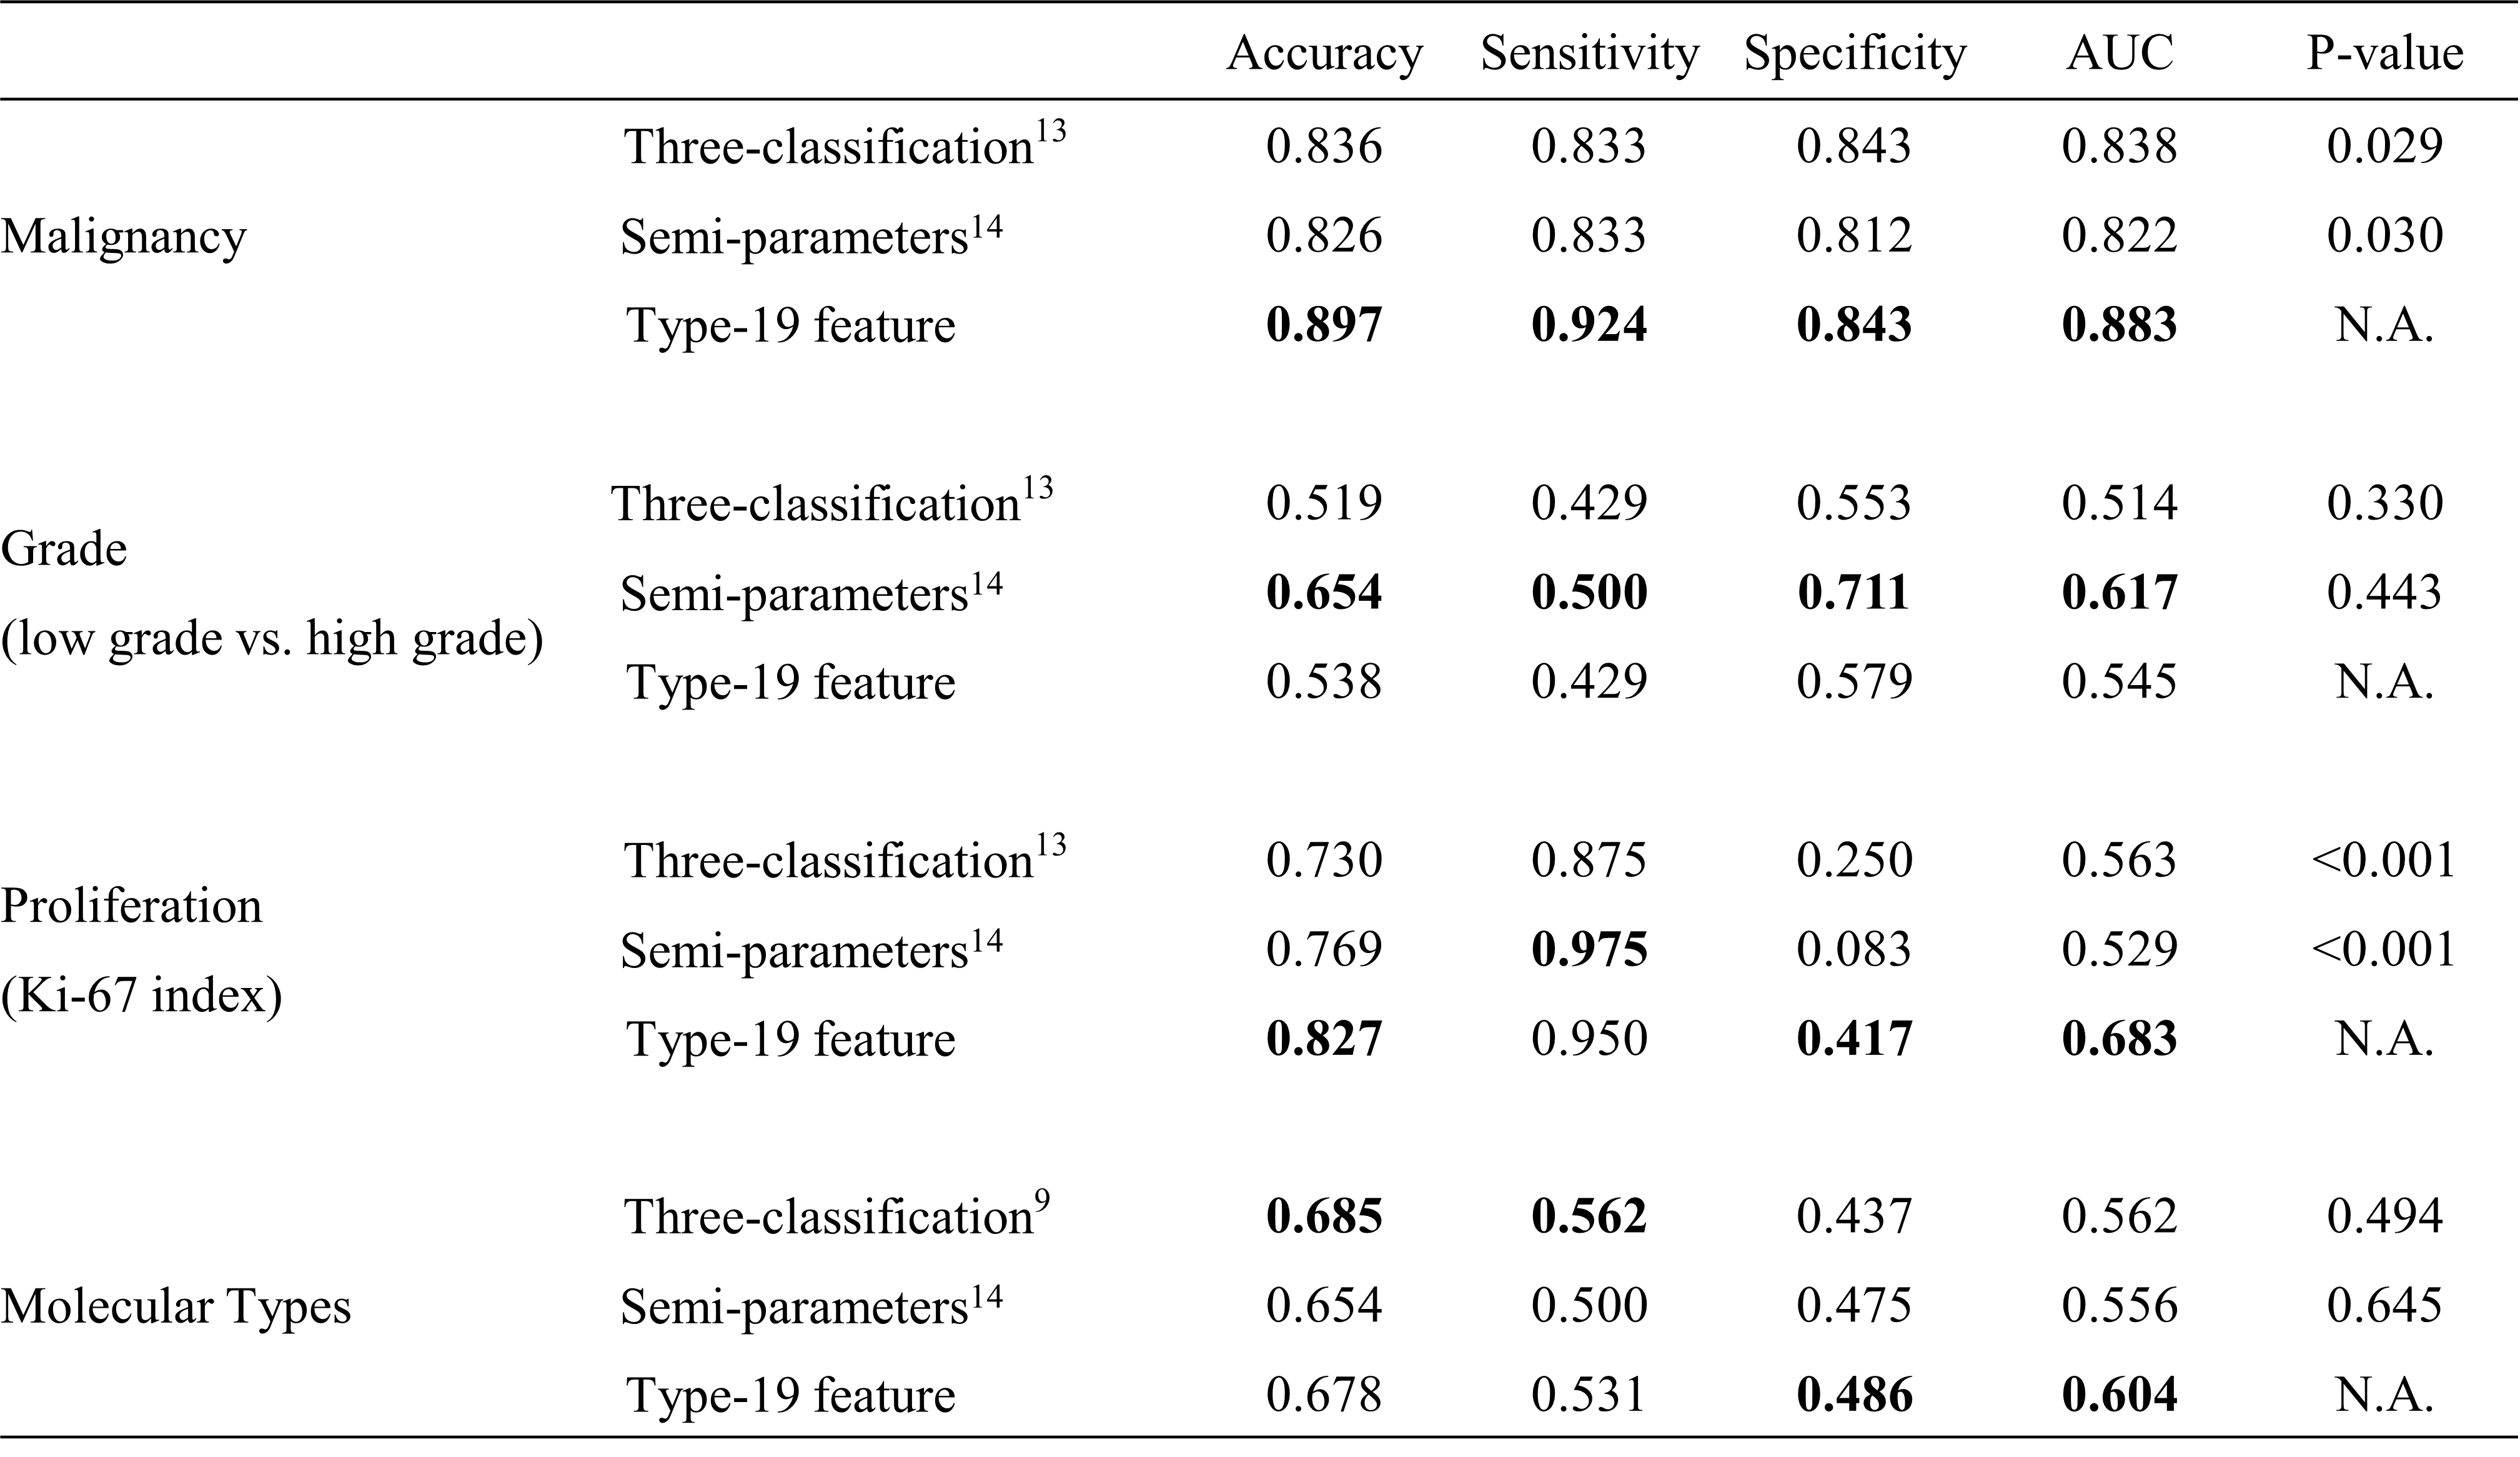
Compared with the conventional three-type TIC method13 and semi-quantitative parameters14, Type-19 feature were used to build a machine learning model to classify lesion malignancy, histologic grades, proliferation status (Ki-67 index), and molecular subtypes (Luminal A, Luminal B, HER2-enriched, and Triple-negative). The performance is compared with accuracy, specificity, sensitivity, and the area under the curve (AUC) of receiver operating characteristics (ROC) in the test set with significance tested by Delong test15.
Results and Discussions
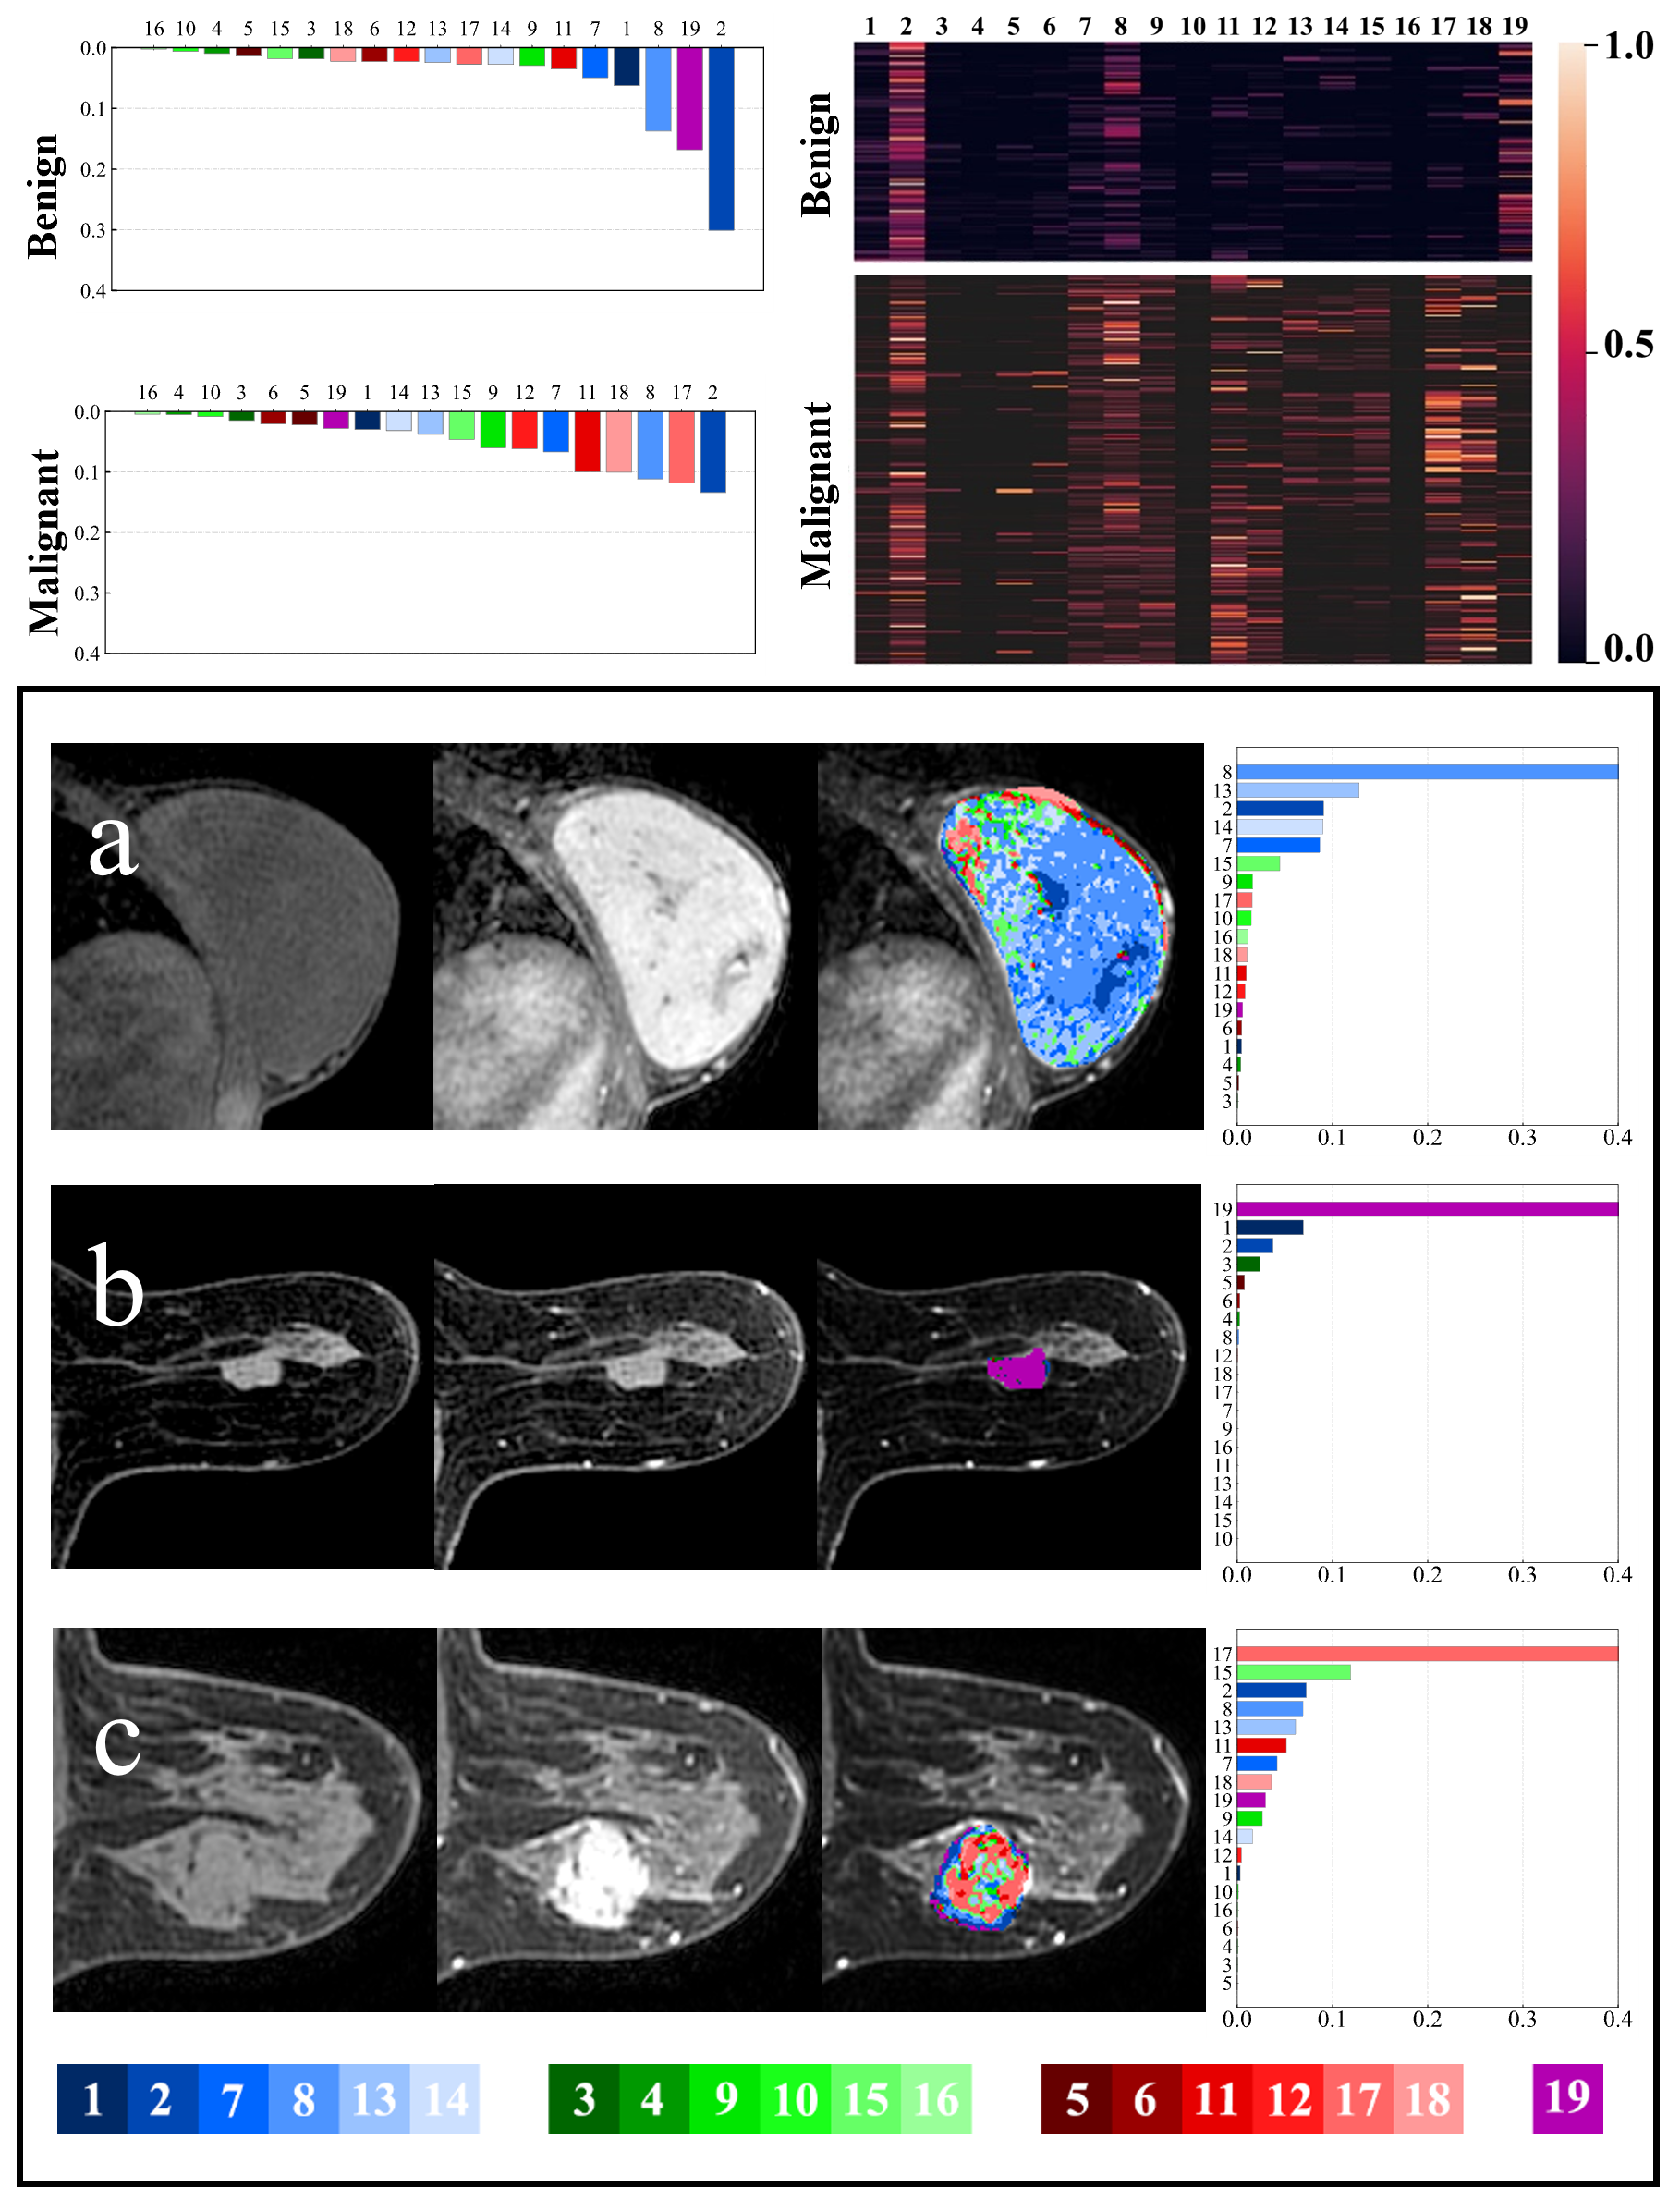
As shown in Figure 3, for all the voxels of the benign lesions (n = 113), the 2nd (31.40%), 19th (17.10%), 8th (13.99%), 1st (6.38%) and 7th (4.62%) were ranking the top 5 TIC profiles, together accounting for more than 2/3 of all TIC profiles indicating slow wash-in and persistent enhancement TIC profiles (2nd + 1st subtypes), followed by medium wash-in and persistent enhancement (8th + 7th subtypes) and no-enhancement TIC profile (19th subtype) were the predominant TIC subtypes, which is consistent with previous studies. In contrast, for the malignant lesions (n = 212), the most frequent TIC profiles were the 2nd (13.39%), 17th (11.83%), 8th (11.15%), 18th (10.04%) and 11th (10.00%), together accounting for more than half of all the TIC profiles. Unlike benign lesions with only few predominant TIC subtypes, TIC profiles were more evenly distributed suggesting more hemodynamic heterogeneity in malignant breast lesions.As shown in Table 1, the Type-19 feature-based machine learning model significantly outperformed models based on the conventional three-type TIC method and semi-quantitative parameters both in distinguishing malignant and benign breast lesions (AUC = 0.883 vs. 0.838, P = 0.029 and 0.883 vs. 0.822, P = 0.030) and predicting tumor proliferation status (AUC = 0.683 vs. 0.563, P < 0.001 and 0.683 vs. 0.529, P < 0.001). However, no significant difference was found between the Type-19 feature-based model and the three-type TIC method model, and between the Type-19 feature-based model and semi-quantitative parameters model both in predicting the histologic tumor grades (AUC = 0.545 vs. 0.514, P = 0.330 and 0.545 vs. 0.617, P = 0.443, respectively) molecular subtypes (AUC = 0.604 vs. 0.562, P = 0.494 and 0.604 vs. 0.556, P = 0.645).
Conclusion
The voxel-wise intra-lesion composition ratio of TIC profiles provides another novel model-free data-driven approach to quantify and visualize hemodynamic heterogeneity in addition to the conventional ways.Acknowledgements
No acknowledgement found.References
[1] Siegel RL, Miller KD, Jemal A. Cancer statistics, 2020. CA Cancer J Clin. 2020;70(1):7-30.
[2] Khalifa F, Soliman A, El-Baz A, et al. Models and methods for analyzing DCE-MRI: a review. Med Phys. 2014;41(12):124301.
[3] Padhani AR. Dynamic contrast-enhanced MRI in clinical oncology: current status and future directions. J Magn Reson Imaging. 2002;16(4):407-422.
[4] García-Figueiras R, Baleato-González S, Padhani AR, et al. How clinical imaging can assess cancer biology. Insights Imaging. 2019;10(1):28. Published 2019 Mar 4.
[5] Turco S, Wijkstra H, Mischi M. Mathematical Models of Contrast Transport Kinetics for Cancer Diagnostic Imaging: A Review. IEEE Rev Biomed Eng. 2016;9:121-147.
[6] d'Arcy JA, Collins DJ, Padhani AR, Walker-Samuel S, Suckling J, Leach MO. Informatics in Radiology (infoRAD): Magnetic Resonance Imaging Workbench: analysis and visualization of dynamic contrast-enhanced MR imaging data. Radiographics. 2006;26(2):621-632.
[7] Sansone M, Fusco R, Petrillo A, Petrillo M, Bracale M. An expectation-maximisation approach for simultaneous pixel classification and tracer kinetic modelling in dynamic contrast enhanced-magnetic resonance imaging. Med Biol Eng Comput. 2011;49(4):485-495.
[8] Wang CH, Yin FF, Horton J, Chang Z. Review of treatment assessment using DCE-MRI in breast cancer radiation therapy. World J Methodol. 2014;4(2):46-58. Published 2014 Jun 26.
[9] Tofts PS, Kermode AG. Measurement of the blood-brain barrier permeability and leakage space using dynamic MR imaging. 1. Fundamental concepts. Magn Reson Med. 1991;17(2):357-367.
[10] Yankeelov TE, Gore JC. Dynamic Contrast Enhanced Magnetic Resonance Imaging in Oncology: Theory, Data Acquisition, Analysis, and Examples. Curr Med Imaging Rev. 2009;3(2):91-107.
[11] Buckley DL. Uncertainty in the analysis of tracer kinetics using dynamic contrast-enhanced T1-weighted MRI. Magn Reson Med. 2002;47(3):601-606.
[12] Winfield JM, Payne GS, Weller A, deSouza NM. DCE-MRI, DW-MRI, and MRS in Cancer: Challenges and Advantages of Implementing Qualitative and Quantitative Multi-parametric Imaging in the Clinic. Top Magn Reson Imaging. 2016;25(5):245-254.
[13] Gribbestad IS, Nilsen G, Fjøsne HE, Kvinnsland S, Haugen OA, Rinck PA. Comparative signal intensity measurements in dynamic gadolinium-enhanced MR mammography. J Magn Reson Imaging. 1994;4(3):477-480. doi:10.1002/jmri.1880040339.
[14] Hauth EA, Stockamp C, Maderwald S, et al. Evaluation of the three-time-point method for diagnosis of breast lesions in contrast-enhanced MR mammography. Clin Imaging. 2006;30(3):160-165. doi:10.1016/j.clinimag.2005.11.005.
[15] DeLong ER, DeLong DM, Clarke-Pearson DL. Comparing the areas under two or more correlated receiver operating characteristic curves: a nonparametric approach. Biometrics. 1988;44(3):837-845.
Figures