0180
High-Resolution Right Ventricular T1, T2, and M0 Mapping Using MR Fingerprinting with a Deep Image Prior Reconstruction1Radiology, University of Michigan, Ann Arbor, MI, United States, 2Biomedical Engineering, University of Michigan, Ann Arbor, MI, United States, 3Harrington Heart and Vascular Institute, University Hospitals Cleveland Medical Center, Cleveland, OH, United States, 4Medicine, Case Western Reserve University, Cleveland, OH, United States
Synopsis
Keywords: Myocardium, MR Fingerprinting, Machine Learning/Artificial Intelligence
This work proposes a high-resolution (1.2x1.2x5 mm3) MR Fingerprinting method for T1, T2, and M0 mapping of both left and right ventricles during a breathhold, with validation in 12 healthy subjects at 1.5T. A key component is the use of a deep image prior reconstruction for reducing noise and undersampling artifacts despite the decreased SNR when moving to higher resolution. Comparable myocardial relaxation times were measured in both ventricles (LV T1 1061+/-22ms, T2 42.2+/-3.4ms; RV T1 1062+/-29ms, T2 42.7+/-2.5ms). Higher-resolution MRF yielded slightly smaller intersubject standard deviation (SD) but larger intrasubject SD compared to a lower-resolution (1.6x1.6x8 mm3) MRF acquisition.Introduction
Tissue characterization of the right ventricle (RV) is not routinely performed as conventional sequences are typically limited to spatial resolutions on the order of 2x2x8 mm3. While this resolution is sufficient for imaging the left ventricle (LV), which has an average mid-ventricular wall thickness of 7-8mm in healthy adults (1), it is not adequate for the right ventricle (RV) at only 3-5mm thick (2). Magnetic Resonance Fingerprinting (MRF) has been demonstrated for myocardial tissue property mapping, although prior studies have focused on the LV due to the demanding resolution requirements for imaging the RV (3,4). This study demonstrates initial feasibility of 2D MRF T1, T2, and M0 mapping of both the LV and RV at high resolution (1.2x1.2x5 mm3) in healthy subjects, enabled by a deep image prior reconstruction.Methods
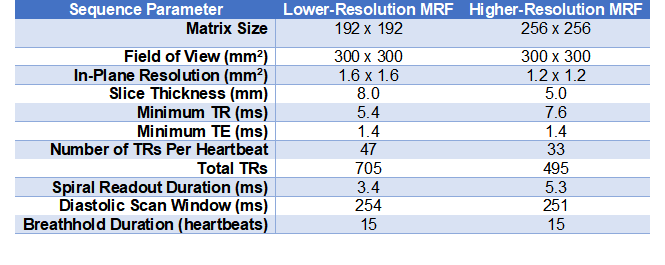
MRF Acquisition: A FISP-based sequence was employed with variable 4-25° flip angles, inversions, and T2-preparations collected during a 15-heartbeat breathhold with ECG triggering. Data were acquired using two sequence variants at resolutions of 1.6x1.6x8 mm3, as in previous work (5), and 1.2x1.2x5 mm3, with the latter designed for imaging the RV. Table 1 gives additional sequence parameters. Data were sampled using a golden angle (6) spiral trajectory with 48 interleaves to fully sample k-space (7). Due to the longer readout (5.3ms vs 3.4ms) of the higher-resolution spiral, fewer total TRs (495 vs 705) were collected to maintain the same breathhold and scan window duration.MRF Reconstruction: Two reconstructions were compared for their ability to reduce noise and undersampling artifacts. (Method 1) A dictionary incorporating cardiac rhythm timings from the ECG was generated using a Bloch simulation with corrections for slice profile and preparation efficiency (8) and compressed to rank 8 using the SVD (8). Images were reconstructed using a low-rank subspace technique with locally low-rank (8x8 patches) regularization before performing dictionary matching (9). (Method 2) A deep image prior (DIP) reconstruction was employed that used a u-net to generate denoised maps without a dictionary (10). Self-supervised training was performed by enforcing consistency with acquired k-space data, with no need for additional training data, using 20,000 iterations with a batch size of 5 TRs and 10% dropout, implemented in Tensorflow/Keras on a GPU.
Experiments: Twelve healthy subjects were scanned at 1.5T (Sola, MAGNETOM Siemens) using an 18-channel cardiac array coil and 16-channels from the spine array. Lower- and higher-resolution MRF scans were collected at a mid-ventricular slice. MOLLI and T2-prepared bSSFP maps were collected at the lower resolution, similar to routine clinical protocols (11,12). ROIs were manually drawn in the LV septum and RV wall, carefully avoiding blood pixels. Mean T1 and T2 were compared between LV/RV and among different imaging methods using Kruskal-Wallis tests with Bonferroni post-hoc corrections. Intersubject standard deviation (SD) was quantified as the SD of the mean T1 and T2 over all subjects. Intrasubject SD was quantified by measuring the SD within each ROI and computing the mean over subjects.
Results
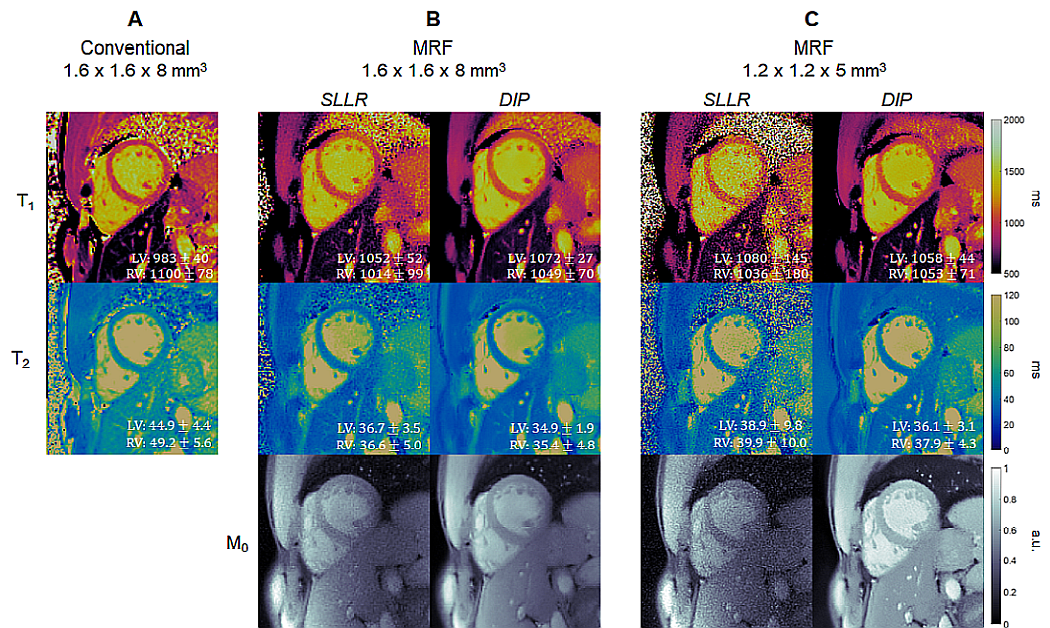
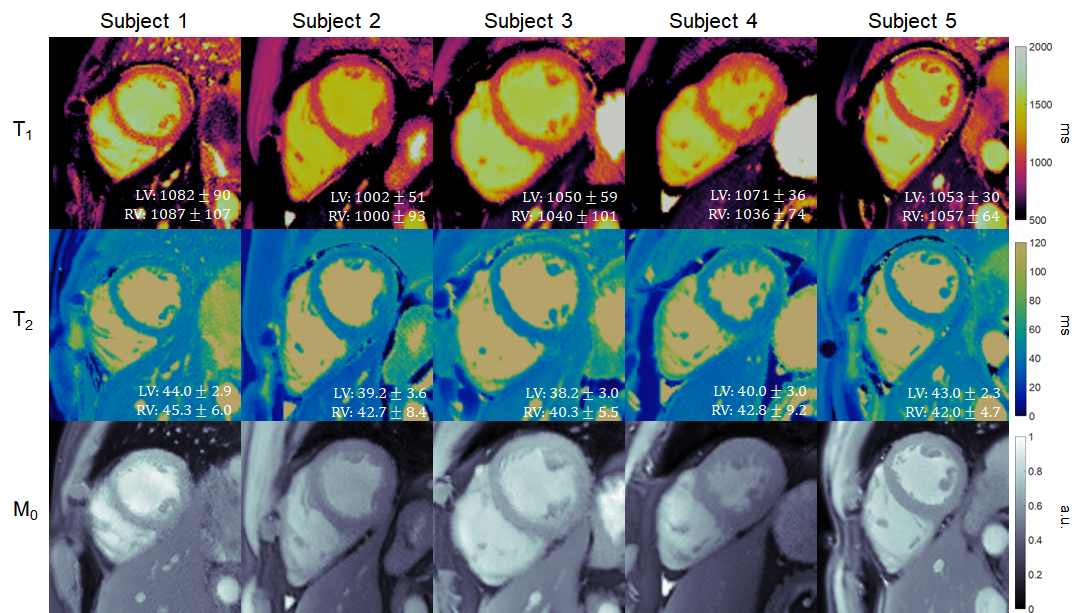
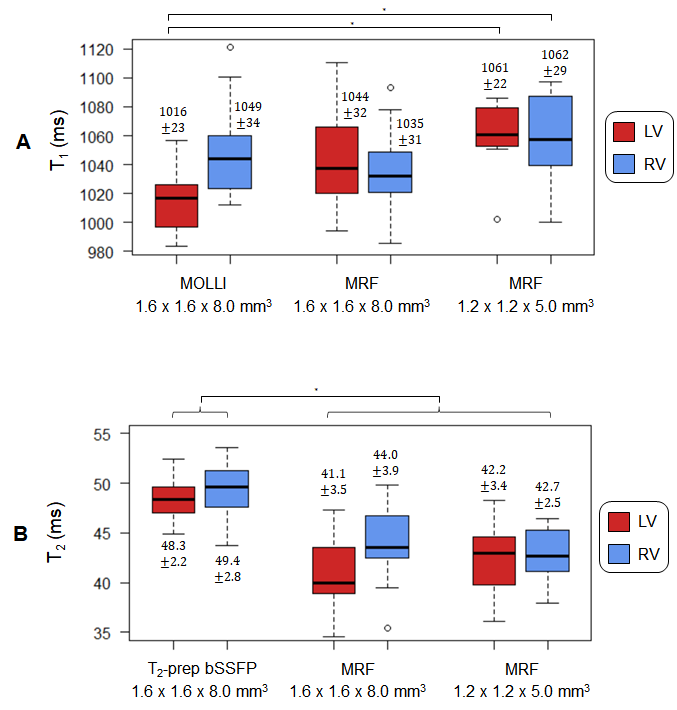
Figure 2 shows maps from one subject using lower- and higher-resolution MRF with SLLR and DIP reconstructions, as well as conventional maps. The DIP reconstruction yielded improved suppression of noise and undersampling artifacts, with substantial improvement in image quality compared to SLLR at the higher resolution. Figure 3 shows high-resolution MRF maps in five additional subjects.Figure 4 summarizes the mean and intersubject SD for LV and RV T1 and T2 over all subjects. With MOLLI, T1 values were higher in the RV (1049+/-34ms) than LV (1016+/-23ms), while T2 values using T2-prep bSSFP were comparable in the LV (48.3+/-2.2ms) and RV (49.4+/-2.8ms). With lower-resolution MRF, T1 values were similar in both ventricles (LV 1044+/-32, RV 1035+/-31ms). The same trend was observed with higher-resolution MRF (LV 1061+/-22, RV 1062+/-29ms), and the intersubject SD was slightly smaller compared to lower-resolution MRF. For T2, lower-resolution MRF measurements were slightly higher in the RV (44.0+/-3.9ms) compared to the LV (41.1+/-3.5ms). With higher-resolution MRF, T2 values in both ventricles were comparable (LV 42.2+/-3.4, RV 42.7+/-2.5ms) and had a slightly lower intersubject SD compared to the lower-resolution scan.
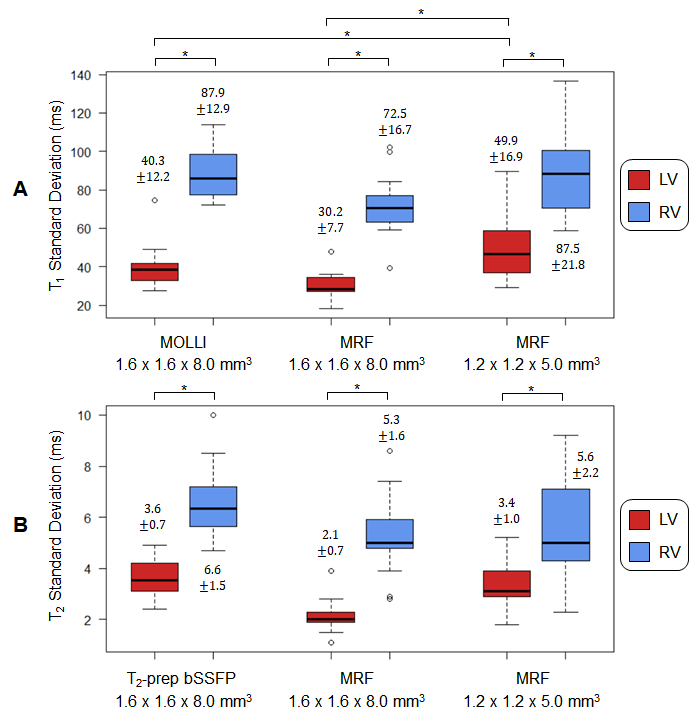
For all methods, intrasubject T1 and T2 SD were higher in the RV than LV (Figure 5). Higher-resolution MRF had slightly larger intrasubject SD (LV T1 49.9ms, T2 3.4ms; RV T1 87.5ms, T2 5.6ms) than lower-resolution MRF (LV T1 30.2ms, T2 2.1ms; RV T1 72.5ms, T2 5.3ms); this difference was significant only for LV T1.
Discussion and Conclusions
This study demonstrated initial feasibility of high-resolution (1.2x1.2x5 mm3) MRF T1, T2, and M0 mapping in both the LV and RV in healthy subjects. The DIP reconstruction was critical for suppressing and residual aliasing, considering the 2.8x lower SNR and 1.4x fewer total TRs compared to some previous (lower-resolution) cardiac MRF studies. While RV T1 mapping has been demonstrated using Look-Locker techniques with respiratory navigation (13), the proposed method provides T1, T2, and M0 maps in one breathhold. This technique has clinical implications for assessing conditions with RV involvement, such as arrhythmogenic right ventricular cardiomyopathy and pulmonary hypertension (14–16). Reduced partial volume artifacts at higher resolution may facilitate easier segmentation, which could improve precision of myocardial T1-T2 measurements. Future work will include spiral off-resonance correction and image quality rating comparisons.Acknowledgements
This work was supported by the Michigan Institute for Clinical & Health Research (MICHR) Grant UL1TR002240, Siemens Healthineers, and National Institutes of Health / National Heart, Lung, and Blood Institute (NIH/NHLBI) R01HL163030 and R01HL153034.References
1. Kawel N, Turkbey EB, Carr JJ, et al. Normal left ventricular myocardial thickness for middle-aged and older subjects with steady-state free precession cardiac magnetic resonance: the multi-ethnic study of atherosclerosis. Circ. Cardiovasc. Imaging 2012;5:500–508.
2. Ho SY, Nihoyannopoulos P. Anatomy, echocardiography, and normal right ventricular dimensions. Heart 2006;92 Suppl 1:i2-13.
3. Ma D, Gulani V, Seiberlich N, et al. Magnetic resonance fingerprinting. Nature 2013;495:187–192.
4. Hamilton JI, Jiang Y, Chen Y, et al. MR fingerprinting for rapid quantification of myocardial T1, T2, and proton spin density. Magn Reson Med 2017;77:1446–1458.
5. Hamilton JI, Pahwa S, Adedigba J, et al. Simultaneous Mapping of T1 and T2 Using Cardiac Magnetic Resonance Fingerprinting in a Cohort of Healthy Subjects at 1.5T. J. Magn. Reson. Imaging 2020;52:1044–1052.
6. Winkelmann S, Schaeffter T, Koehler T, Eggers H, Doessel O. An optimal radial profile order based on the Golden Ratio for time-resolved MRI. IEEE Trans. Med. Imaging 2007;26:68–76.
7. Hargreaves B. Variable-Density Spiral Design Functions. http://mrsrl.stanford.edu/~brian/vdspiral/. Published 2005. Accessed June 1, 2017.
8. Hamilton JI, Jiang Y, Ma D, et al. Investigating and reducing the effects of confounding factors for robust T1 and T2 mapping with cardiac MR fingerprinting. Magn. Reson. Imaging 2018;53:40–51.
9. Lima da Cruz G, Bustin A, Jaubert O, Schneider T, Botnar RM, Prieto C. Sparsity and locally low rank regularization for MR fingerprinting. Magn. Reson. Med. 2019;81:3530–3543.
10. Hamilton JI. A Self-Supervised Deep Learning Reconstruction for Shortening the Breathhold and Acquisition Window in Cardiac Magnetic Resonance Fingerprinting. Front. Cardiovasc. Med. 2022;9:928546.
11. Messroghli DR, Radjenovic A, Kozerke S, Higgins DM, Sivananthan MU, Ridgway JP. Modified Look-Locker inversion recovery (MOLLI) for high-resolution T1 mapping of the heart. Magn. Reson. Med. 2004;52:141–146.
12. Giri S, Chung YC, Merchant A, et al. T2 quantification for improved detection of myocardial edema. J. Cardiovasc. Magn. Reson. 2009;11.
13. Mehta BB, Chen X, Bilchick KC, Salerno M, Epstein FH. Accelerated and navigator-gated look-locker imaging for cardiac T1 estimation (ANGIE): Development and application to T1 mapping of the right ventricle. Magn. Reson. Med. 2014;73:150–160.
14. Jellis CL, Yingchoncharoen T, Gai N, et al. Correlation between right ventricular T1 mapping and right ventricular dysfunction in non-ischemic cardiomyopathy. Int. J. Cardiovasc. Imaging 2018;34:55–65.
15. Mehta BB, Auger DA, Gonzalez JA, et al. Detection of elevated right ventricular extracellular volume in pulmonary hypertension using Accelerated and Navigator-Gated Look-Locker Imaging for Cardiac T1 Estimation (ANGIE) cardiovascular magnetic resonance. J. Cardiovasc. Magn. Reson. 2015;17:110.
16. Spruijt OA, Vissers L, Bogaard H-J, Hofman MBM, Vonk-Noordegraaf A, Marcus JT. Increased native T1-values at the interventricular insertion regions in precapillary pulmonary hypertension. Int. J. Cardiovasc. Imaging 2016;32:451–459.
Figures