0178
Automated detection and quantification of myocardial scar using AI-powered joint bright- and black-blood LGE imaging1IHU LIRYC, Electrophysiology and Heart Modeling Institute, Université de Bordeaux – INSERM U1045, Bordeaux, France, 2Department of Cardiovascular Imaging, Hôpital Cardiologique du Haut-Lévêque, CHU de Bordeaux, Bordeaux, France, 3Department of Diagnostic and Interventional Radiology, Lausanne University Hospital and University of Lausanne, Lausanne, Switzerland, 4Department of Cardiac Electrophysiology, Hôpital Cardiologique du Haut-Lévêque, CHU de Bordeaux, Bordeaux, France, 5CIBM Center for Biomedical Imaging, Lausanne, Switzerland
Synopsis
Keywords: Heart, Data Processing
Bright-blood late gadolinium-enhanced (LGE) imaging is the current clinical gold standard to assess myocardial scar. However, poor contrast at the blood-scar interface makes scar detection and quantification challenging. Bright- and black-blood LGE imaging technologies have recently enabled more accurate scar detection and localization and have shown promising results for scar quantification. Here we aim to introduce a framework for fully automated scar detection and quantification combining novel joint bright- and black-blood LGE imaging with artificial intelligence-powered analysis.INTRODUCTION
Bright-blood late gadolinium-enhanced (LGE) imaging is the current clinical gold standard to assess myocardial scar1. However, poor contrast at the blood-scar interface makes scar detection and quantification challenging. Bright- and black-blood LGE imaging technologies have recently enabled more accurate scar detection and localization and have shown promising results for scar quantification2. Here we introduce a framework for fully automated scar detection and quantification combining novel joint bright- and black-blood LGE imaging (SPOT) with artificial intelligence (AI)-powered analysis.METHODS
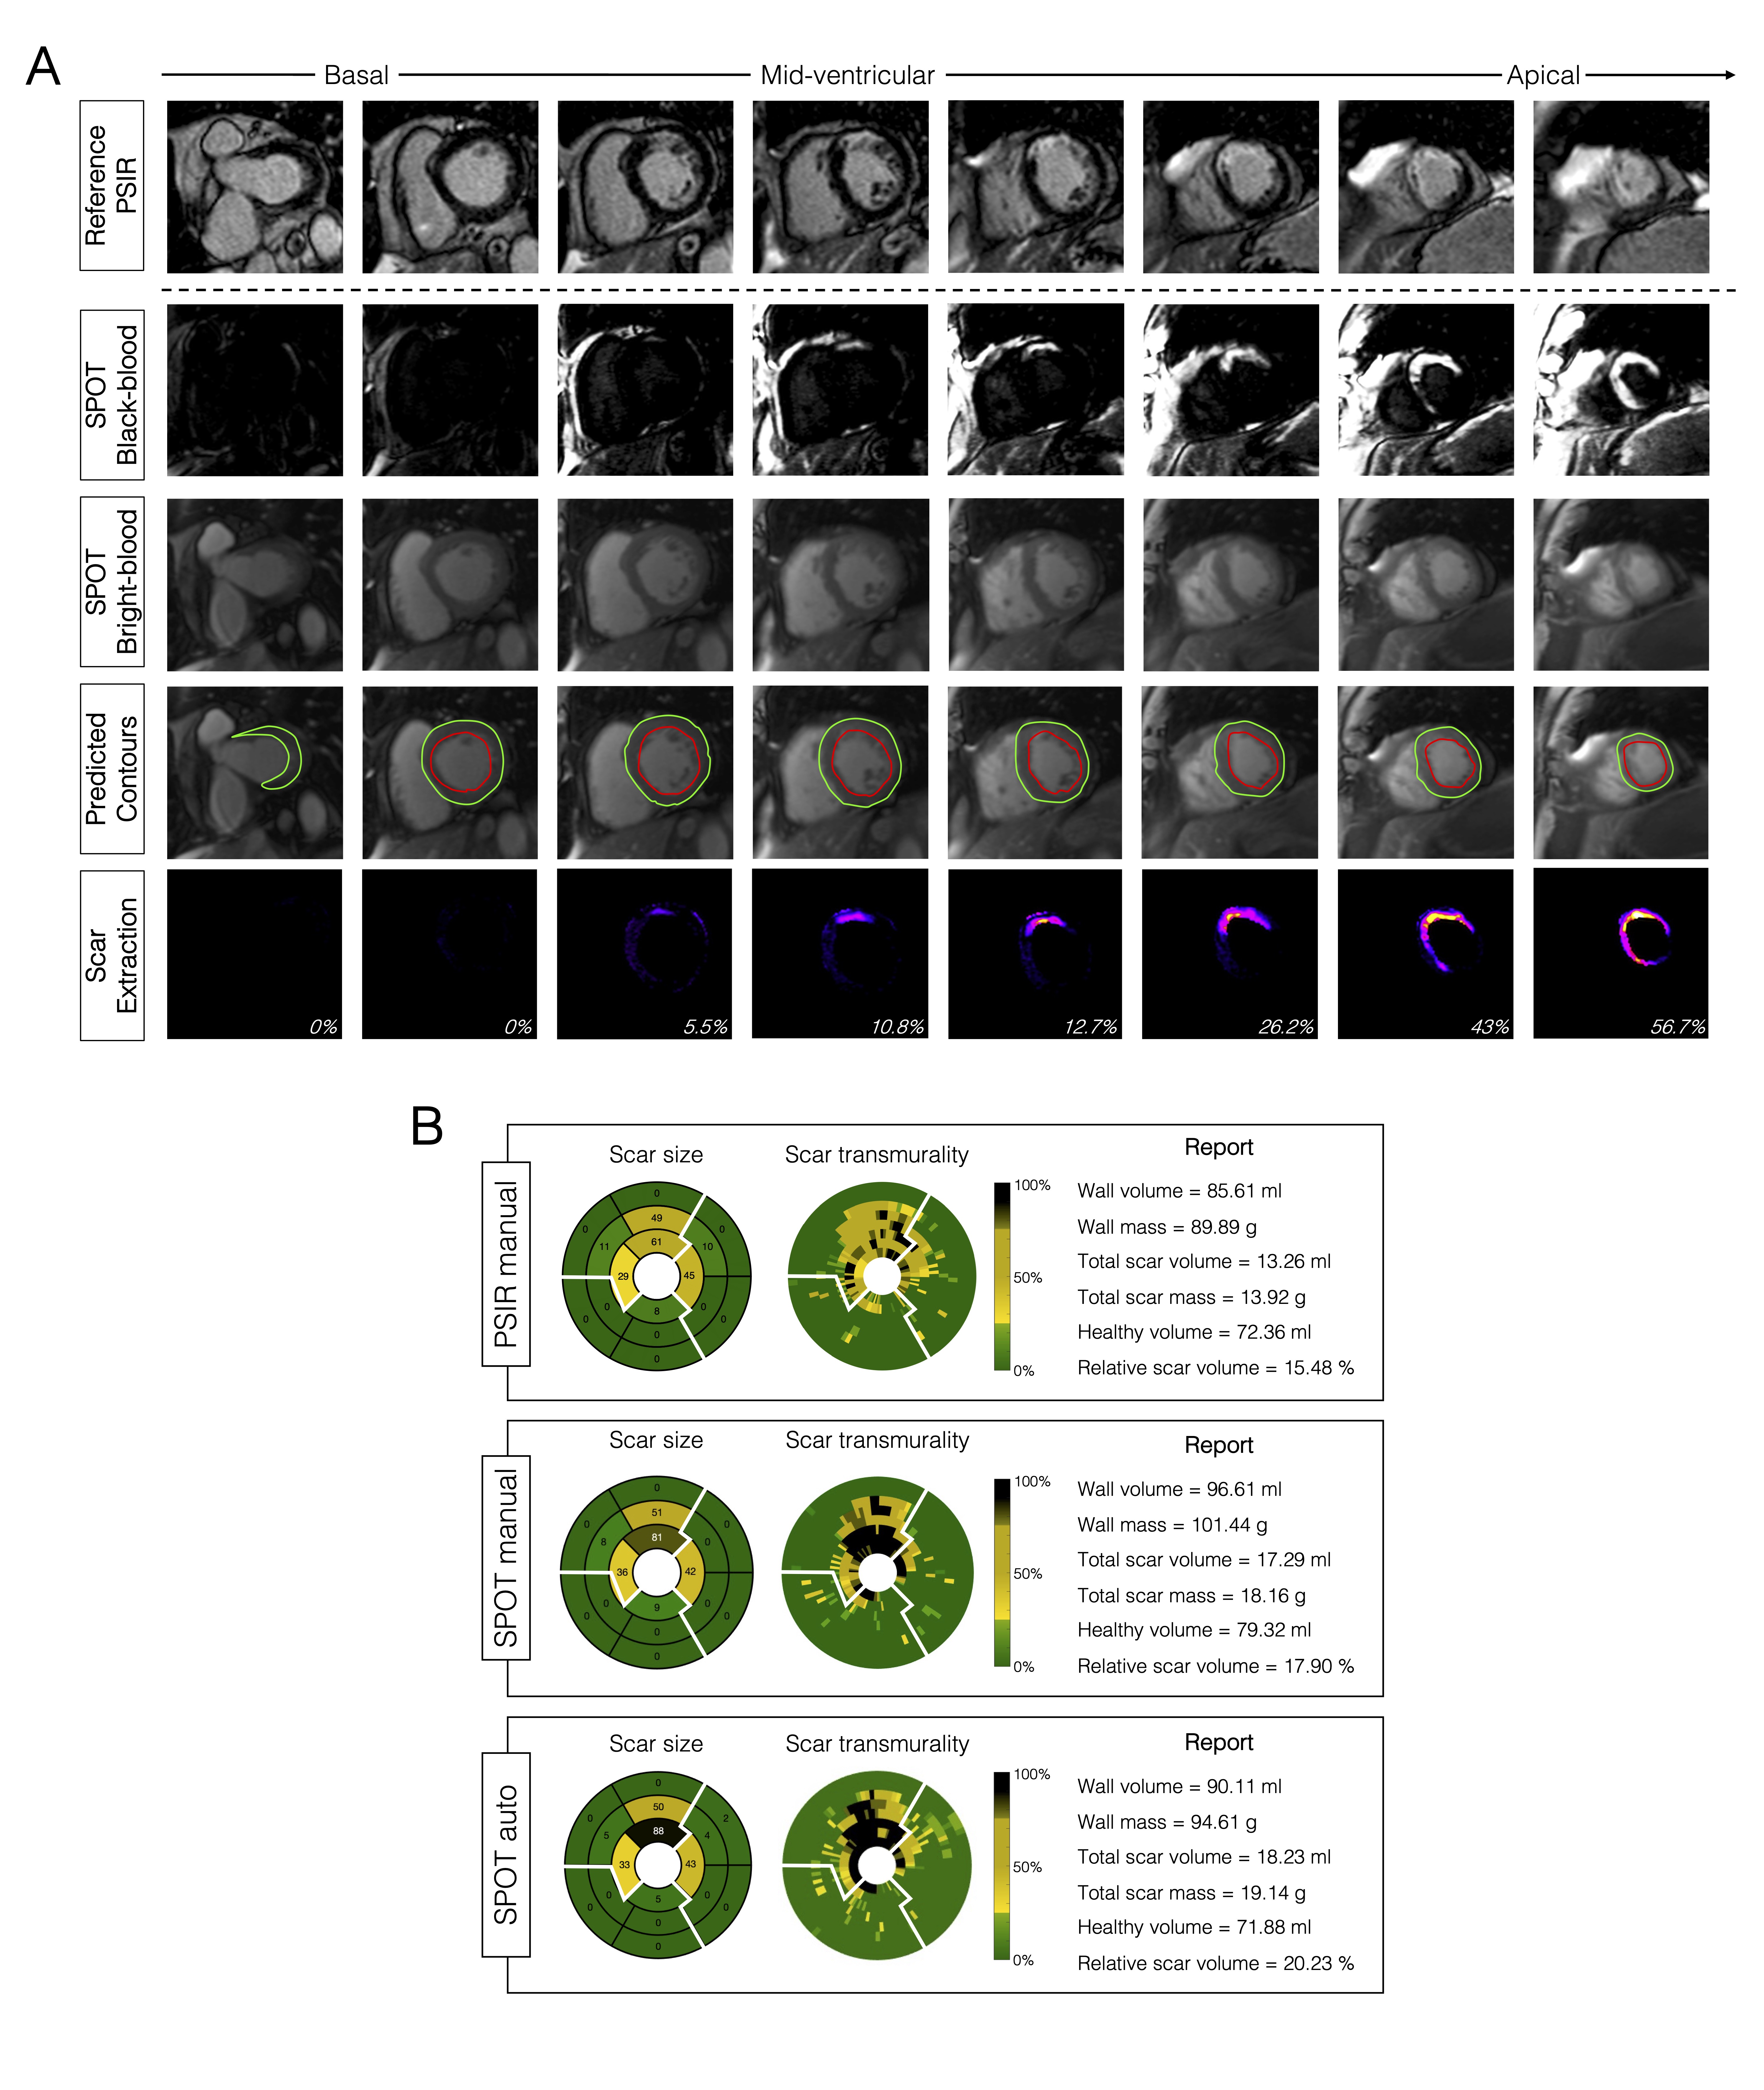
Image Acquisition: 300 patients (83 females, age 55±15 years) with prior myocardial infarction underwent cardiac magnetic resonance imaging at 1.5T (Siemens, MAGNETOM Aera). Short-axis 2D whole-heart reference phase-sensitive inversion recovery (PSIR)3 and SPOT2 images were collected under breath-hold in random order 15min after injection of 0.2 mmol/kg gadoteric acid. The SPOT sequence jointly collects bright-blood (scar localization) and black-blood (scar visualization) images by combining inversion-recovery with T1-rho pulses (Figure 1). Imaging parameters were: 10-20 slices, 4 signal averages, 1.4x1.4mm2 in-plane resolution, 8mm slice thickness, spin-lock frequency=500Hz, spin-lock duration=27ms, flip angle=60°, GRAPPA x2, acquisition window ~160ms, TE/TR=1.2/2.8ms, bandwidth=870Hz/pixel. The inversion times of both sequences were carefully determined from prior scout acquisitions.Image Processing: Two radiologists provided ground truth left ventricular (LV) wall and scar contours on both PSIR and SPOT images using CVI42 (Circle, Calgary). Epicardial fat and papillary muscles were excluded from the LV wall. A 2D U-net model4 was trained on a subset of 288 patients (~4300 images) to automatically extract wall contours from bright-blood SPOT images. The model was trained using TensorFlow with the following hyperparameters: batch size=32, learning rate=10-3, epochs=200, binary cross entropy loss, and ADAM optimizer. Wall contours were then propagated to black-blood SPOT images and scar was extracted as voxels with signal intensity >n standard deviation (SD) above the mean intensity in a region-of-interest automatically defined in the LV cavity. Total and regional infarct mass, volume (in percentage of the wall), and scar transmurality were automatically measured. The entire reconstruction and processing pipeline was integrated inline in our scanner using the open-source Gadgetron framework5.
Experiments: The proposed framework was prospectively tested in 12 patients (4 females, age 61±10 years) unseen during training. The n-SD (n ranging from 1 to 20) scar quantification technique giving the lowest absolute difference in scar mass compared with the reference manual scar segmentation was selected as the optimal technique. Bland-Altman analyses and intraclass correlation coefficients (ICC) were used to assess inter-reader and inter-method (manual PSIR vs. manual SPOT vs. automated SPOT) agreements. Confusion matrices were used to study the accuracy of the framework to detect scar and to grade its transmurality across the 16-segment model of the American Heart Association (AHA). Processing times were measured.
RESULTS
Processing times: SPOT images were acquired with full ventricular coverage in 4min17sec ± 45sec and were automatically processed in ~10sec (vs. 17±7min for manual processing).LV wall segmentation: As compared to PSIR, SPOT images showed higher inter-reader agreement in manual LV wall segmentation (R2=0.92, ICC=0.83 vs. R2=0.79, ICC=0.58) (Figure 2A). The trained U-net allowed for accurate automated LV wall segmentation on bright-blood SPOT images, with a non-significant bias between manual and automated LV mass values (-2.5g, 95% confidence interval [CI]: -20 to +15g, R2=0.92, P=0.35) (Figure 2B).
Scar quantification: Applying these LV wall contours to black-blood images resulted in a fully automated quantification of scar mass, with excellent correlation to manual measurements (R2=0.93, bias: -0.39g, 95%CI: -9.5 to +8.7g, P<0.01) (Figure 2B). The 12-SD segmentation provided the lowest absolute difference in scar mass compared with the reference manual segmentation (Figures 3 and 4). This automated scar quantification compared favourably to gold standard manual PSIR quantifications (Figure 2C). On a segmental basis, and as compared to labour intensive PSIR expert segmentation, the AI-powered SPOT approach allowed for automated mapping of scar presence (89% accuracy) and transmurality (75% accuracy) across AHA segments (Figures 2D and 5).
CONCLUSIONS
The AI-powered SPOT imaging framework allows for fast, accurate, and fully automated detection and quantification of post-infarction scar. Clinical validations in a larger cohort of patients are now warranted.Acknowledgements
This research was supported by funding from the French National Research Agency under grant agreements Equipex MUSIC ANR-11-EQPX-0030, ANR-21-CE17-0034-01, Programme d’Investissements d’Avenir ANR-10-IAHU04-LIRYC, and ANR Chaire Professeur Junior and from the European Council under grant agreement ERC n715093. A.B. acknowledges a Lefoulon-Delalande Foundation fellowship administered by the Institute of France.References
1. Kim RJ, Fieno DS, Parrish TB, et al. Relationship of MRI delayed contrast enhancement to irreversible injury, infarct age, and contractile function. Circulation. 1999;100(19):1992-2002. doi:10.1161/01.CIR.100.19.1992
2. Bustin A, Sridi S, Maillot A, et al. Improved myocardial scar visualization with two-minute free-breathing joint bright- and black-blood late gadolinium enhancement imaging. In: Proceedings from the Joint Annual Meeting ISMRM-ESMRMB; 2022:0271.
3. Kellman P, Arai AE, McVeigh ER, Aletras AH. Phase-sensitive inversion recovery for detecting myocardial infarction using gadolinium-delayed hyperenhancement. Magn Reson Med. 2002;47(2):372-383. doi:10.1002/mrm.10051
4. Ronneberger O, Fischer P, Brox T. U-net: Convolutional networks for biomedical image segmentation. Med Image Comput Comput Interv. 2015;9351:234-241. doi:10.1007/978-3-319-24574-4_28
5. Hansen MS, Sørensen TS. Gadgetron: An open source framework for medical image reconstruction. Magn Reson Med. 2013;69(6):1768-1776. doi:10.1002/mrm.24389
Figures