0177
Quantification of abnormal metabolism in hypertrophic cardiomyopathy patients using hyperpolarized [1-13C]-pyruvate MRI1Radiology and Biomedical Imaging, University of California, San Francisco, San Francisco, CA, United States, 2UC Berkeley-UCSF Graduate Program in Bioengineering, University of California, Berkeley, San Francisco, CA, United States, 3HeartVista, Palo Alto, CA, United States, 4Departments of Bioinformatics and Radiology, University of Colorado School of Medicine, Aurora, CO, United States, 5University of Pennsylvania, Philadelphia, PA, United States, 6University of Washington, Seattle, WA, United States, 7Department of Medicine –Cardiology Division, University of California, San Francisco, San Francisco, CA, United States
Synopsis
Keywords: Myocardium, Cardiomyopathy
Hypertrophic cardiomyopathy (HCM) is the most common inherited cardiomyopathy with a worldwide prevalence of ~1:250. It is the leading cause of sudden cardiac death often during exercise and in otherwise healthy, young individuals. We applied hyperpolarized [1-13C]-pyruvate MRI for metabolic imaging to 3 patients with HCM using multi-slice, dynamic metabolite-specific imaging with autonomous scanning. We observed focal metabolic abnormalities corresponding to regions of hypertrophy in patients with asymmetric non-obstructive HCM and differences in metabolism measurements compared to healthy volunteers.Introduction
Hypertrophic cardiomyopathy (HCM) is the most common inherited cardiomyopathy with a worldwide prevalence of ~1:250. It is the leading cause of sudden cardiac death often during exercise and in otherwise healthy, young individuals. HCM is characterized by left ventricular hypertrophy, hypercontractility and diastolic dysfunction. The most common mutations leading to HCM are in the sarcomeric proteins which increases the energetic cost of tension development. Human and mouse model studies have shown reduced contractile reserve, energetic deficits, and metabolic remodeling, which supports the hypothesis that HCM is a metabolic disease1.We applied hyperpolarized [1-13C]-pyruvate MRI for metabolic imaging of patients with HCM to explore its potential to identify and characterize regional metabolism abnormalities. With hyperpolarized [1-13C]-pyruvate MRI, the relative contribution of glucose oxidation and fatty acid oxidation to energy production in the heart can be assessed by measuring pyruvate conversion to [1-13C]-bicarbonate, catalyzed by pyruvate dehydrogenase (PDH), and [1-13C]-lactate, catalyzed by lactate dehydrogenase (LDH)2,3.
Methods
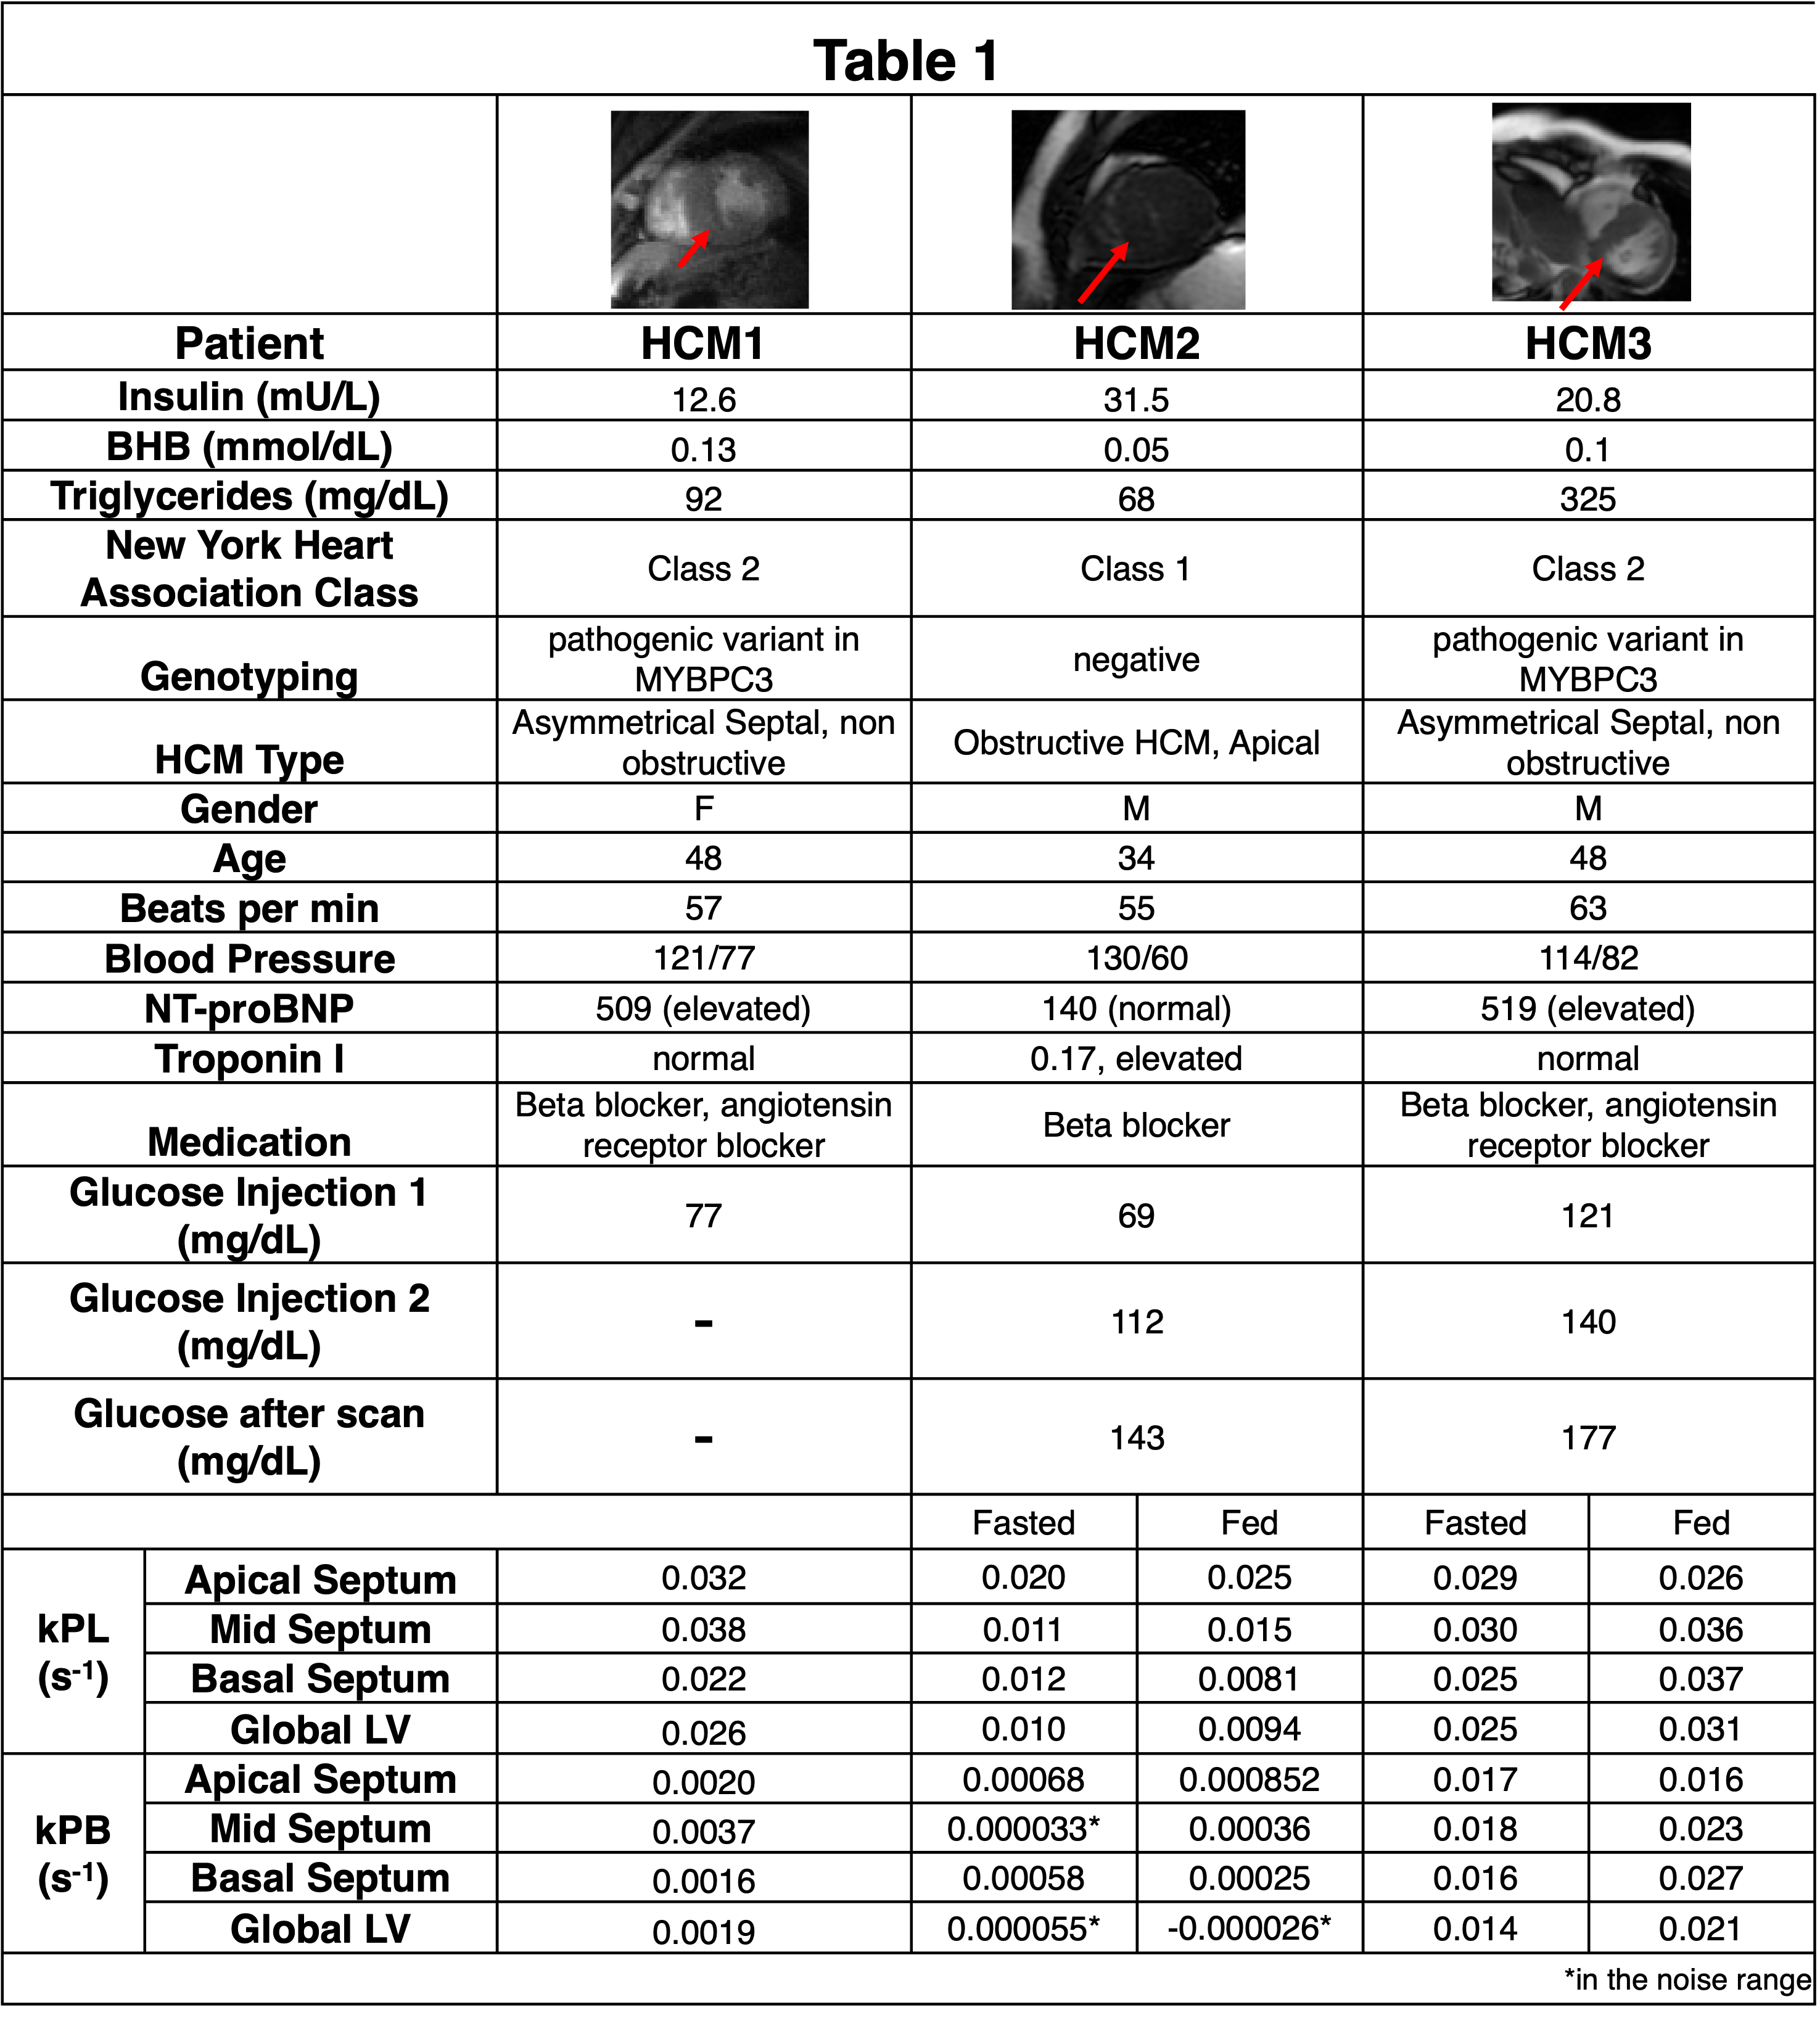
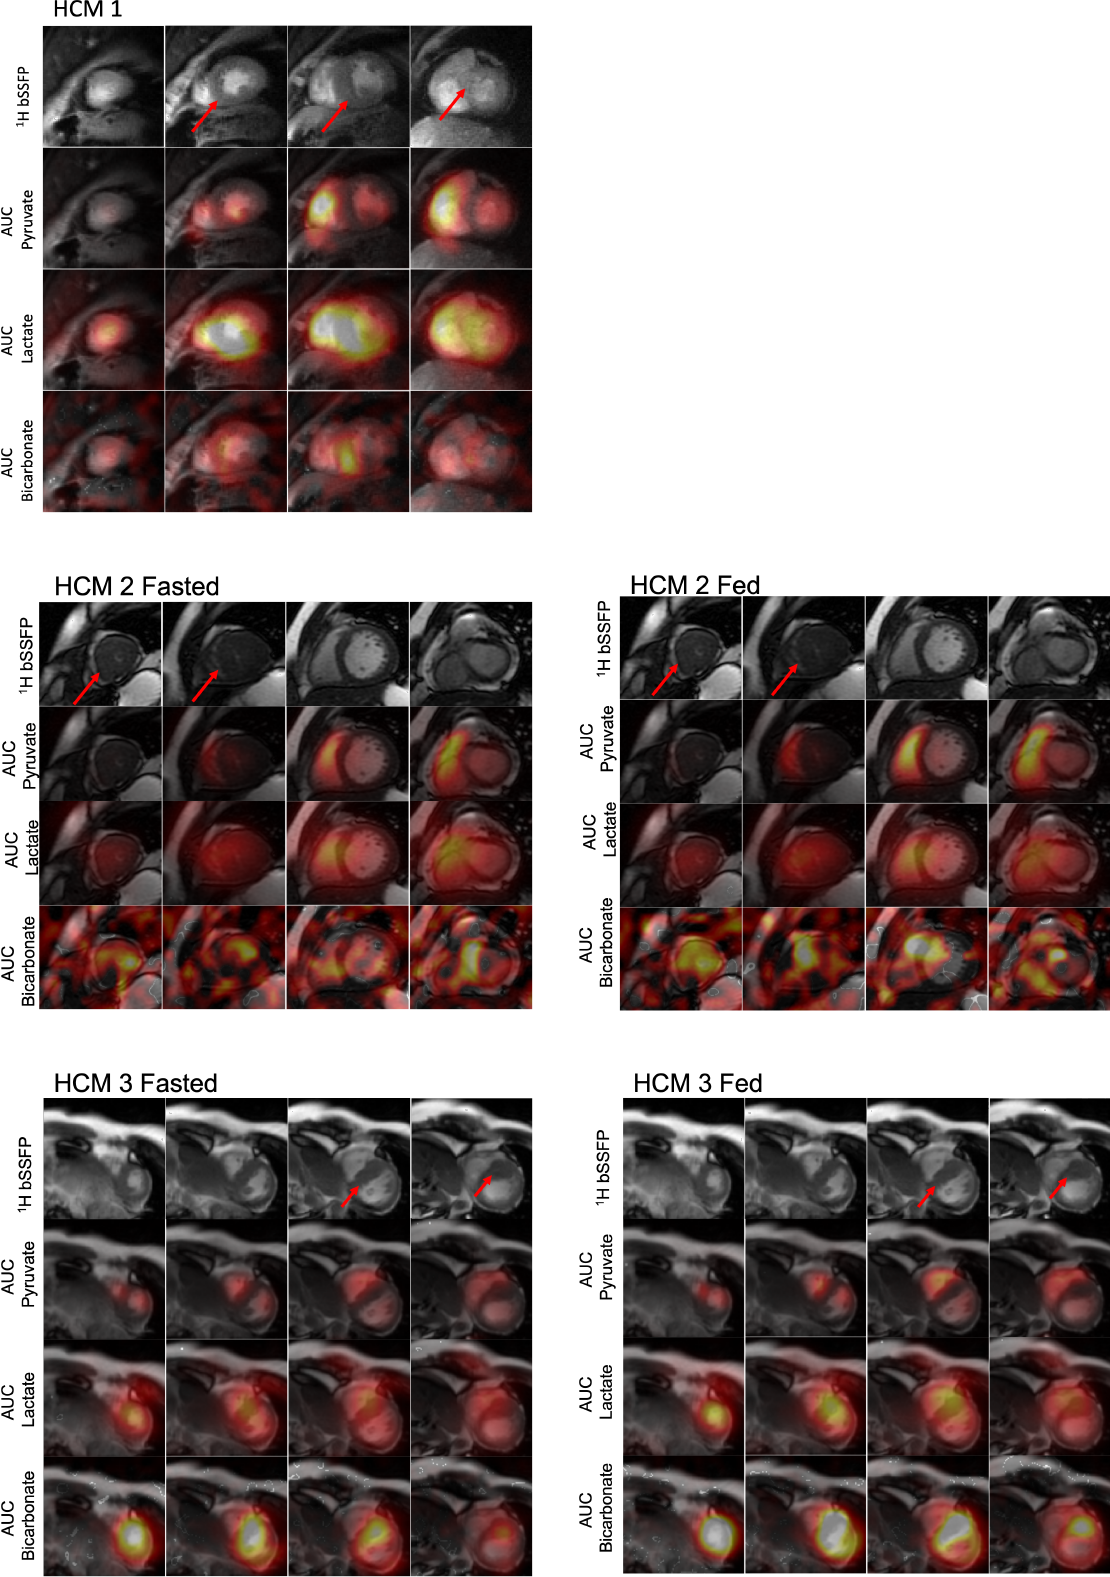
We recruited 3 patients with HCM to participate, whose demographics and corresponding physiologic and blood measurements on the day of the study are listed in Table 1. Two subjects participated in a fed/fasted protocol, where they were asked to fast for at least 4 hours prior to the study and were imaged following a first injection of HP [1-13C]-pyruvate. They were then given an oral glucose load, and imaged following a second HP injection approximately 30 minutes later. We had previously imaged 7 healthy volunteers under the fed/fasted protocol, and their results are included as normative reference ranges.The hyperpolarized MRI scan was performed using a volumetric multi-slice, multi-metabolite imaging sequence, integrated into an autonomous scanning protocol4. A metabolite-specific imaging pulse sequence with a spectral-spatial pulse and a spiral readout was used to acquire two-dimensional multi-slice short-axis cardiac images of [1-13C]pyruvate, [1-13C]lactate and 13C-bicarbonate5. Scans used the following parameters: 6 mm x 6 mm in-plane resolution for pyruvate, 12 mm x 12 mm in-plane resolution for bicarbonate and lactate6, 21 mm slice thickness, 5 slices, a temporal resolution of 3 heartbeats (~3.6s), acquired for 90 heartbeats, 20o excitation flip angle for pyruvate, and 30o excitation flip angle for lactate and bicarbonate.
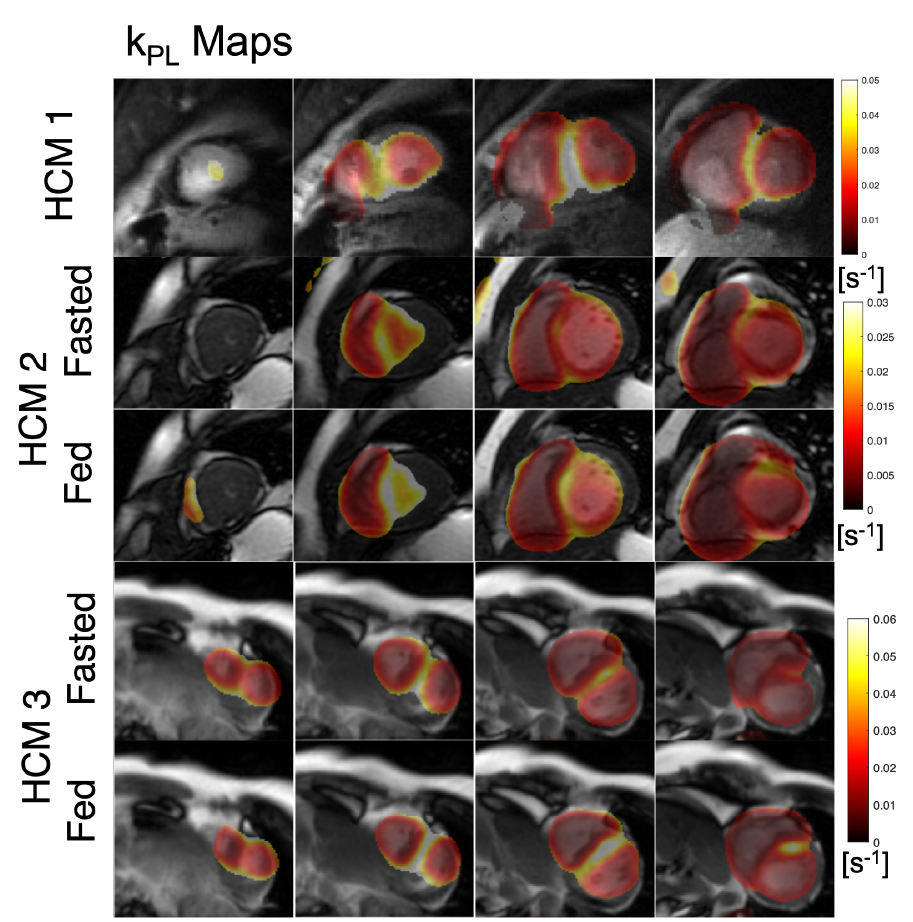
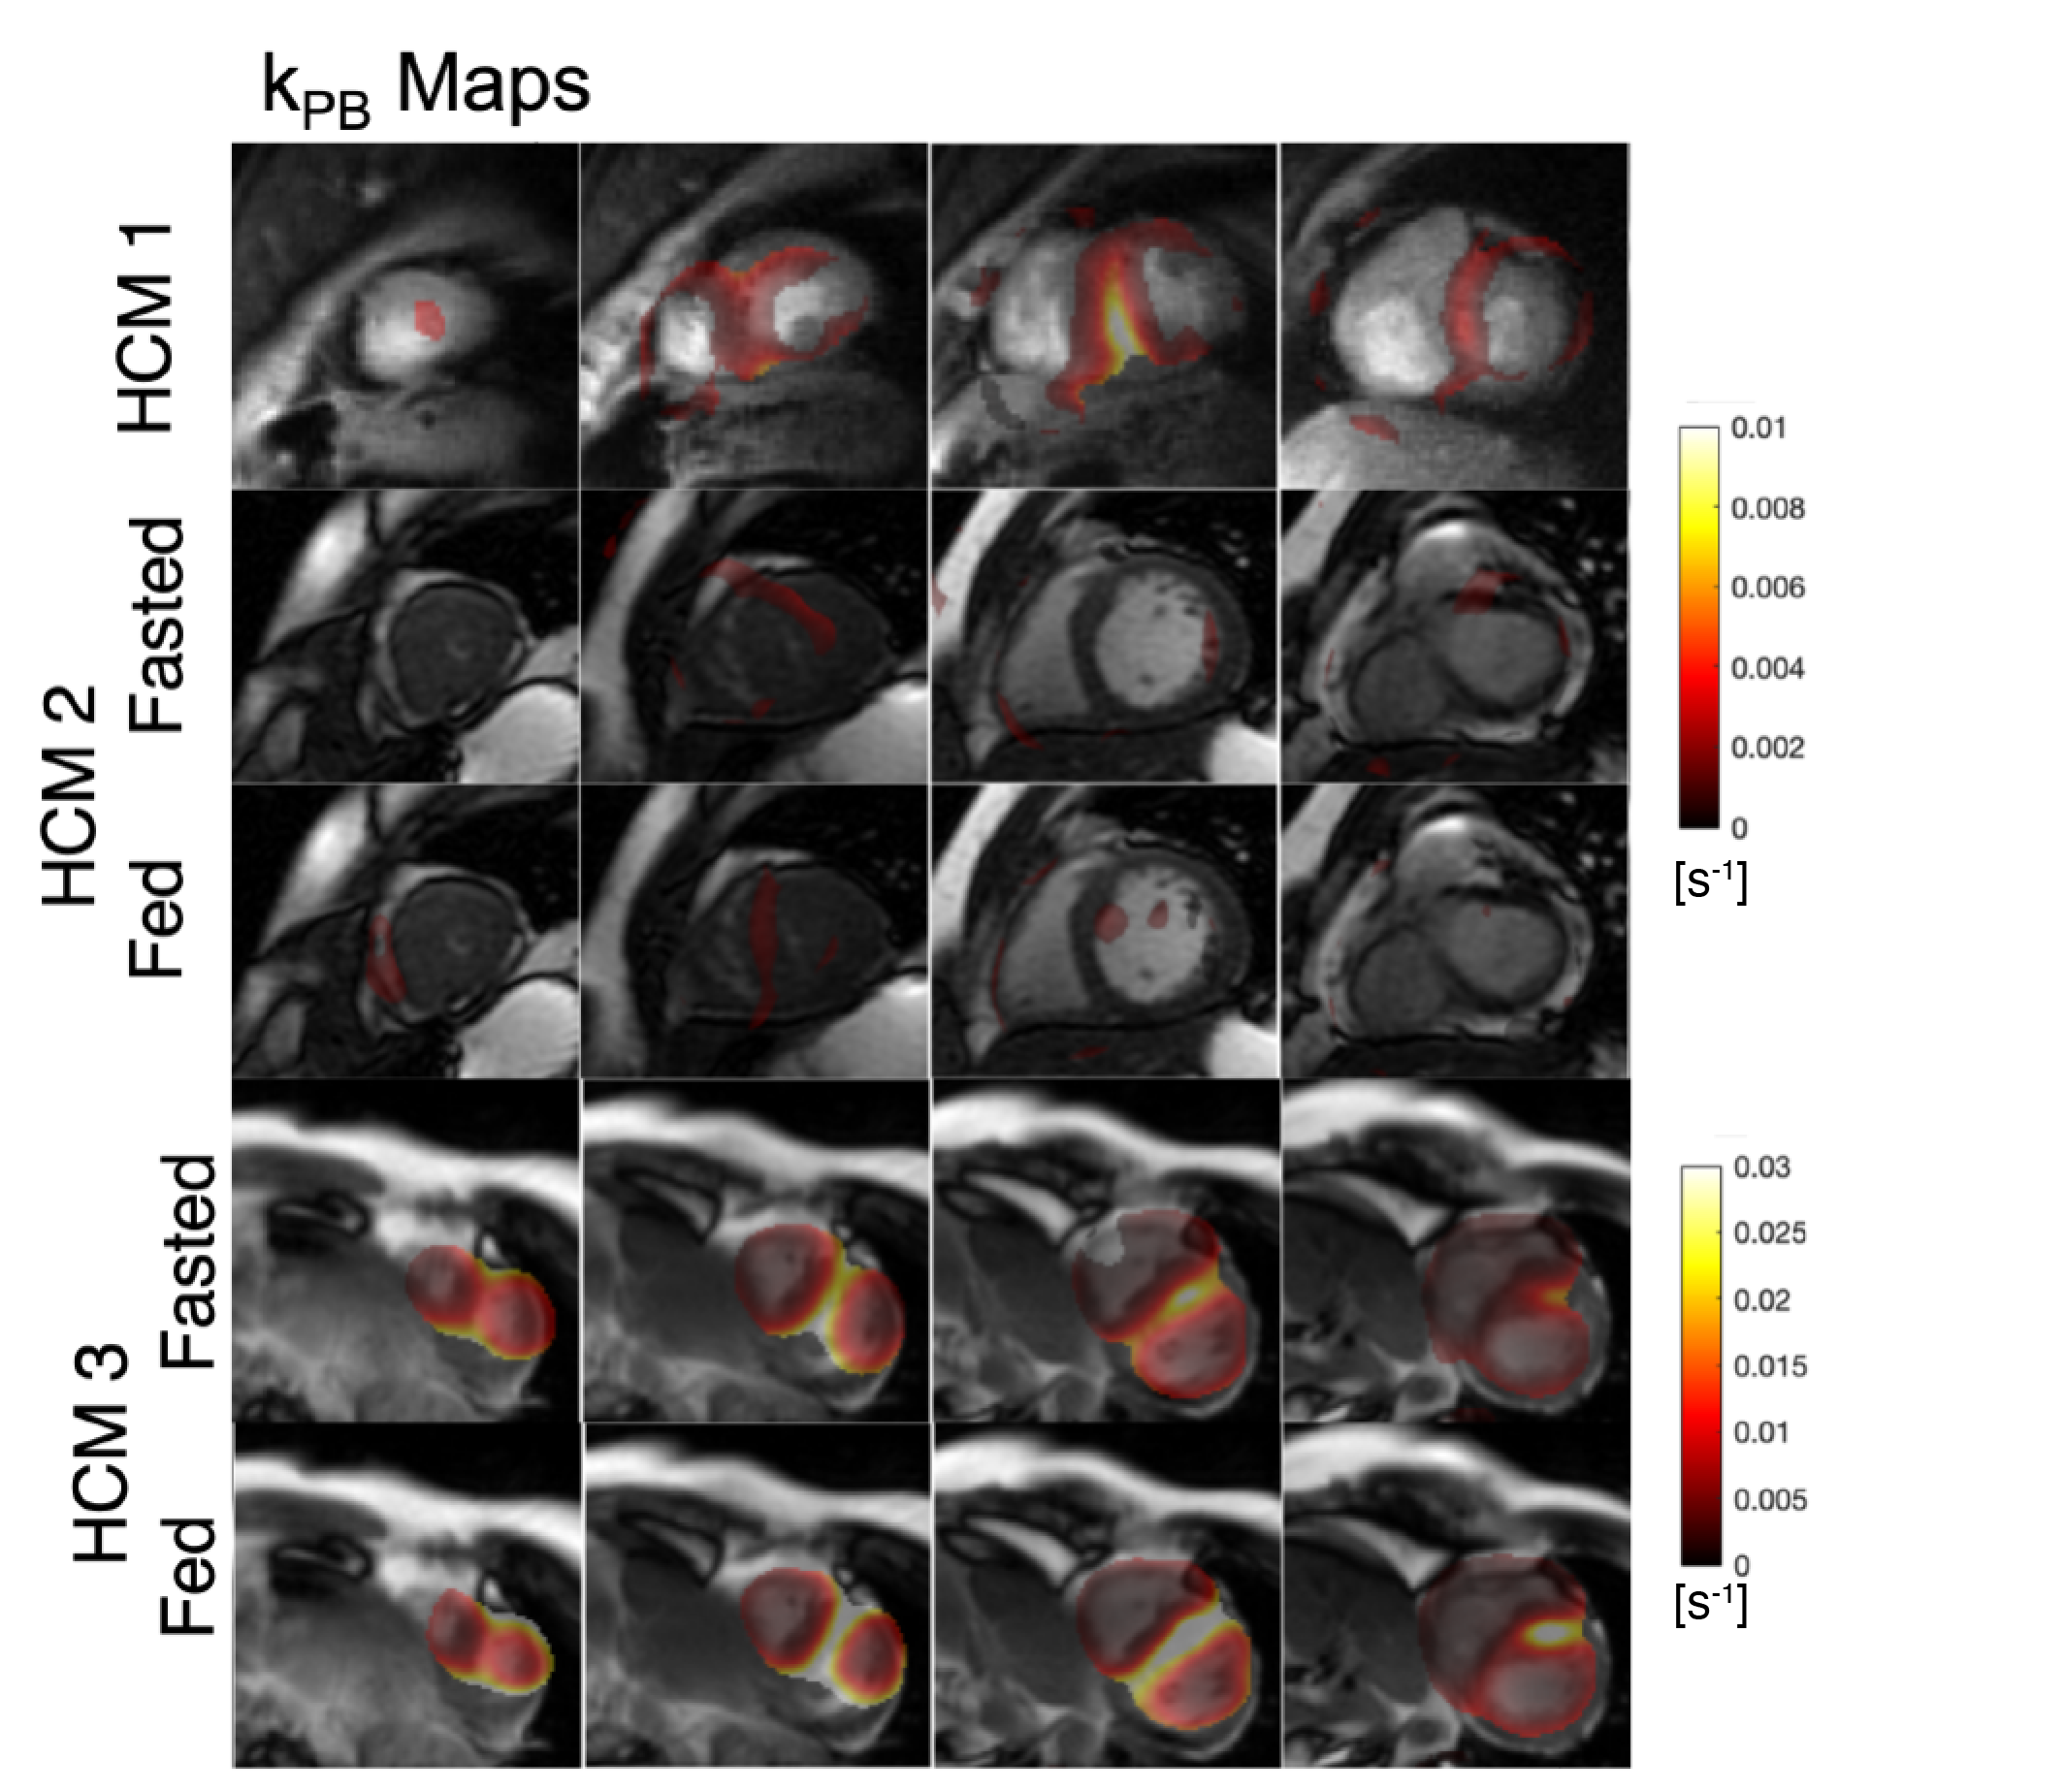
Pharmacokinetic modeling was performed to assess the conversion of pyruvate-to-lactate (kPL) and pyruvate-to-bicarbonate (kPB) in each of the ROIs, across separate slices using a unidirectional, three-site “inputless” model with one physical compartment7,8. These calculations were only calculated in voxels above a pyruvate SNR threshold of 220.
Results
The first HCM patient was NYHA class II, had a pathogenic variant in MYBPC3, asymmetric septal hypertrophy (max wall thickness 22.7mm in mid-septum) and non-obstructive hemodynamics. In the three slices covering the ventricles, higher 13C-bicarbonate/kPB was observed in the mid septum, when compared to basal (thickness = 12.5 mm) and apical septum as well as the remainder of LV myocardium. In addition to a focal increase in these measures of PDH, this patient also had increased 13C-lactate/kPL globally in LV myocardium that was higher than all of the healthy volunteer studies.The second HCM patient was NYHA class I, had genotype-negative apical hypertrophy and LVOT obstruction. In this subject, we observed very low levels of 13C-bicarbonate/kPB values in both the fasted and fed states, while the pyruvate and lactate signals in LV myocardium were within normal volunteer ranges, reflecting low PDH flux.
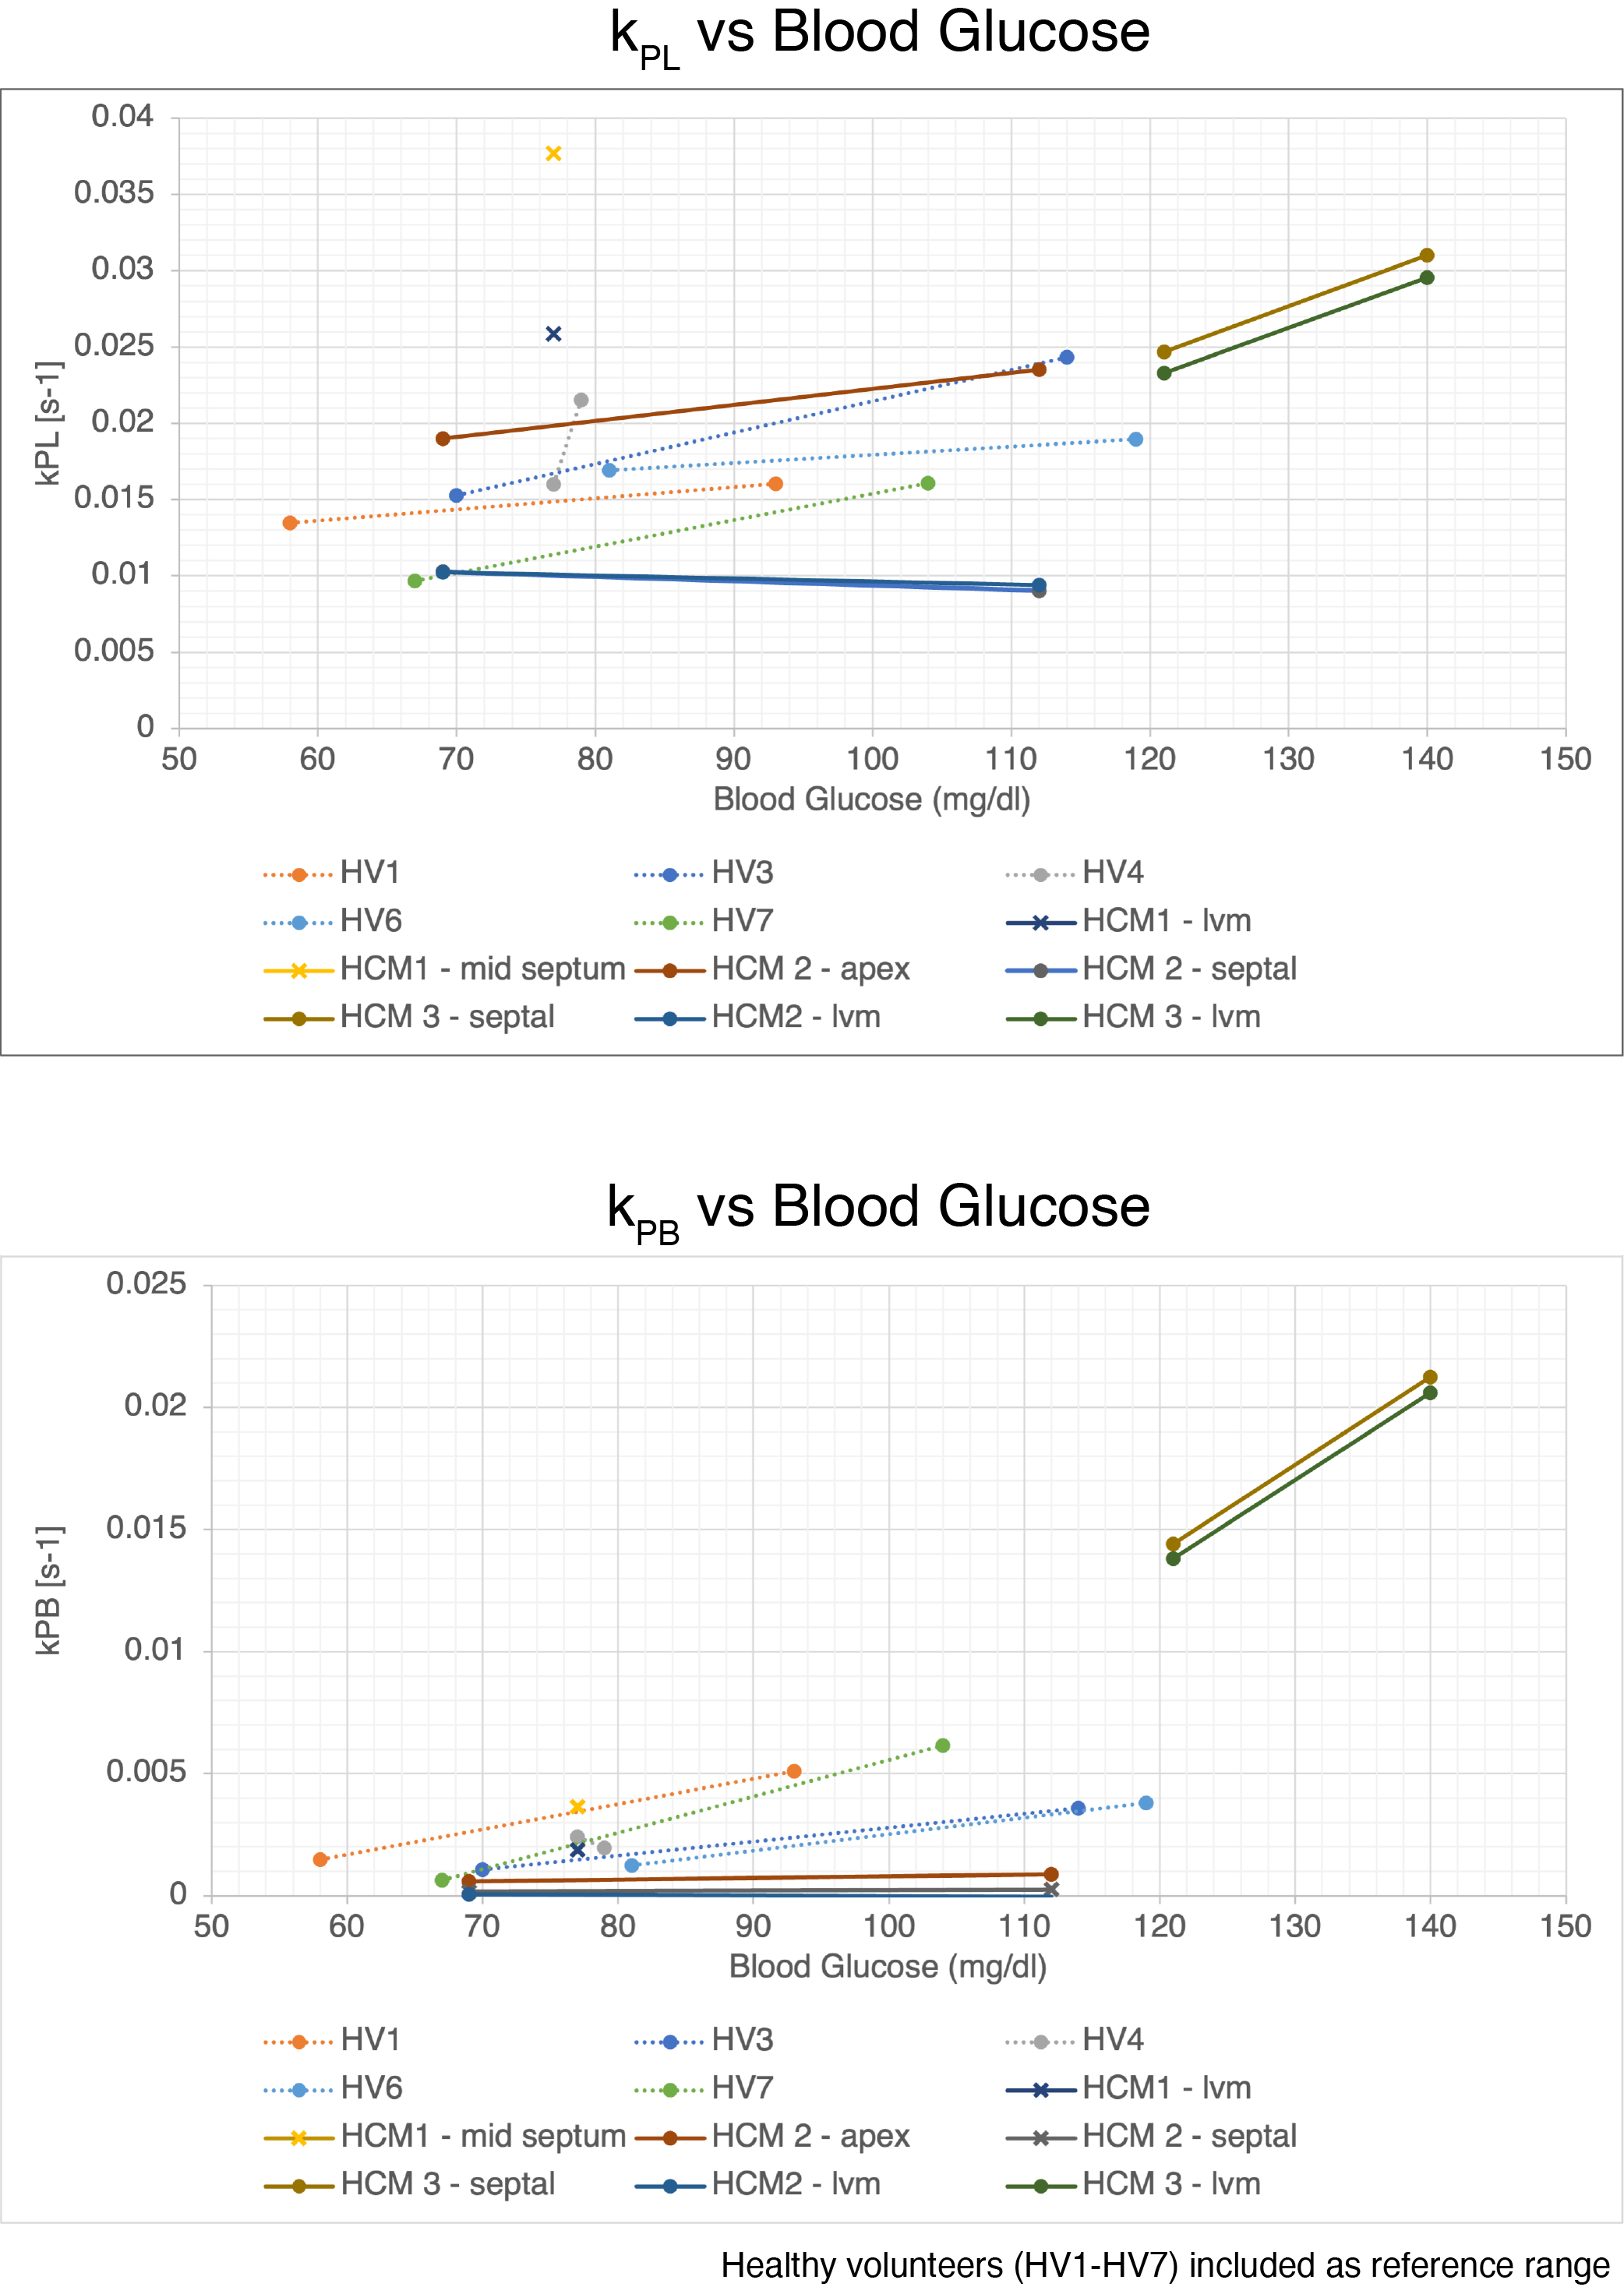
The third HCM patient was NYHA class II, had a pathogenic variant in MYBPC3, asymmetric septal hypertrophy and non-obstructive hemodynamics. As in the case of HCM1, we observed higher 13C-bicarbonate/kPB in the region of maximum hypertrophy that persisted after oral glucose loading, with increase in kPB (although this subject’s initial blood glucose levels were elevated). Similar to HCM1, we also observed globally elevated kPL (compared to healthy volunteers), which increased slightly after the oral glucose load.
In HCM1 and HCM3 average septum kPB values in the fasted state were higher than all fasted healthy participant values, and in fact were comparable to fed state healthy patient kPB values. These HCM subjects had higher kPL values than all healthy volunteers in the septum and across the LV myocardium.
Discussion and Conclusions
While our sample size is small, we believe these are incredibly intriguing initial results applying HP 13C-pyruvate MRI to HCM patients. We observed very obvious focal increases in kPB, a biomarker aimed to reflect PDH and Krebs cycle flux, in regions of the septum corresponding to regions of maximum hypertrophy in 2 patients. Furthermore, in our 7 healthy volunteer studies we did not observe any such focal increases in kPB or kPL, suggesting this is inherent variability in the measurements.We also observed global increase in pyruvate-to-lactate, kPL which could represent a systematic shift in metabolism in these HCM patients compared to healthy volunteers.
One of our patients did not match these trends in kPL and kPB. As shown in Table 1, this subject was distinct in having genotype-negative apical HCM and elevated insulin, which could have contributed to the observed differences.
Acknowledgements
We would like to acknowledge assistance with hyperpolarized experiments from Kimberly Okamoto, Mary Frost, Heather Daniel, James Slater, Andrew Riselli, Evelyn Escobar, and Romelyn Delos Santos.
This work was supported by funding from a UCSF Resource Allocation Program Team Science award, Myokardia Inc. Myoseeds program and NIH grants R33HL161816, P41EB013598, and U24CA253377. ND received post-doctoral training funding from the American Heart Association (grant number 20POST35200152)
References
[1] Vakrou S, Abraham MR. Hypertrophic cardiomyopathy: a heart in need of an energy bar? Front Physiol. 2014;5:309. PMCID: PMC4137386
[2] Agger, Peter, et al. “Magnetic Resonance Hyperpolarization Imaging Detects Early Myocardial Dysfunction in a Porcine Model of Right Ventricular Heart Failure.” European Heart Journal - Cardiovascular Imaging, vol. 21, no. 1, 2019, pp. 93–101., https://doi.org/10.1093/ehjci/jez074.
[3]Timm, Kerstin N., Jack J. Miller, John A. Henry, and Damian J. Tyler. “Cardiac Applications of Hyperpolarised Magnetic Resonance.” Progress in Nuclear Magnetic Resonance Spectroscopy 106–107 (June 1, 2018): 66–87. https://doi.org/10.1016/j.pnmrs.2018.05.002.
[4] Tang S, Milshteyn E, Reed G, Gordon J, Bok R, Zhu X, Zhu Z, Vigneron DB, Larson PEZ. A regional bolus tracking and real-time B1 calibration method for hyperpolarized 13 C MRI. Magn Reson Med. 2019 Feb;81(2):839–851. PMCID: PMC6289616
[5] Cunningham CH, Lau JYC, Chen AP, Geraghty BJ, Perks WJ, Roifman I, Wright GA, Connelly KA. Hyperpolarized 13C Metabolic MRI of the Human HeartNovelty and Significance: Initial Experience. Circ Res. 2016 Nov 11;119(11):1177–1182. PMID: 27635086
[6] Gordon JW, Autry AW, Tang S, Graham JY, Bok RA, Zhu X, Villanueva-Meyer JE, Li Y, Ohilger MA, Abraham MR, Xu D, Vigneron DB, Larson PEZ. A variable resolution approach for improved acquisition of hyperpolarized 13 C metabolic MRI. Magn Reson Med. 2020 Dec;84(6):2943–2952. PMCID: PMC7719570
[7] Larson PEZ, Chen HY, Gordon JW, Korn N, Maidens J, Arcak M, Tang S, Criekinge M, Carvajal L, Mammoli D, Bok R, Aggarwal R, Ferrone M, Slater JB, Nelson SJ, Kurhanewicz J, Vigneron DB. Investigation of analysis methods for hyperpolarized 13C-pyruvate metabolic MRI in prostate cancer patients. NMR Biomed. 2018 Nov;31(11):e3997. PMID: 30230646
[8] Hyperpolarized-MRI-Toolbox [Internet]. Available from: https://github.com/LarsonLab/hyperpolarized-mri-toolbox doi: 10.5281/zenodo.1198915
Figures