0175
Myocardial oxygen extraction fraction moderately correlates with fibrosis burden in patients after heart transplant: a MR metabolism study
Jing Wang1, Ran Li2, Xiaona Fu3, Yang Yang4, Xiaojie Sun3, Shenglei Shu3, Jie Zhao3, Xiangchuang Kong3, and Jie Zheng2
1Radiology, Union hospital, Wuhan, China, 2Mallinckrodt Institute of Radiology, Washington University in St Louis, St. Louis, MO, United States, 3Union hospital, Wuhan, China, 4Radiology and Biomedical Imaging, University of California San Francisco, San Francisco, CA, United States
1Radiology, Union hospital, Wuhan, China, 2Mallinckrodt Institute of Radiology, Washington University in St Louis, St. Louis, MO, United States, 3Union hospital, Wuhan, China, 4Radiology and Biomedical Imaging, University of California San Francisco, San Francisco, CA, United States
Synopsis
Keywords: Myocardium, Transplantation, oxygen metabolism
Microvascular dysfunction and excessive fibrous burden are independent prognostic factors after heart transplantation. A new novel cardiovascular MR technique for the measurement of myocardial oxygen extraction fraction was evaluated for a feasibility study in 10 patients after heart transplantation. It was observed that oxygen extraction fraction was significantly correlated with myocardial extracellular volume (diffuse fibrosis indicator). Further research with more patients is warranted to explore this new CMR metabolism index for early diagnosis of cardiac dysfunction in these patient cohorts.Introduction
Acute and/or chronic cellular rejection after heart transplantation (HTx) is associated with impaired mitochondrial bioenergetics, leading to long-term graft loss and mortality.1 However, there is very limited tools available for non-invasive assessment of this metabolic changes in HTx patients. A semi-quantitative oxygenation-sensitive (OS) cardiovascular magnetic resonance (CMR) approach shows significantly reduced OS response in HTx patients, compared to healthy controls.2 Importantly, the OS response is negatively and mildly correlated (r = -0.352, p = 0.03) with myocardial extracellular volume (ECV) that is associated with cellular rejection.3 We recently developed a quantitative CMR method to directly estimate myocardial oxygen extraction fraction (mOEF) with assistance of deep learning methods (submitted in another abstract to 2023 ISMRM). The purpose of this preliminary study is to explore the feasibility of this mOEF method for assessing oxygen metabolism in HTx patients.Methods
Patients: Ten HTX patients (age: 54 ± 9 years, post-transplant time: 5.8 ± 2.2 years, 2 females) were scanned with a comprehensive CMR protocol, including myocardial function, native and post-contrast T1, native T2, and mOEF imaging. The study was performed at a 3.0 T Siemens Skyra system (Siemens Healthineers, Erlangen, Germany)CMR protocol: Routine CMR cine imaging were performed to measure myocardial left ventricular function along long and short-axis views by utilizing a 2D balanced steady state free precession (SSFP) cine sequence (TR/TE = 3.0/1.5 msec, field of view or FOV = 340 x 245 mm2, and matrix size = 256 x 184). Native T1 and post-contrast T1 maps were acquired with the MOLLI sequences (TR/TE = 2.2/1.1 msec, FOV = 340 x 243 mm2, and matrix size = 224 x 160). The native T2 maps were obtained by utilizing a T2 prepared gradient-echo sequence with TE = 0, 30, 55 msec and similar resolution as T1 maps. All of these images were acquired at three short-axis slices (base, mid, and apex) with breath-hold. Post-contrast T1 maps were obtained after the administration of 0.1 mmol/kg gadolinium contrast agent (Multihance, Bracco Diagnostics, NJ).
The mOEF images were acquired by using a 2D Asymmetric-spin-echo (ASE) prepared SSFP readout sequence with free breathing along three short-axis view slices as T1 and T2 imaging. The ASE preparation module consisted of 90o-180o-180o-90o RF pulses with alternate 0 and 180o phase to reduce B0 and B1 inhomogeneity. The two 180o pulses shift τ times towards opposite directions to create a single-shot ASE signal. In this application, sixteen images were acquired every other 4 heart beats with 16 different τ times. Image resolution was 1.7 x 1.7 mm2.
Image and data analysis: Except mOEF images, all other images were post-processed with CVi42 software (Circle Cardiovascular Imaging Inc, Calgary, AB, Canada). The ECV maps were obtained via native and post-contrast T1 maps. The sixteen mOEF images were first performed retrospectively with motion correction and then mOEF maps were created with deep learning methods developed in house. All maps were analyzed in a 16-segment model, as well as for global values by averaging 16 myocardial segmental data. Regression analysis were performed to compare different CMR parameters (LV function, native T1, T2, and mOEF), as well as patient demographic data (age and post transplantation time).
Results
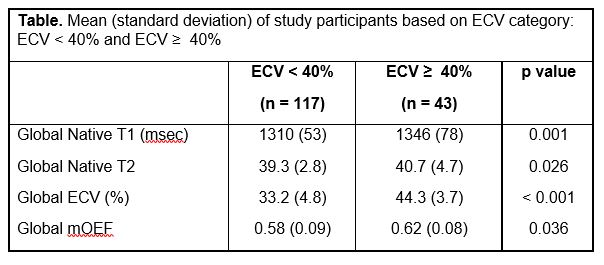
All segmental ECV were larger than normal 25% in these HTx patients. Healthy mOEF values are approximately 0.6 – 0.7, as reported in literature.4,5 No apparent motion or inhomogeneity artifacts were observed in all mOEF maps. If separating patients into two groups based on left ventricle ejection fraction (LVEF), i.e., LVEF ≥ 50% (n= 7) and LVEF < 50%, there was no significant difference in any of global CMR or demographics parameters. If segmental data sets were analyzed based on two categories of ECV: ECV < 40% and ECV > 40%, all native T1, T2, and mOEF show significant difference between two categories (Table). Figure 1 shows one example of ECV map and mOEF map in one HTx patient, as well as bullseye display of ECV and mOEF values in three slices. Moderately high ECV (30 – 40%) is associated with relatively high mOEF. However, in the posterior and septal insertion area (arrows), a high ECV (> 50%) and a low mOEF (~ 0.3) are observed, indicating impaired oxygen metabolism in this area.Figure 2 demonstrates correlation of ECV and mOEF on a myocardial segmental basis. The regression analysis shows moderately correlation for ECV < 40% (r = 0.41, p < 0.0001), but no correlation for ECV ≥ 40%. If the analysis is performed on a patient basis, mOEF correlated very strongly with ECV for ECV < 40% (r = 0.84, p = 0.02, n = 7). There was no other significant correlation between mOEF and other CMR (T1, T2, LV function) and patient demographics parameters.
Conclusion
We have demonstrated the feasibility of CMR mOEF imaging in HTx patients. While there was heterogeneous distribution of mOEF, there was a moderate and significant correlation between mOEF and moderately high ECV, on both segmental and patient bases. A large sample size of patients are needed to explore mOEF expression in patients with full spectrum of ECV to understand how this technique can be used for early diagnosis of metabolic dysfunction in HTx patients.Acknowledgements
No acknowledgement found.References
1. Scheiber D, et al. ESC Heart Failure. 2021; 8: 4674-4684
2. Iannino N, et al. Transplantation. 2021;105:1347-1355.
3. Dolan RS, et al. JACC Cardiovasc Imaging. 2019;12:1632–1641.
4. Agnstini D, et al , Clin Nucl Med. 2001; 26: 41-49.
5 Kudomi N, et al, Front Physiol. 2019; 10: 741
Figures
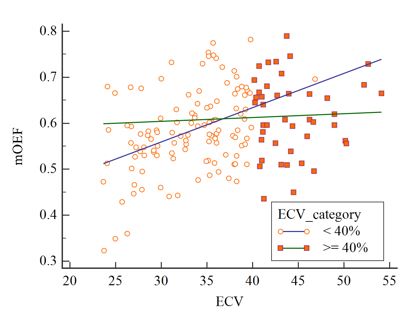
Figure 1. The example of ECV
map and mOEF map in one HTx patient (top) and corresponding bullseye display
(bottom). The arrow points to the insertion area with high ECV and low mOEF.
The images at top row use the same colorbar scales as those at bottom.
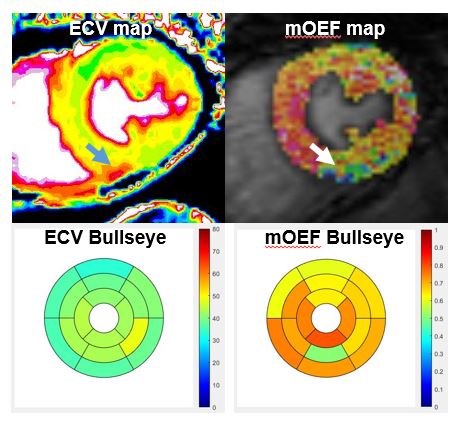
Figure 2. The plot of mOEF
vs. ECV on a myocardial segmental basis. The correlation lines are obtained for
ECV separated by a 40% criterion.
Table
DOI: https://doi.org/10.58530/2023/0175