0173
Myocardial T2ρ Mapping in Small Animals: Comparison of Balanced Spin-Lock and Malcolm-Levitt Preparations1Department of Internal Medicine I, University Hospital Würzburg, Würzburg, Germany, 2Experimental Physics 5, University of Würzburg, Würzburg, Germany, 3Department of Internal Medicine I, Divisions of Cardiology and Nephrology, University Hospital Würzburg, Würzburg, Germany, 4Comprehensive Heart Failure Center (CHFC), Würzburg, Germany
Synopsis
Keywords: Relaxometry, Quantitative Imaging, Spin-Lock, T1ρ, T2ρ
In this work, we propose myocardial T2ρ mapping as a potential and more robust alternative to conventional T2 quantification. Our new approach for T2ρ imaging, which is based on Malcolm-Levitt preparations with zero inter-pulse delays, was compared with established pulse sequences for T2, T1ρ and T2ρ in both phantom and in vivo experiments. In summary, the new preparatory pulse sequence was shown to meet the demanding requirements of myocardial T2ρ mapping at high magnetic field strength and to outperform conventional T2ρ preparations using balanced spin-locking.Introduction
Quantification of relaxation times in the myocardium enables specific and noninvasive tissue characterization. T1 relaxation, which is sensitive to processes in the MHz range, reflects intracellular as well as extracellular tissue water characteristics and can be used to assess ischemic cardiomyopathy [1]. T1ρ relaxation utilizes a shift of resonance to the Hz…kHz range by means of the spin-lock (SL) method and can therefore be applied for the analysis of macromolecular remodeling and the detection of myocardial fibrosis [2]. In contrast, the T2 relaxation caused by dipole-dipole interaction is dominated by a spectral density term that accounts for static field components and therefore shows maximum sensitivity to static fields in the molecular environment of the spins. In clinical practice, T2 relaxation is an important indicator for the detection of myocardial edema, myocardial injury or intramyocardial hemorrhage [1]. However, precise quantification of T2 is particularly challenging due to motion, blood flow and the influence of field inhomogeneities, especially in high-field cardiac MRI (cMRI) [3].In this study, we present a potential alternative to T2 quantification that has not yet been considered for cMRI. According to relaxation theory, the T2ρ relaxation, which occurs during the SL-condition in the plane perpendicular to the SL-pulse, shows a distinct sensitivity to static fields which resembles T2 [2]. In the following, we compare the performance of myocardial T2, T1ρ and T2ρ quantification in small animal experiments at high-field MRI. Moreover, we compare a classical T2ρ preparation with our newly proposed approach based on Malcolm-Levitt (MLEV) pulses to generate pure T2ρ contrast.
Methods
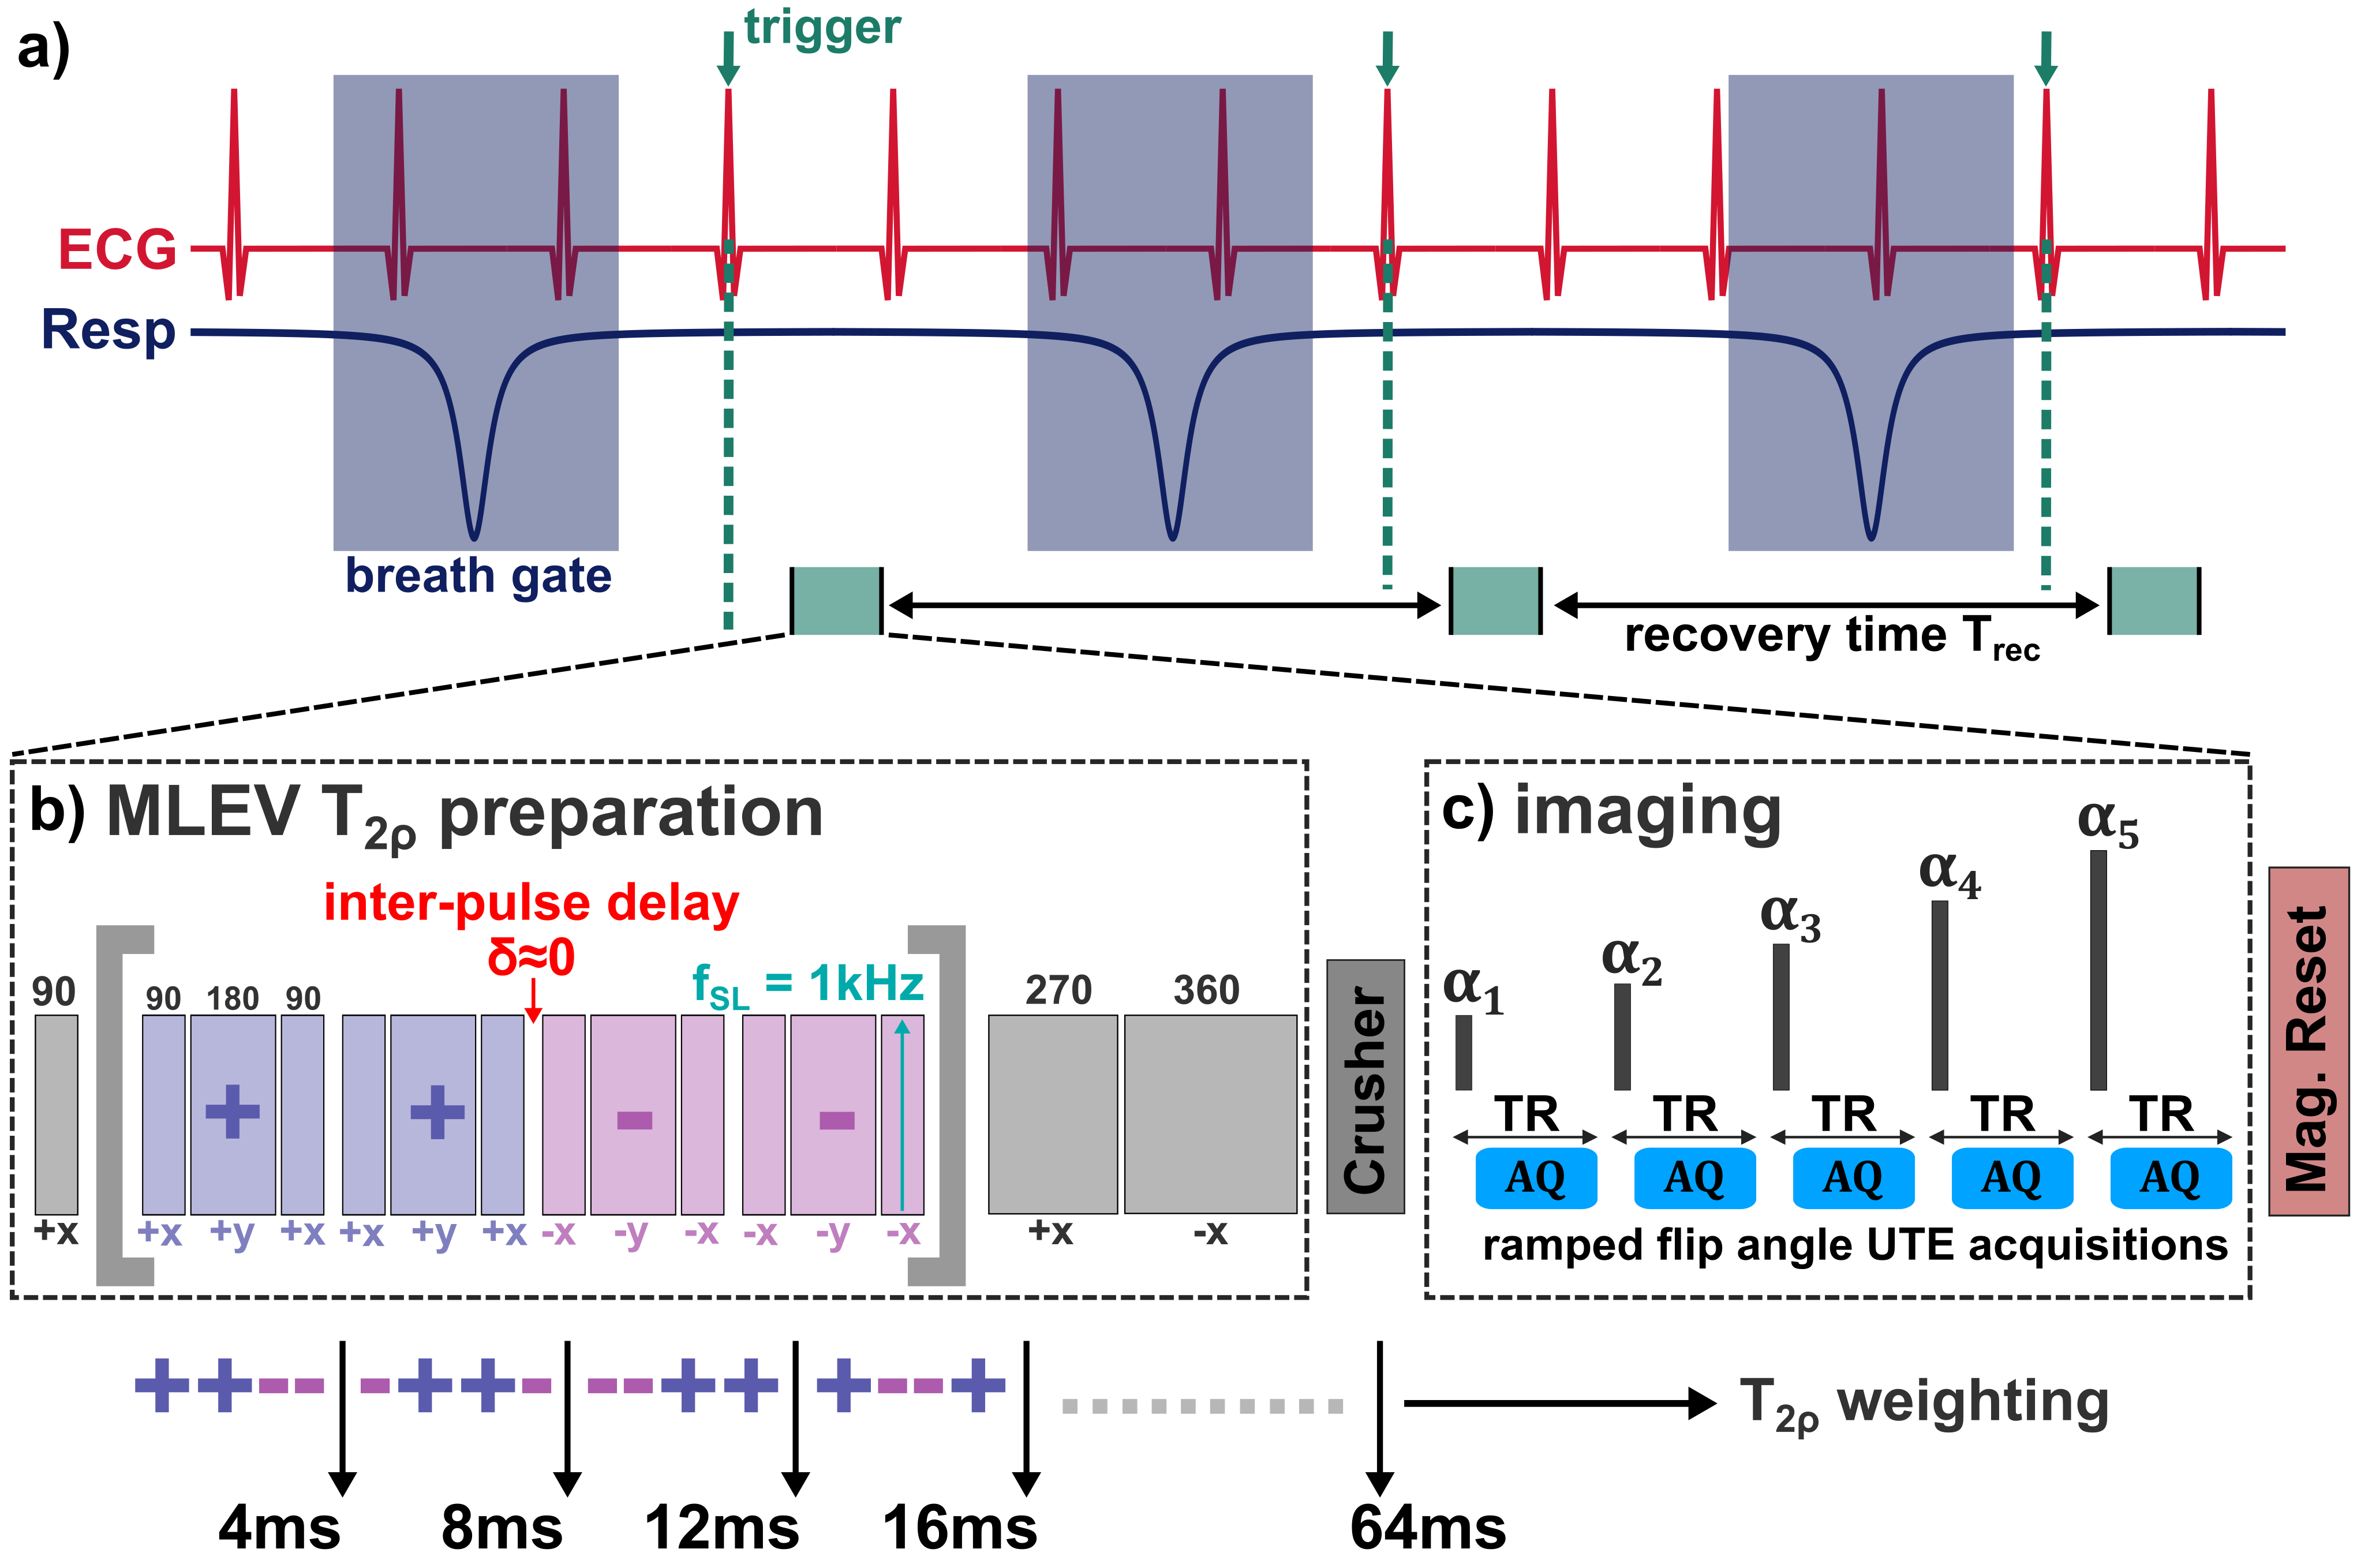
All measurements were performed on a 7.0T small animal imaging system (Bruker PharmaScan, BioSpin MRI GmbH, Ettlingen, Germany). Different pulse preparation schemes were used to generate T2, T1ρ and T2ρ contrast and to quantify relaxation times. T2 contrast was prepared by a CPMG (Carr-Purcell-Meiboom-Gill) sequence. T1ρ and T2ρ were generated by balanced-SL (BSL) preparations [4]. In addition, a new approach for T2ρ quantification was implemented based on a MLEV pulse sequence [3]. However, in contrast to [3], the inter-pulse delays were set to zero, causing the MLEV pulses to perform like SL pulses and solely generate T2ρ contrast (Figure 1). The continuous wave SL pulse amplitude used for all experiments was fSL=1000Hz. The new method was first validated in phantom experiments (Bovine Serum Albumin, BSA, concentrations: 10%, 15%, 20%) in combination with a TSE readout and subsequently trialed in 3 mice with a KWIC-filter accelerated radial UTE readout optimized for cMRI [5]. Both image quality and the robustness of quantification were evaluated and compared.Results
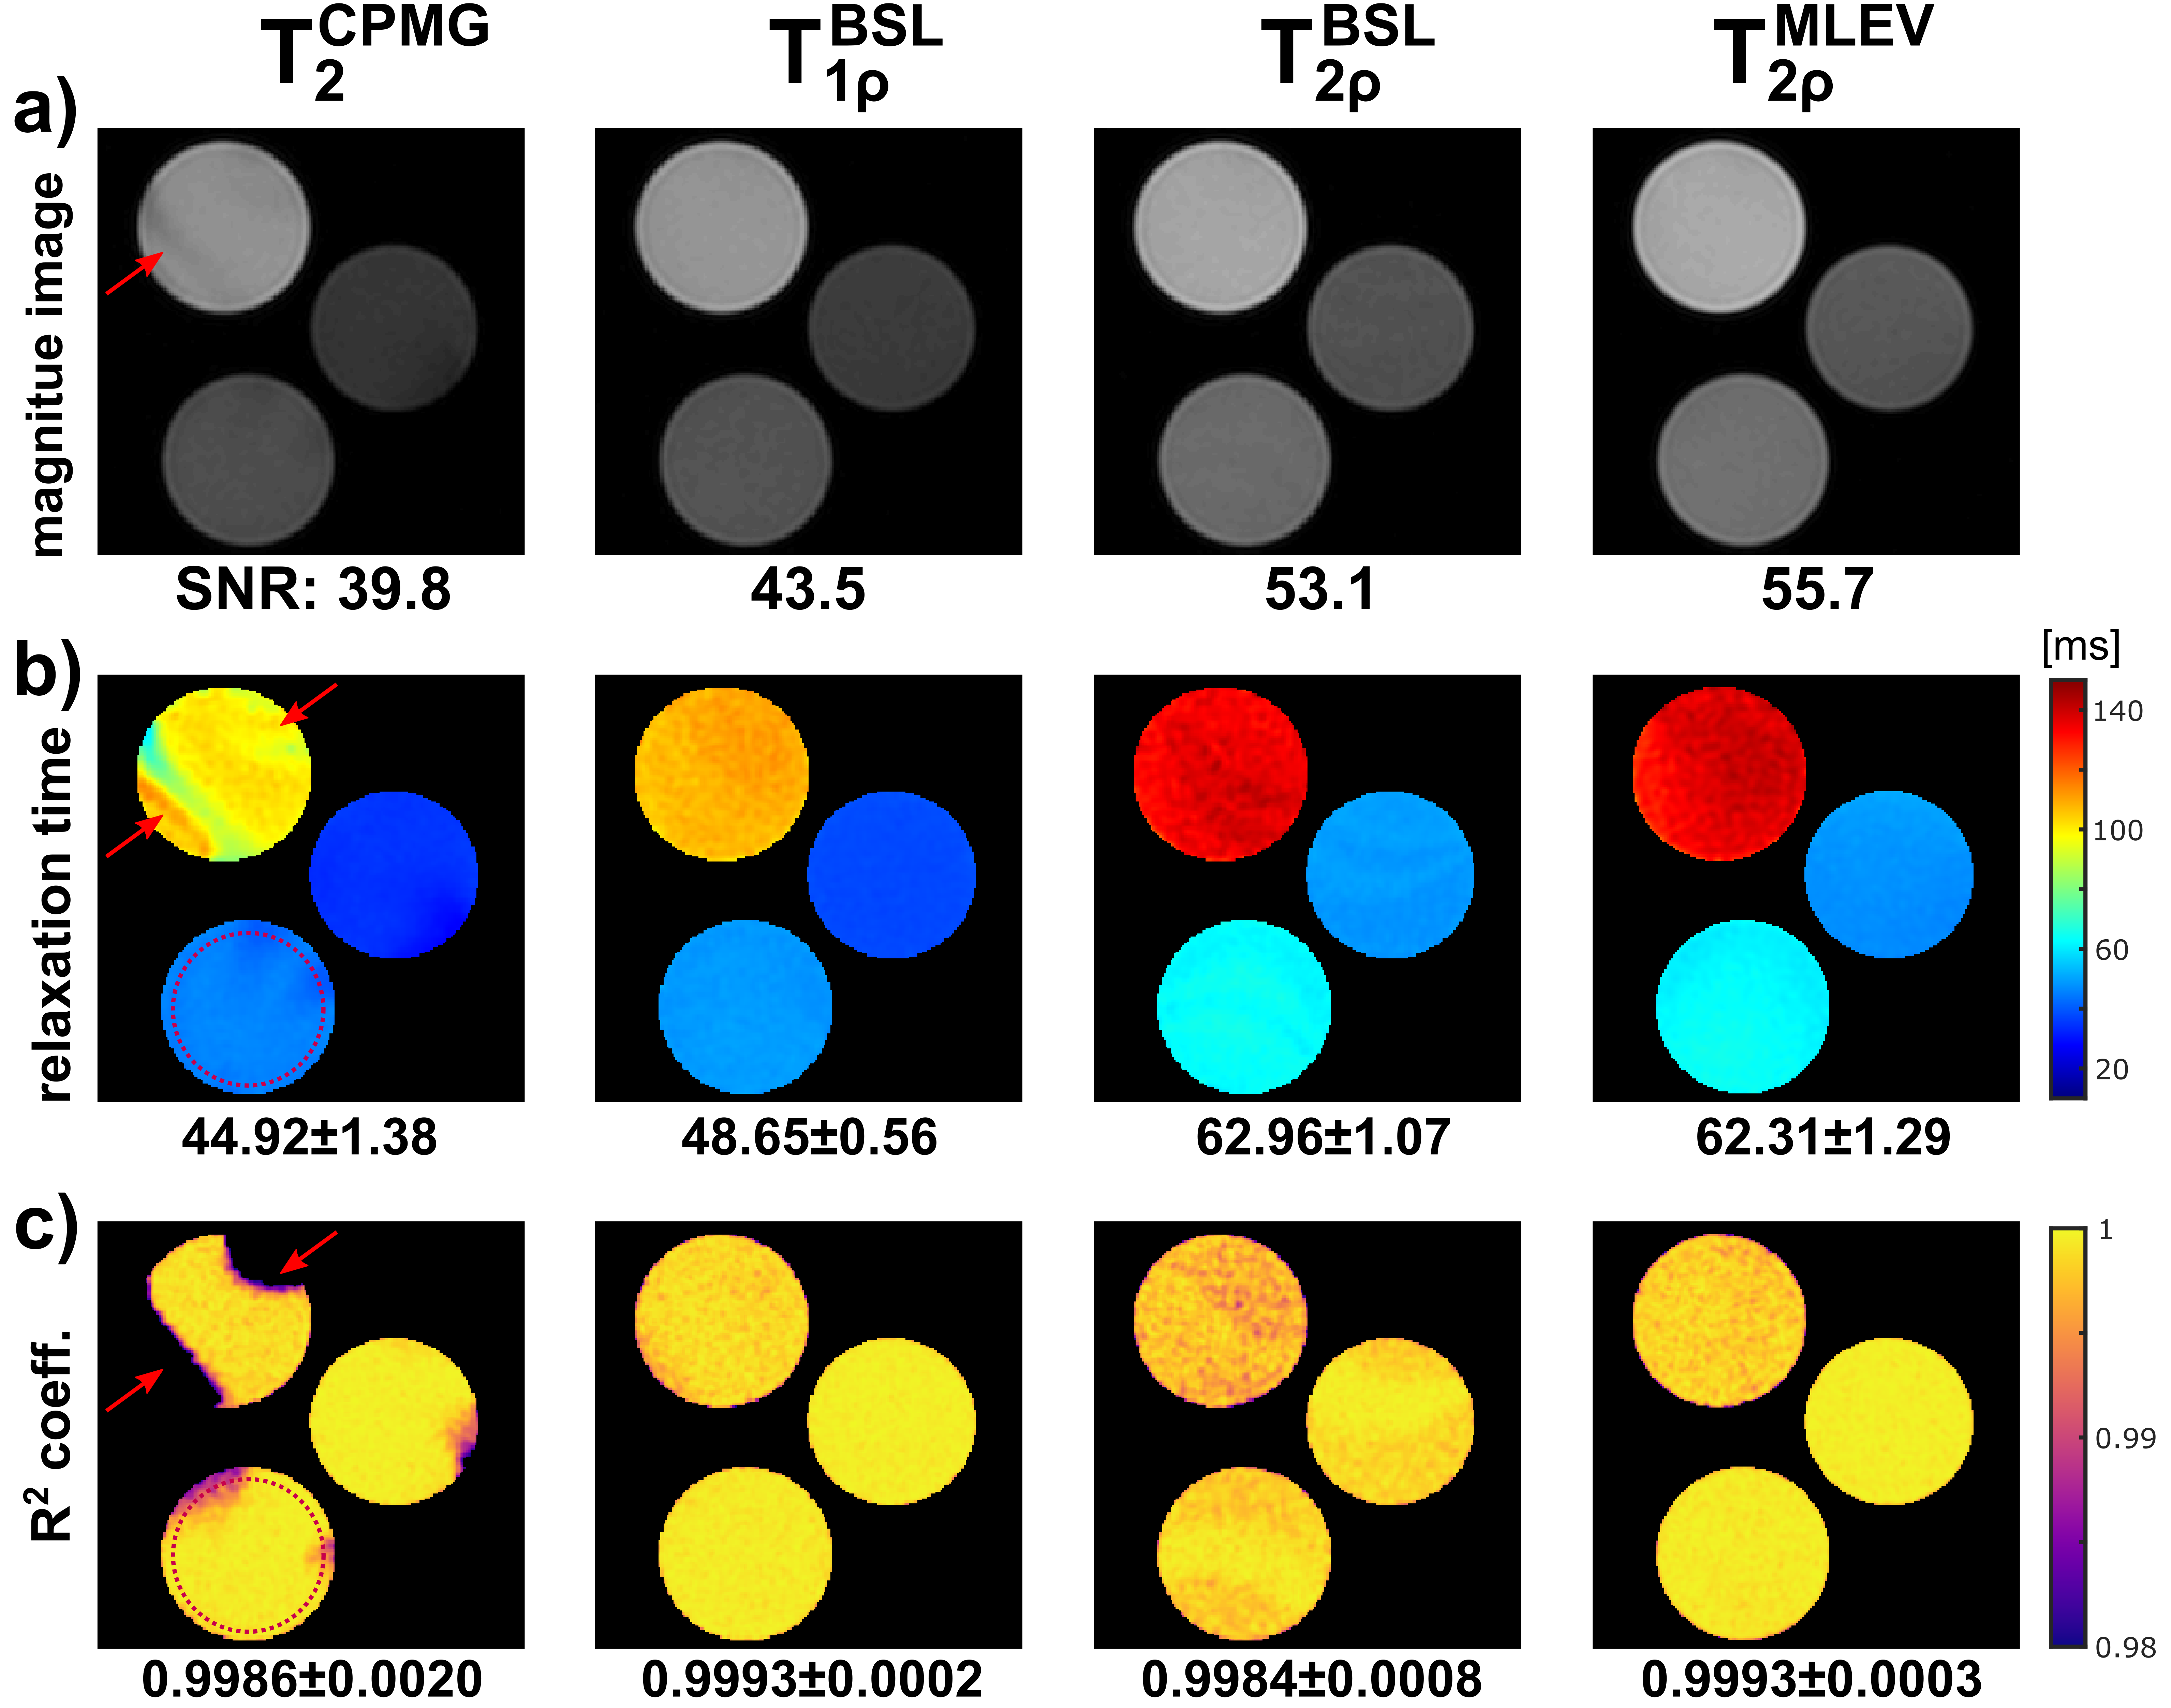
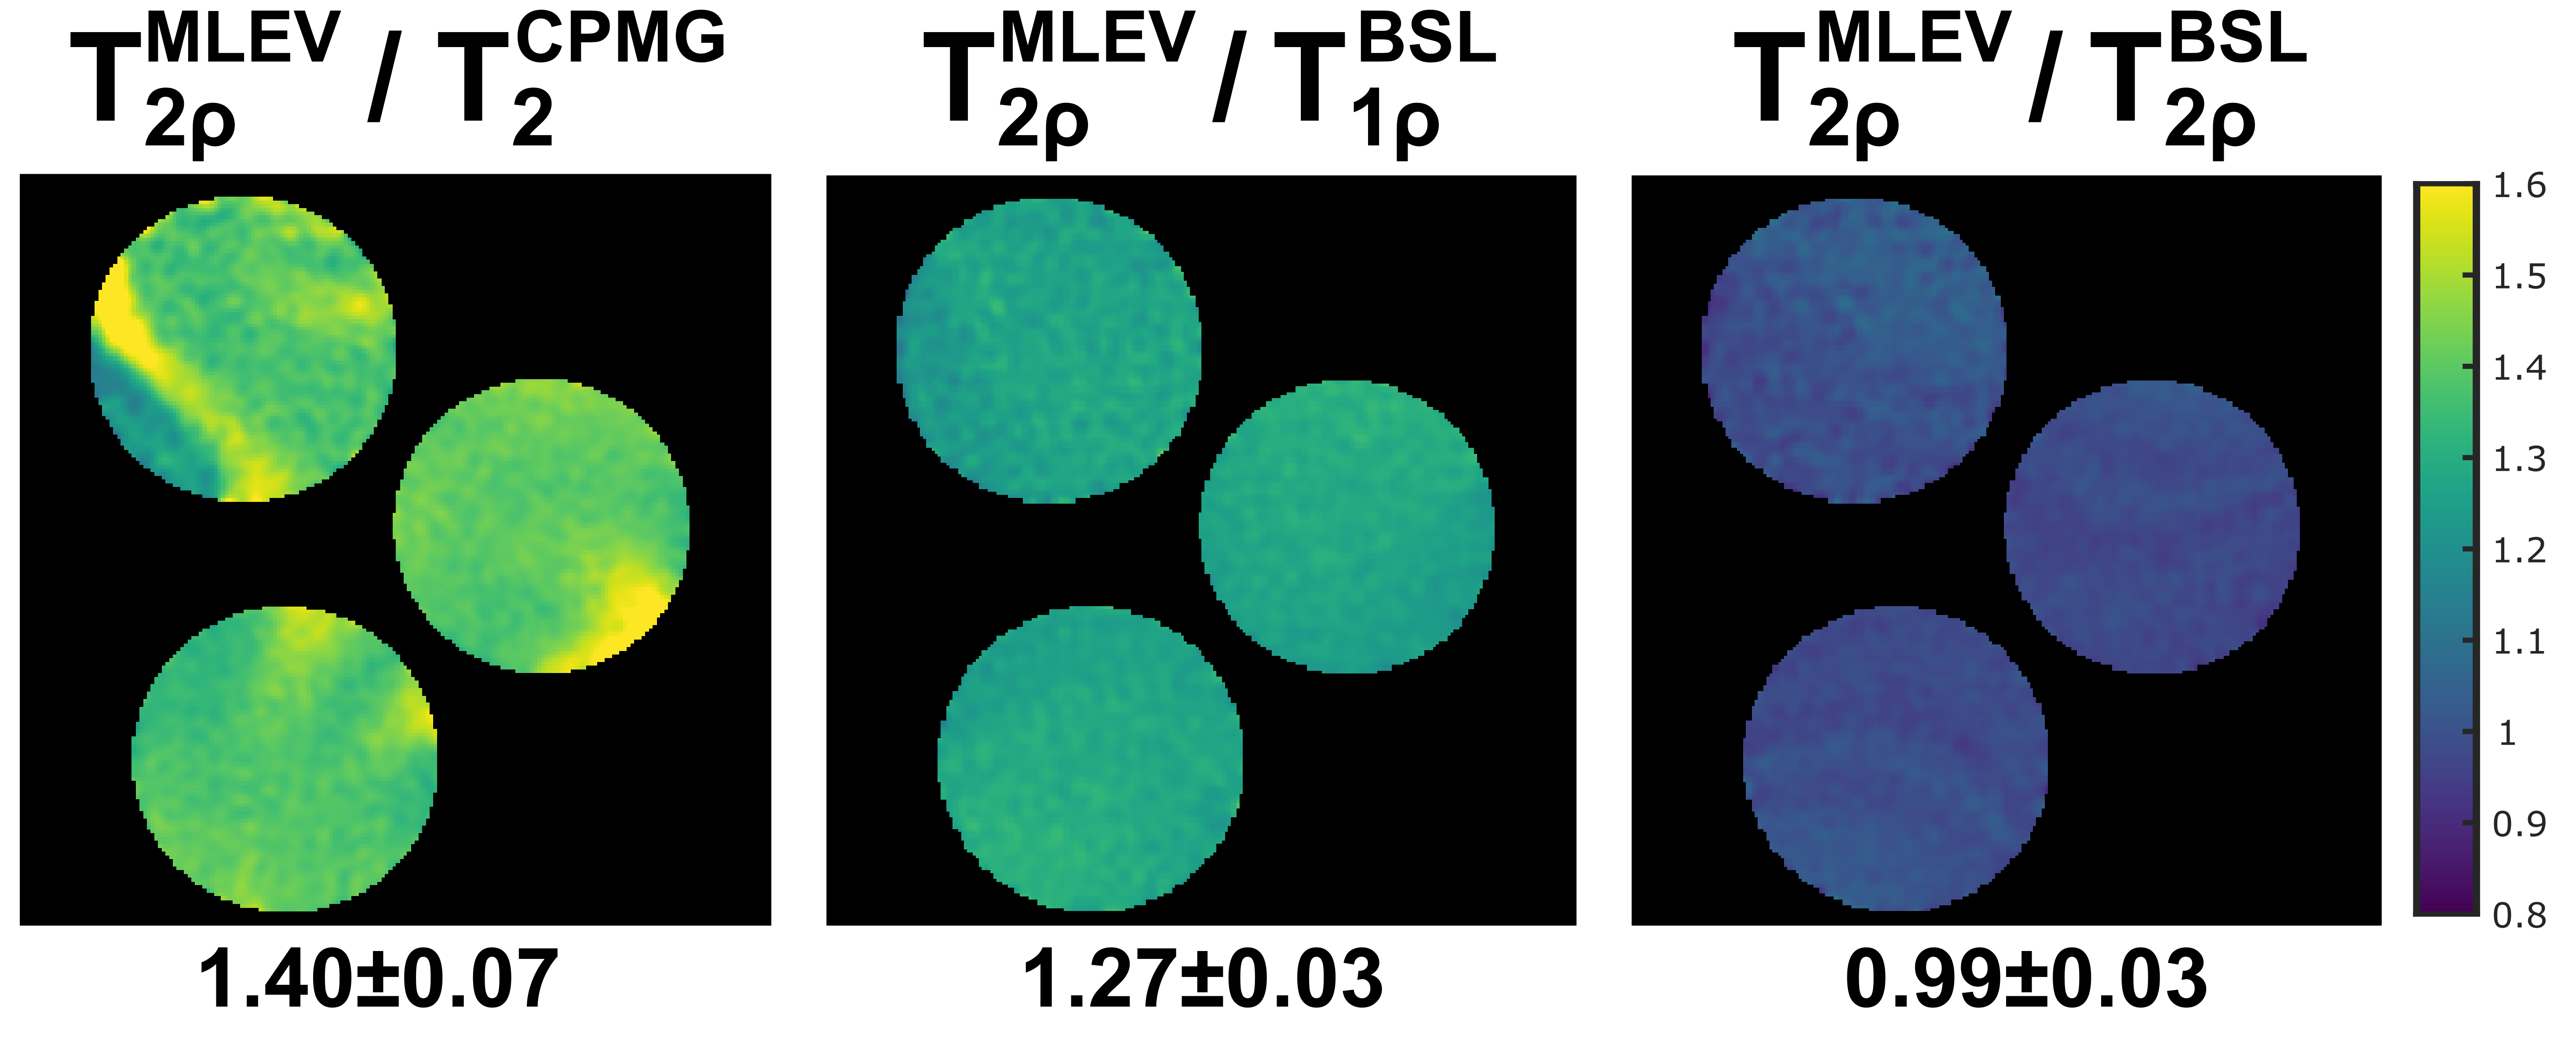
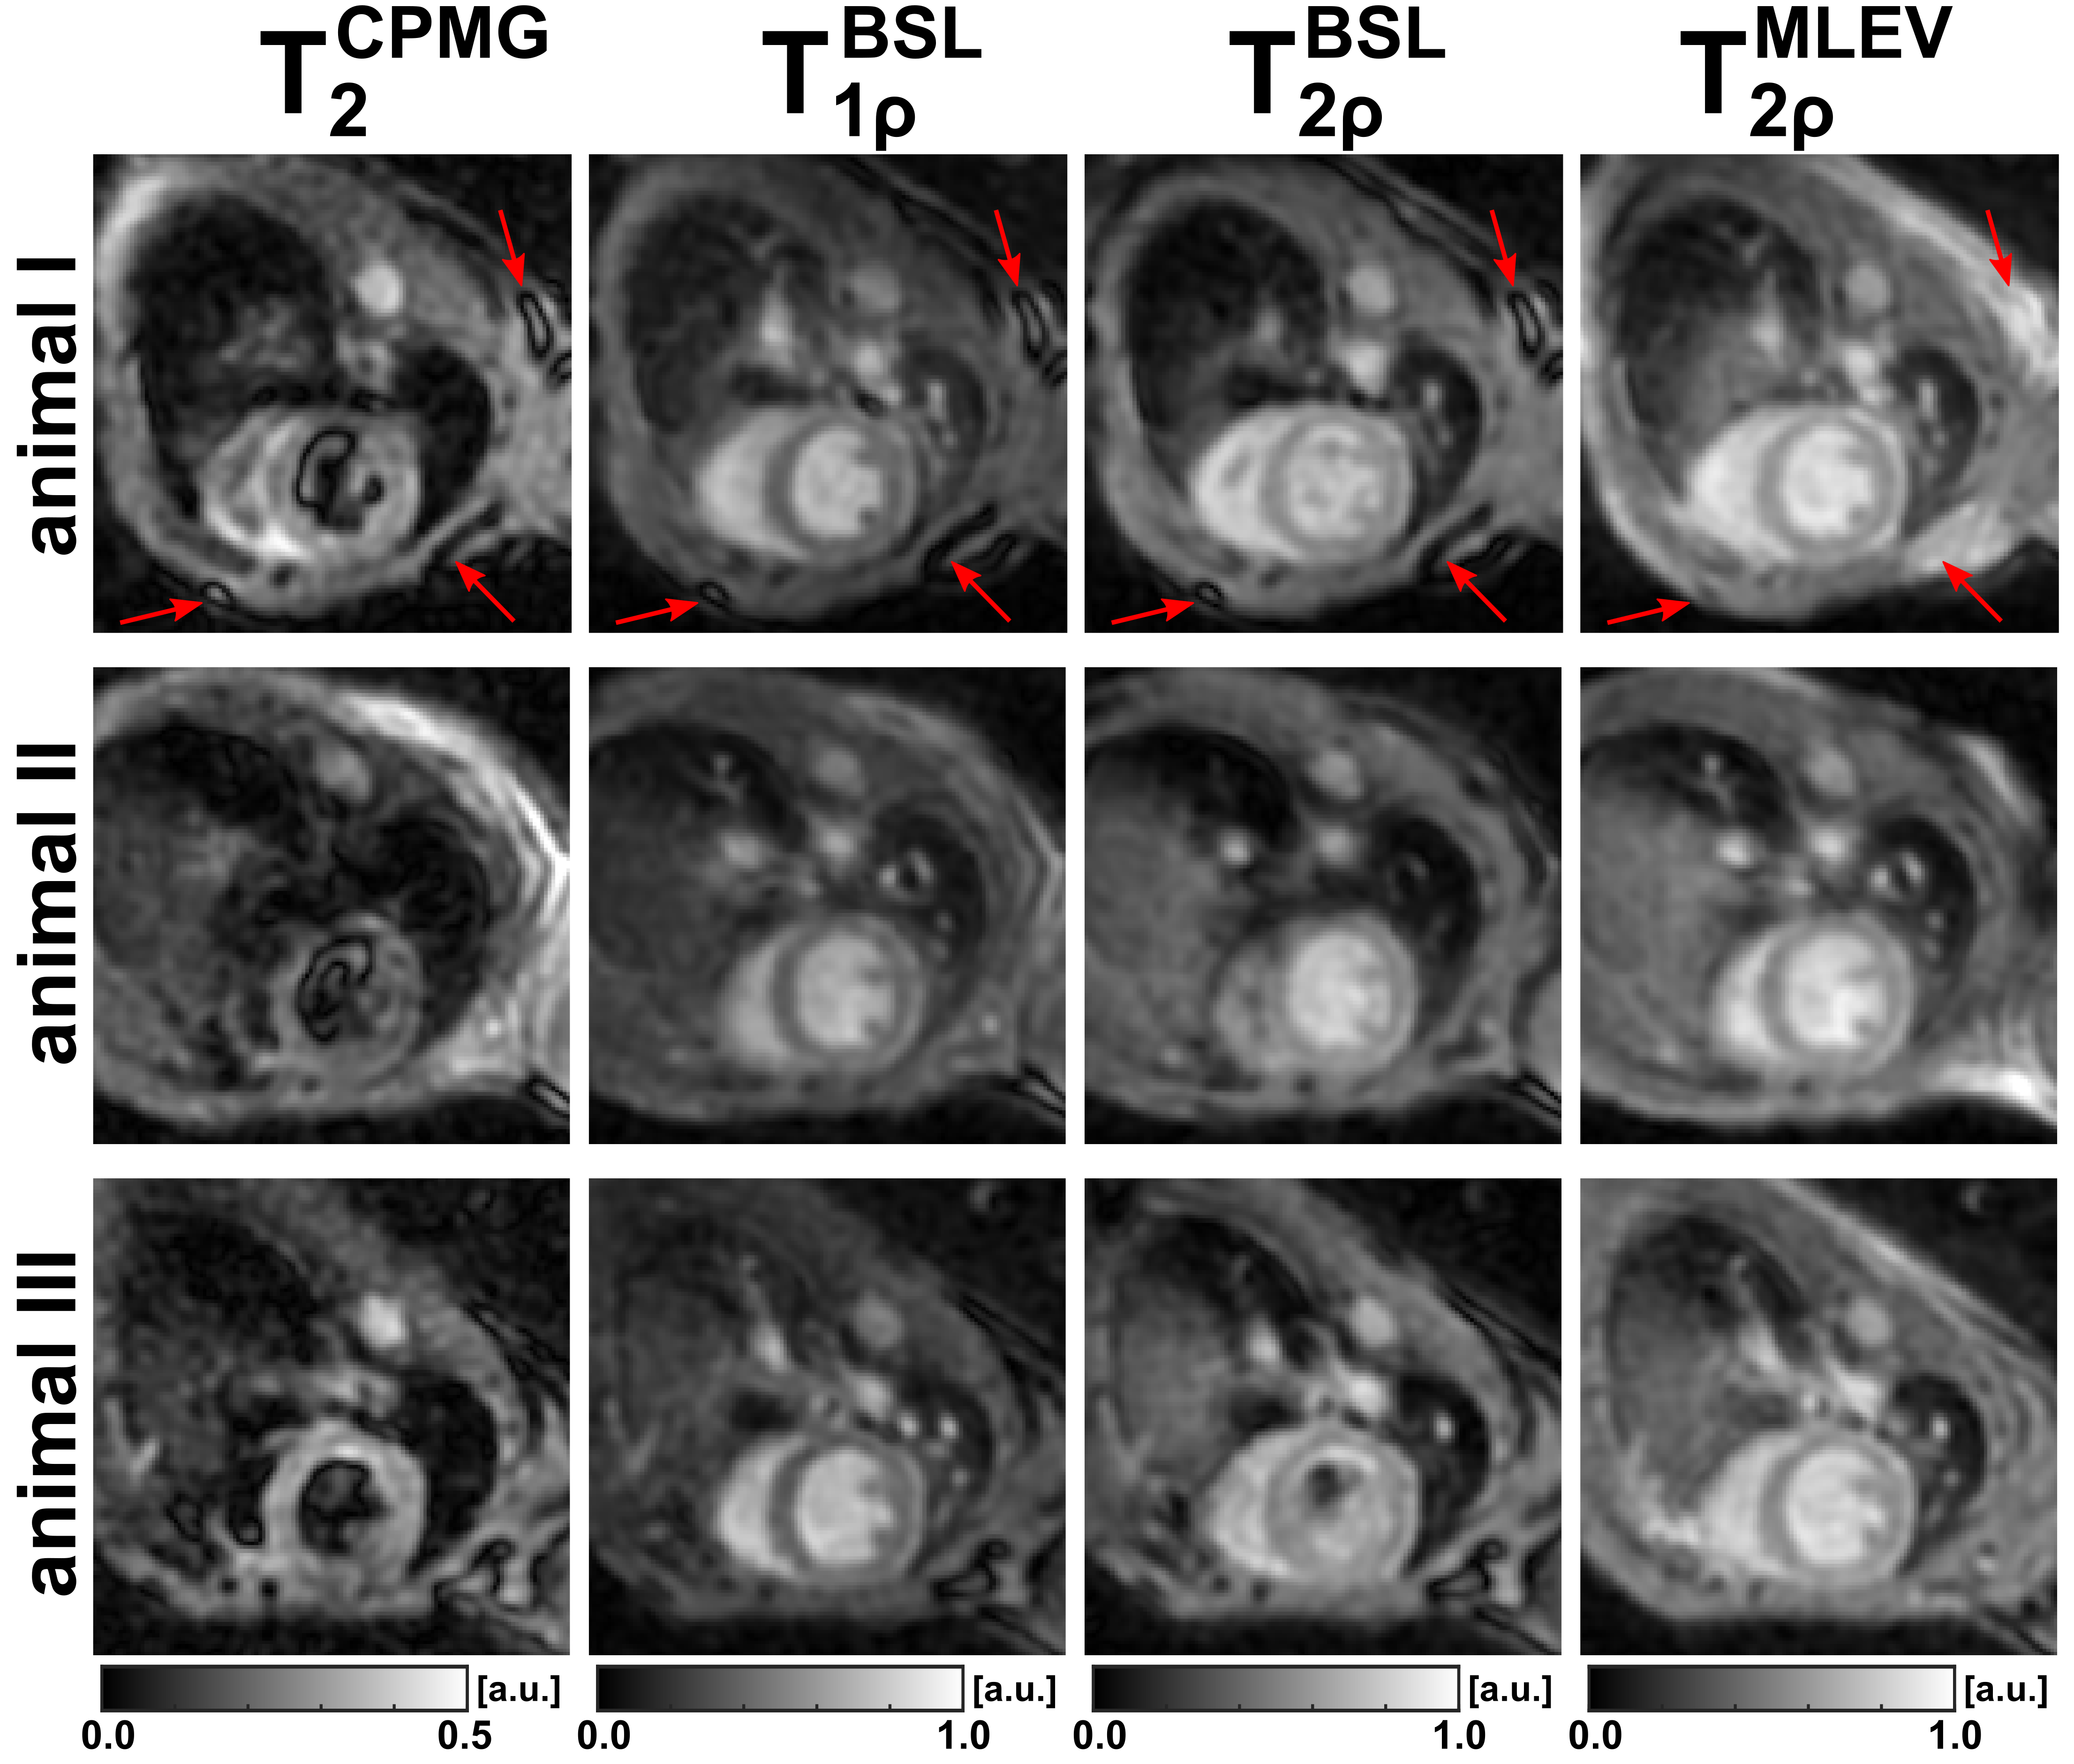
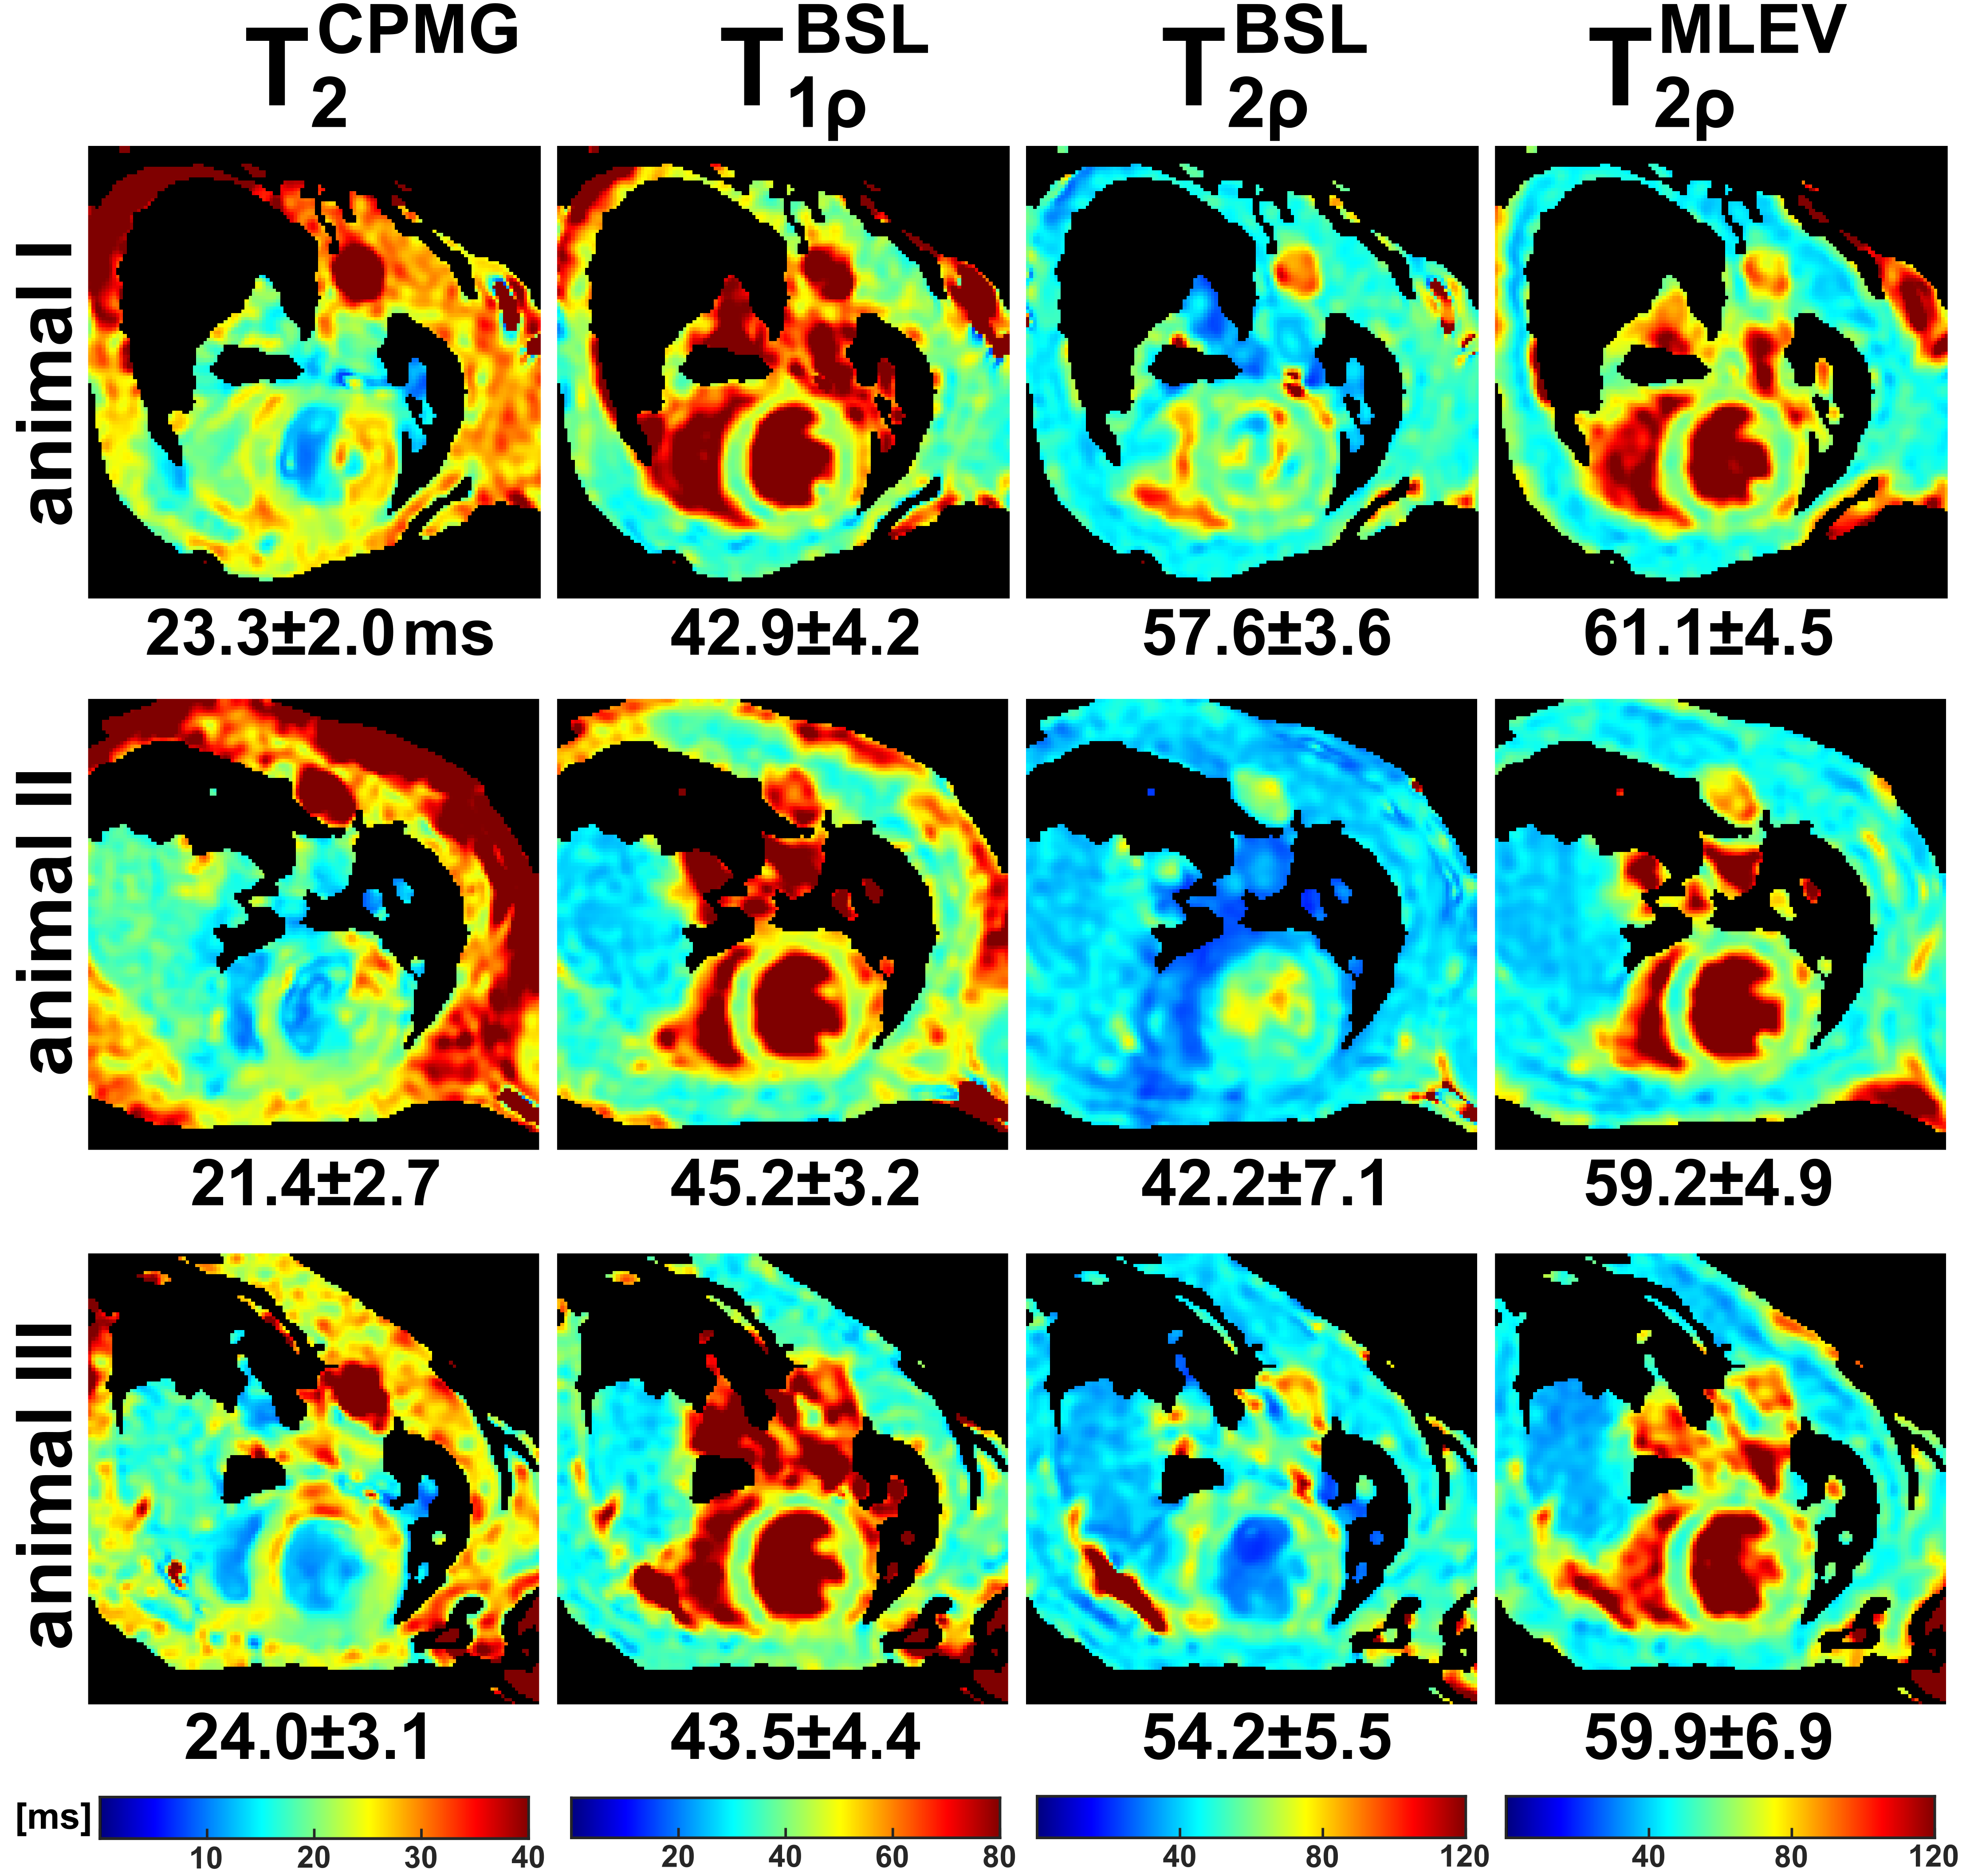
The results of the phantom experiments are shown in Figure 2 and 3. In a SNR analysis, the highest image quality was found for the MLEV preparation (signal-to-noise-ratio, SNR=55.7). As expected from relaxation theory, T2<T1ρ<T2ρ holds true. Approximately constant ratios T2ρ/T2=1.40±0.07 and T2ρ/T1ρ=1.27±0.03 were observed for all phantoms. No significant differences were observed between the BSL- and MLEV-T2ρ preparations (avg. BSL-T2ρ=62.96±1.07ms vs. MLEV-T2ρ=62.31±1.29ms in a circular ROI). The mean deviation of the two methods was only 0.74% for all phantoms.In the in vivo experiments, significant artifacts were observed for the T2 preparation (Fig. 4), whereas the T1ρ and T2ρ preparations provide higher image quality in all animals. Nevertheless, quantification of the relaxation times (Fig. 5) yielded a finding that is not consistent with the phantom experiments. Here, the T2 and BSL-T2ρ preparations perform insufficiently with reduced R2 values in the left ventricle (LV). For T2, an average of 22.9±2.6ms (R2=0.979±0.013) and for BSL-T2ρ, 51.4±5.4ms (R2=0.983±0.011) were measured. The BSL-T1ρ and MLEV-T2ρ maps, on the other hand, show diagnostic image quality. Here, 43.9±3.9ms (R2=0.9915±0.0049) and 60.0±3.4ms (R2=0.9902±0.0049) were measured respectively. Thus, the BSL-T2ρ and MLEV-T2ρ results do not agree under in vivo conditions.
Discussion
In the present study, myocardial T2ρ mapping was tested at a high magnetic field strength. While no significant differences between BSL and MLEV preparations were observed in the phantom experiments, a significant difference was observed in vivo. BSL-based T2ρ quantification failed when applied in vivo, whereas the MLEV technique, which generates pure T2ρ contrast due to the elimination of inter-pulse delays, yields excellent image quality and enables robust quantification. A likely reason for the enhanced performance is the continuous refocusing and thus the minimization of the free dephasing of transverse magnetization. Furthermore, MLEV-T2ρ shows significantly higher robustness compared to CPMG-based T2 preparation. Summarized, an image quality suitable for diagnostic evaluation could be achieved for BSL-T1ρ and MLEV-T2ρ. Future studies are planned to demonstrate that the combination of these techniques allow detailed tissue characterization and detection of fibrosis, edema and hemorrhage, without the need of contrast agents. We further plan to assess T1ρ dispersion via a combined evaluation of T1ρ and MLEV-T2ρ and to establish a myocardial fibrosis index on this basis according to the proposal of Zhang et al [6].Conclusion
MLEV preparations with zero inter-pulse delays allow robust quantification of T2ρ even under the demanding requirements of high-field cardiac MRI. MLEV-T2ρ is a potential candidate for native detection of edema and hemorrhage and may also have relevance in the human setting.Acknowledgements
The Maack Lab (University Hospital Würzburg) provided the animals for the in vivo measurements. All experiments were approved by the local authorities (Approval RUF55.2.2-253-2-735) and conducted in accordance with institutional guidelines.
This work was supported by CHFC-grants to Peter Nordbeck and Maximilian Gram (both MO.6) and Wolfgang Bauer (MY.10). The CHFC was supported by the Federal Ministry of Education and Research (Grant Numbers 01EO1004 and 01EO1504). Martin Christa was supported by MY.10 and the German Research Council, Project No. 413657723 (Clinician Scientist Program UNION CVD).
References
[1] O'Brien AT, et al. T2 mapping in myocardial disease: a comprehensive review. J Cardiovasc Magn Reson. 2022 Jun 6;24(1):33. doi: 10.1186/s12968-022-00866-0
[2] Gilani IA, Sepponen R. Quantitative rotating frame relaxometry methods in MRI. NMR Biomed. 2016 Jun;29(6):841-61. doi: 10.1002/nbm.3518
[3] Coolen BF, et al. Quantitative T2 mapping of the mouse heart by segmented MLEV phase-cycled T2 preparation. Magn Reson Med. 2014 Aug;72(2):409-17. doi: 10.1002/mrm.24952
[4] Gram M, et al. Balanced spin-lock preparation for B1 -insensitive and B0 -insensitive quantification of the rotating frame relaxation time T1ρ. Magn Reson Med. 2021 May;85(5):2771-2780. doi: 10.1002/mrm.28585
[5] Gram M, et al. Fast myocardial T1ρ mapping in mice using k-space weighted image contrast and a Bloch simulation-optimized radial sampling pattern. MAGMA. 2022 Apr;35(2):325-340. doi: 10.1007/s10334-021-00951-y
[6] Zhang Y, et al. MR extracellular volume mapping and non-contrast T1ρ mapping allow early detection of myocardial fibrosis in diabetic monkeys. Eur Radiol. 2019 Jun;29(6):3006-3016. doi: 10.1007/s00330-018-5950-9
Figures