0171
In-Vivo CEST MRI to assess and identify myocardial infarction by using natural D- glucose as a contrast agent1Translational Research Imaging Center, Clinic of Radiology, University of Münster, Münster, Germany, 2Heart Center Bonn, Department of Internal Medicine II, University Hospital Bonn, Bonn, Germany, 3European Institute for Molecular Imaging, University of Münster, Münster, Germany, 4Clinic and Polyclinic for Radiology, University Hospital of München, München, Germany
Synopsis
Keywords: Myocardium, CEST & MT
The current preclinical study aimed to explore the application of natural D-glucose as an infusible biodegradable MRI contrast agent for imaging of myocardial infarction (MI) by glucose weighted CEST MRI (glucoCEST). To this end, in a mouse model of MI, the infarct region was first identified and verified by late gadolinium enhancement MRI and histology, respectively. In-Vivo glucoCEST MTRasym maps showed substantial differences before and after glucose infusion according to the myocardial viability. Statistical analysis verified that glucoCEST contrast could distinguish significantly between MI region, remote myocardium as well as healthy myocardium.INTRODUCTION
Cardiac diseases such as myocardial infarction (MI) are one of the leading causes of death in the industrialized world, and continuous development of non-invasive imaging methods is urgently needed to improve diagnosis and especially prognosis1. However, modern imaging technologies such as CT, PET, SPECT and MRI frequently require chemical contrast agents to visualize the structural and morphological changes2. Within this frame the paramagnetic lanthanide agent Eu-HPDO3A was recently proposed to identify cardiac fibrosis by using Chemical Exchange Saturation Transfer (CEST) MRI3. Still, chemical labels may have side effects or toxic and ionizing radiation properties.Thus, the goal of this study was to explore the application of natural D-glucose as an infusible biodegradable MRI contrast agent for imaging of MI by glucose weighted CEST MRI (glucoCEST). In our in-vivo study glucoCEST MTRasym maps of the myocardium were calculated before and after glucose infusion in both healthy animals and animals with MI.
METHOD
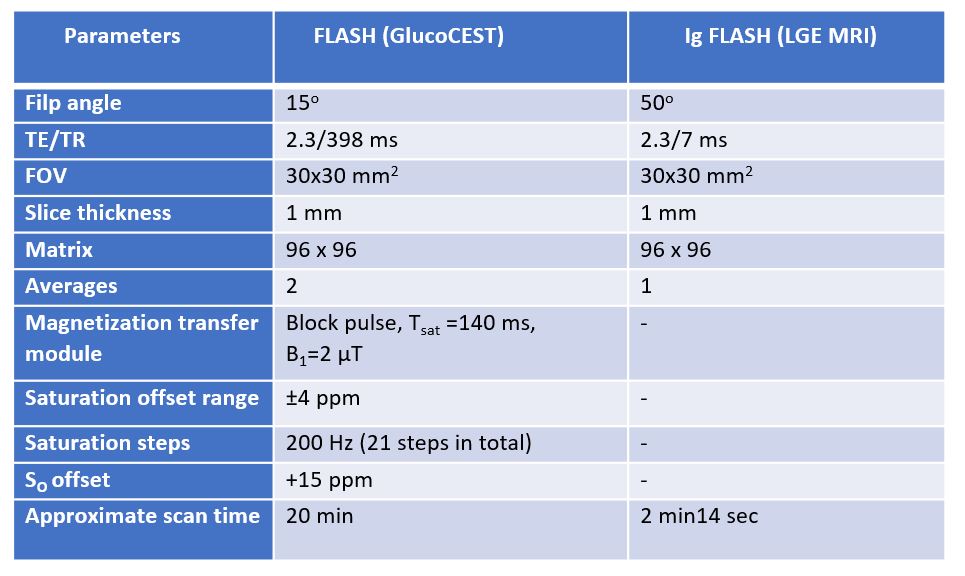
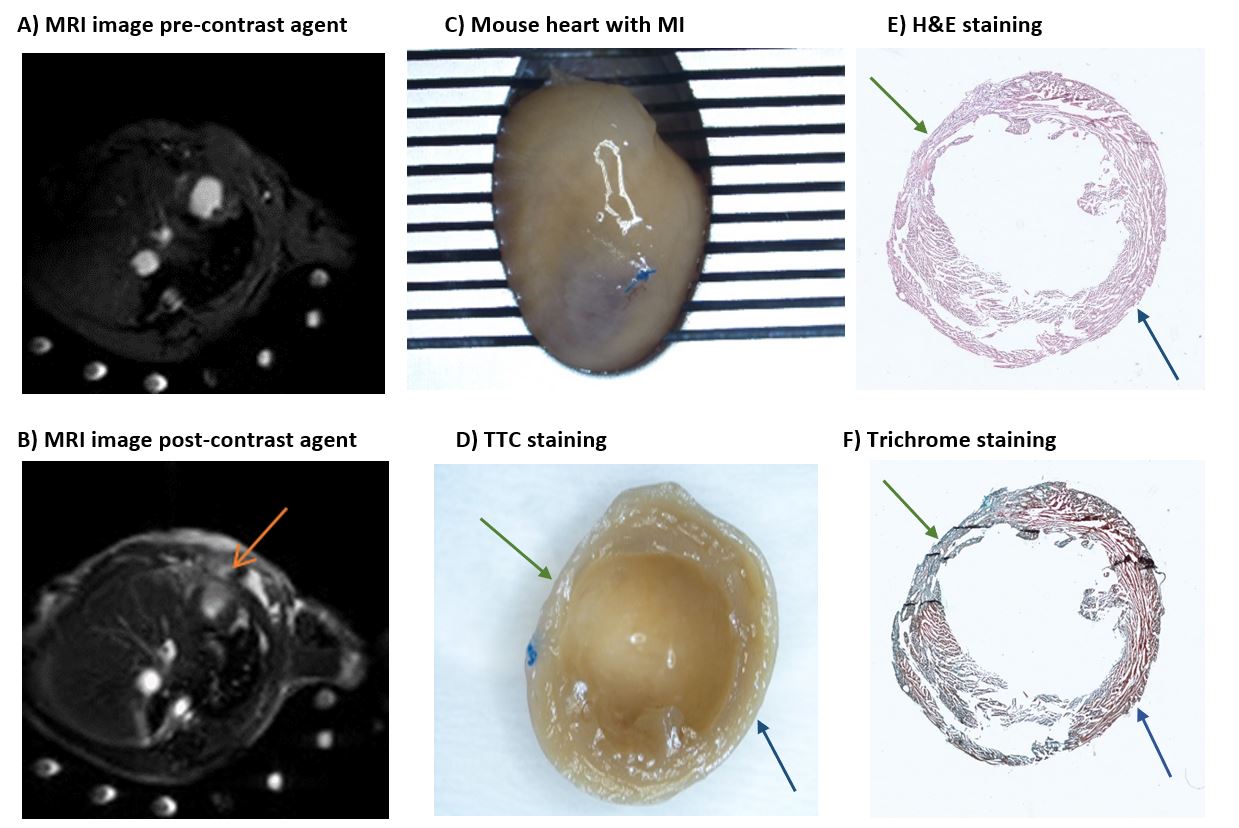
Animal study: Two groups of C57BL/6 male mice at the age of 8 weeks were included in the study: Healthy animals (n=9) and animals with MI (n=5). Induction of MI was performed by left thoracotomy and permanent ligation of the left coronary artery4. All MI-induced animals were under daily observation and underwent MRI scanning on day 7 post surgery. Directly after MRI, the animals were sacrificed and histological analysis was performed by using TTC (triphenyl tetrazolium chloride), H&E (hematoxylin and eosin) as well as Masson-Goldner trichrome staining5.In-vivo MRI: MRI was performed using a 9.4 T Bruker BioSpec 94/20 system (Ettlingen, Germany) equipped with a 1 T/m gradient system and ParaVision 6.0.1 operating software. A 35-mm volume resonator coil was used for data acquisition. During MRI, the animals were anesthetized with isoflurane (1.5% - 2.5% isoflurane and 0.7/0.3 air/O2 mixture), and core body temperature and respiration rates were monitored. In CEST experiments, localized manual shimming was performed and an axial slice was acquired by using a modified cardiac and respiratory triggered FLASH sequence (Figure 1) covering both infarcted and remote tissue. For LGE MRI an IntraGate-FLASH sequence was used and T1 weighted images acquired (Figure 1).
Infusion protocols: Right before the start of glucoCEST MRI, animals received a bolus i.p. injection (100 µl) of a 1.0 M glucose/PBS solution followed by a second bolus i.p. injection (100 µl) of a 1.5 M glucose/PBS solution after 25 min. For LGE MRI animals received a bolus i.v. injection of 0.1 mM Gadovist right before image acquisition.
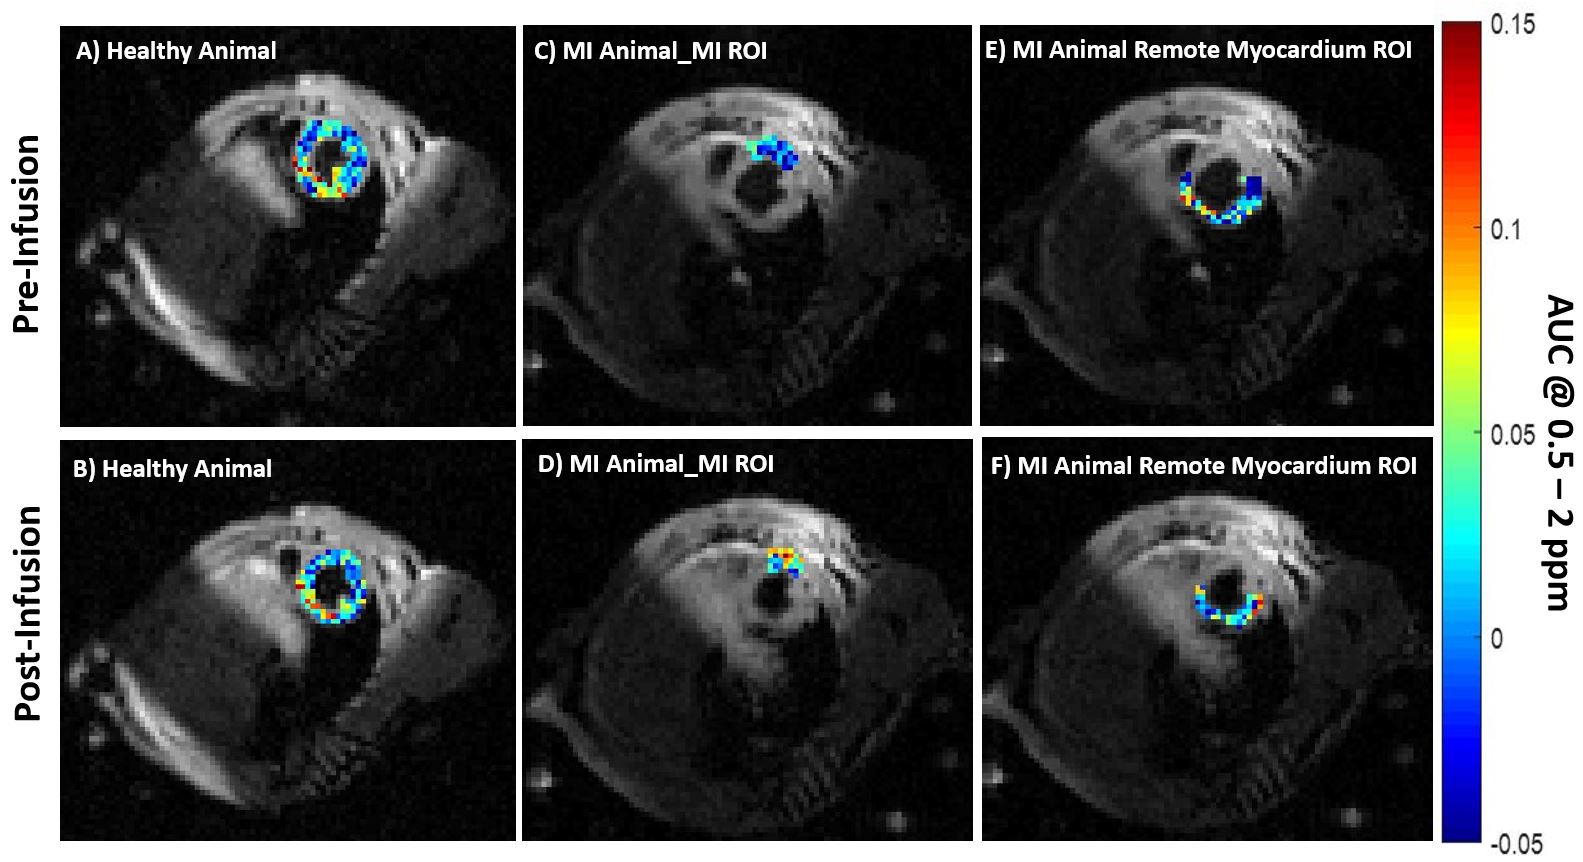
MRI data analysis: For each voxel, a z-spectrum was first plotted, smoothened and corrected for B0 inhomogeneities. Subsequently, the magnetization transfer ratio (MTRasym) was calculated and glucoCEST MTRasym contrast was quantified by integration over the offset range from 0.5 to 2.0 ppm and was averaged for each ROI. ROIs of healthy myocardium (healthy animals) and of MI region and remote myocardium (animals with MI) were analysed using Mann Whitney U-test.
RESULTS
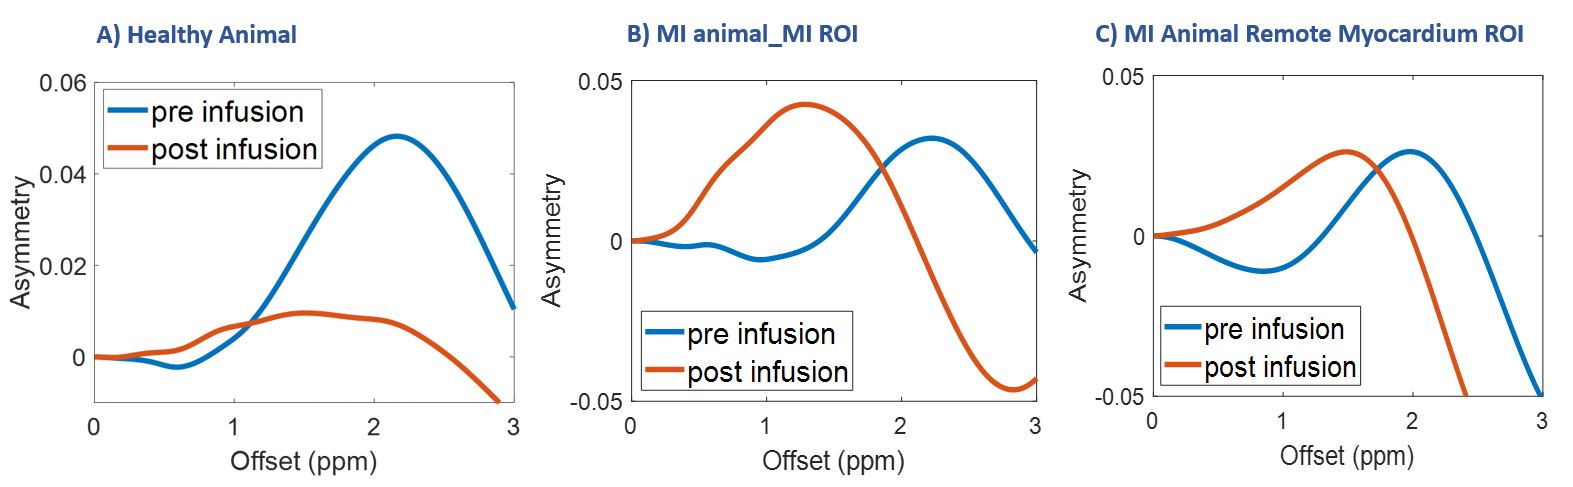
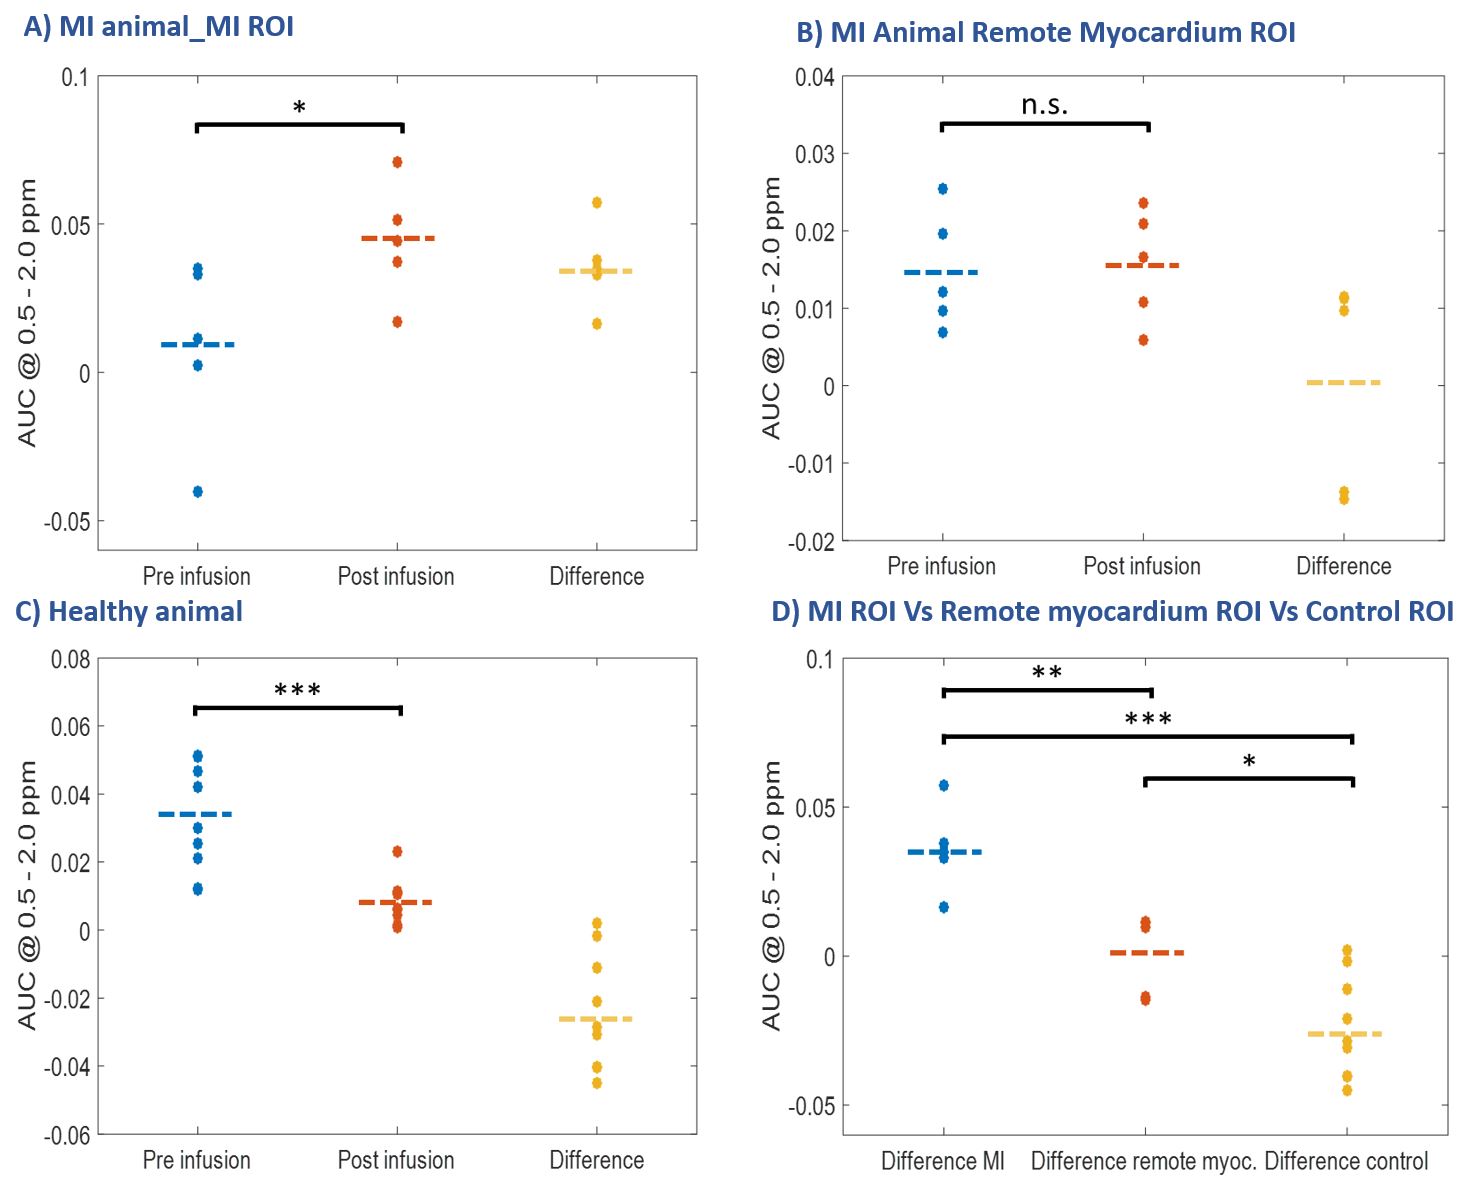
In animals with MI the infarct region was identified by increased signal intensity in LGE MRI (Fig. 2A, B). The results were confirmed both by macroscopic investigations (Fig. 2C, D) as well as by microscopic assessment (Fig. 2E, F).In healthy animals and animals with MI pixelwise calculated glucoCEST MTRasym maps of the heart showed substantial differences in the three different ROIs of the myocardium before and after glucose infusion: healthy myocardium (healthy animals), MI region and remote myocardium (MI animals) (Fig. 3A-F). GlucoCEST MTRasym spectra (Fig. 4) were calculated and assessed for each region separately. While after glucose infusion reduced MTRasym spectra were observed in the myocardium of healthy animals (Fig. 4A), the MTRasym values strongly increased in the region of MI (Fig. 4B). In contrast the CEST results in the remote myocardium of infarcted animals were inconspicuous (Fig. 4C). By statistical analysis it could be shown that all three different ROIs (MI, remote myocardium and healthy myocardium) could be distinguished according to the difference in glucoCEST contrast before and after glucose infusion (Fig. 5D).
DISCUSSION
While in 18F-FDG-PET experiments reduced signal, - intensities are observed in infarct areas compared to the remote myocardium6; glucoCEST contrast was significantly increased in the region of MI after glucose infusion in our study. In contrast to 18F-FDG-PET, the observed glucoCEST contrast is mainly derived from unmodified glucose, leading to an accumulation of glucose during glucose infusion in the tissue of reduced and altered glucose utilization such as MI region or to a lesser extent in remote myocardium.Besides the metabolic activity, glucoCEST contrast also reflects perfusion-related properties such as blood volume, vascular leakage, and extracellular space7. Therefore, its mechanistic mode of action is expected to be more similar to that of gadolinium-based enhancement than to 18F-FDG-PET. Thus, the observed altered glucoCEST contrast in the MI region and remote myocardium likely reflects a combination of glucose utilization, circulatory function with glucose washout, as well as molecular alterations such as pH, ionic strength and microenvironment affecting the chemical exchange of glucose8.
CONCLUSION
By glucoCEST MRI and the use of D-glucose as a biodegradable contrast agent, infarct regions can be distinguished clearly from remote myocardium in animals with MI. In addition, the remote myocardium also differs notably from the normal myocardium of healthy control animals.Acknowledgements
This work was supported by the Deutsche Forschungsgemeinschaft (German Research Foundation, Project-IDs 406818964 and 249895739).References
1) Li, H., Abaei, A., Metze, P., Just, S., Lu, Q., & Rasche, V. (2020). Technical Aspects of in vivo Small Animal CMR Imaging. Frontiers in Physics, 8(June), 1–26. https://doi.org/10.3389/fphy.2020.00183
2) Danad I, Raijmakers PG, Driessen RS, Leipsic J, Raju R, Naoum C, Knuuti J, Mäki M, Underwood RS, Min JK, Elmore K, Stuijfzand WJ, van Royen N, Tulevski II, Somsen AG, Huisman MC, van Lingen AA, Heymans MW, van de Ven PM, van Kuijk C, Lammertsma AA, van Rossum AC, Knaapen P. Comparison of Coronary CT Angiography, SPECT, PET, and Hybrid Imaging for Diagnosis of Ischemic Heart Disease Determined by Fractional Flow Reserve. JAMA Cardiol. 2017 Oct 1;2(10):1100-1107. doi: 10.1001/jamacardio.2017.2471. PMID: 28813561; PMCID: PMC5710451.
3) Vandsburger, M., Vandoorne, K., Oren, R., Leftin, A., Mpofu, S., Castelli, D. D., Aime, S., & Neeman, M. (2014). Cardio-chemical exchange saturation transfer magnetic resonance imaging reveals molecular signatures of endogenous fibrosis and exogenous contrast media. Circulation: Cardiovascular Imaging, 8(1), 1–8. https://doi.org/10.1161/CIRCIMAGING.114.002180
4) Kuhlmann, M. T., Kirchhof, P., Klocke, R., Hasib, L., Stypmann, J., Fabritz, L., Stelljes, M., Tian, W., Zwiener, M., Mueller, M., Kienast, J., Breithardt, G., & Nikol, S. (2006). G-CSF/SCF reduces inducible arrhythmias in the infarcted heart potentially via increased connexin43 expression and arteriogenesis. Journal of Experimental Medicine, 203(1), 87–97. https://doi.org/10.1084/jem.20051151
5) Protti, A., Lavin, B., Dong, X., Lorrio, S., Robinson, S., Onthank, D., Shah, A. M., & Botnar, R. M. (2015). Assessment of Myocardial Remodeling Using an Elastin/Tropoelastin Specific Agent with High Field Magnetic Resonance Imaging (MRI). Journal of the American Heart Association, 4(8), e001851. https://doi.org/10.1161/JAHA.115.001851
6) Vasudevan, P., Gäbel, R., Stenzel, J., Förster, J., Kurth, J., Vollmar, B., Krause, B. J., Ince, H., David, R., & Lang, C. I. (2020). 18F-FDG PET-based imaging of myocardial inflammation following acute myocardial infarction in a mouse model. International Journal of Molecular Sciences, 21(9). https://doi.org/10.3390/ijms21093340
7) Masoud, W. G. T., Ussher, J. R., Wang, W., Jaswal, J. S., Wagg, C. S., Dyck, J. R., Lygate, C. A., Neubauer, S., Clanachan, A. S., & Lopaschuk, G. D. (2014). Failing mouse hearts utilize energy inefficiently and benefit from improved coupling of glycolysis and glucose oxidation. Cardiovascular Research, 101(1), 30–38. https://doi.org/10.1093/cvr/cvt216
8) Tran, D. H., & Wang, Z. V. (2019). Glucose Metabolism in Cardiac Hypertrophy and Heart Failure. Journal of the American Heart Association, 8(12), 1–18. https://doi.org/10.1161/JAHA.119.012673 2)
Figures