0169
Cardiac adipose tissue proton-density fat fraction quantification by free-running cardiac Dixon at 3T1Aix-Marseille Univ, CNRS, CRMBM, Marseille, France, 2APHM, Hôpital Universitaire Timone, CEMEREM, Marseille, France, 3Siemens Healthcare SAS, Saint-Denis, France, 4Department of Diagnostic and Interventional Radiology, Lausanne University Hospital, Lausanne, Switzerland, 5Department of Diagnostic, Interventional and Pediatric Radiology (DIPR), Inselspital, Bern University Hospital, University of Bern, Bern, Switzerland, 6Translation Imaging Center (TIC), Swiss Institute for Tranlational and Entrepreneurial Medicine, Bern, Switzerland, 7Advanced Clinical Imaging Technology, Siemens Healthineers International AG, Lausanne, Switzerland, 8Center for Biomedical Imaging, Lausanne, Switzerland, 9Siemens Healthcare, MR Application Development, Erlangen, Germany
Synopsis
Keywords: Fat, Quantitative Imaging
Free-running cardiac Dixon-MRI has the potential for motion-resolved R2* and PDFF quantification to explore cardiac fat accumulation and alteration in metabolic diseases. This study combines a self-navigated 3D radial sequence with 13 echoes using fast bipolar signal-readouts, a k-space trajectory correction, a compressed sensing reconstruction, and IDEAL fat-water separation to obtain precise ( limits of agreement: ±1.2 % and 5.0 s-1) and highly spatially and motion-resolved quantitative PDFF and R2* maps of the whole heart. We report here the first in vivo characterization of metabolically-active epicardial fat (PDFF: 81.6±9.6 %), distinct from adjacent paracardial fat.Introduction
There is a growing interest to better understand the pathophysiological role of cardiac fat towards cardiovascular degradation in metabolic diseases1. As epicardial adipose tissue(EAT) can become an inflammatory substrate under pathological conditions, emerging therapies are aiming at modulating its metabolic functions2. However, there is a lack of non-invasive tools that can probe EAT, which is thin and moves with cardiac and respiratory motion. Dixon-MRI enables high resolution mapping of proton density fat-fraction (PDFF) and R2*, two non-invasive biomarkers3 that hold potential to differentiate the metabolic status of EAT4. Nevertheless, cardiac Dixon-MRI remains challenging due to the concomitant need for high spatial and temporal (rapid water/fat phase accrual) resolution and robust motion compensation. To overcome those hurdles, the free-running framework5 is a promising approach that enables high spatial-resolution cardiac imaging with fully respiratory and cardiac self-gating, combined with a multidimensional compressed sensing reconstruction. Using the full potential of a custom-built free-running multi-echo sequence and a dedicated Dixon framework6, cardiac adipose tissue was investigated in healthy population and two diabetic patients.Methods
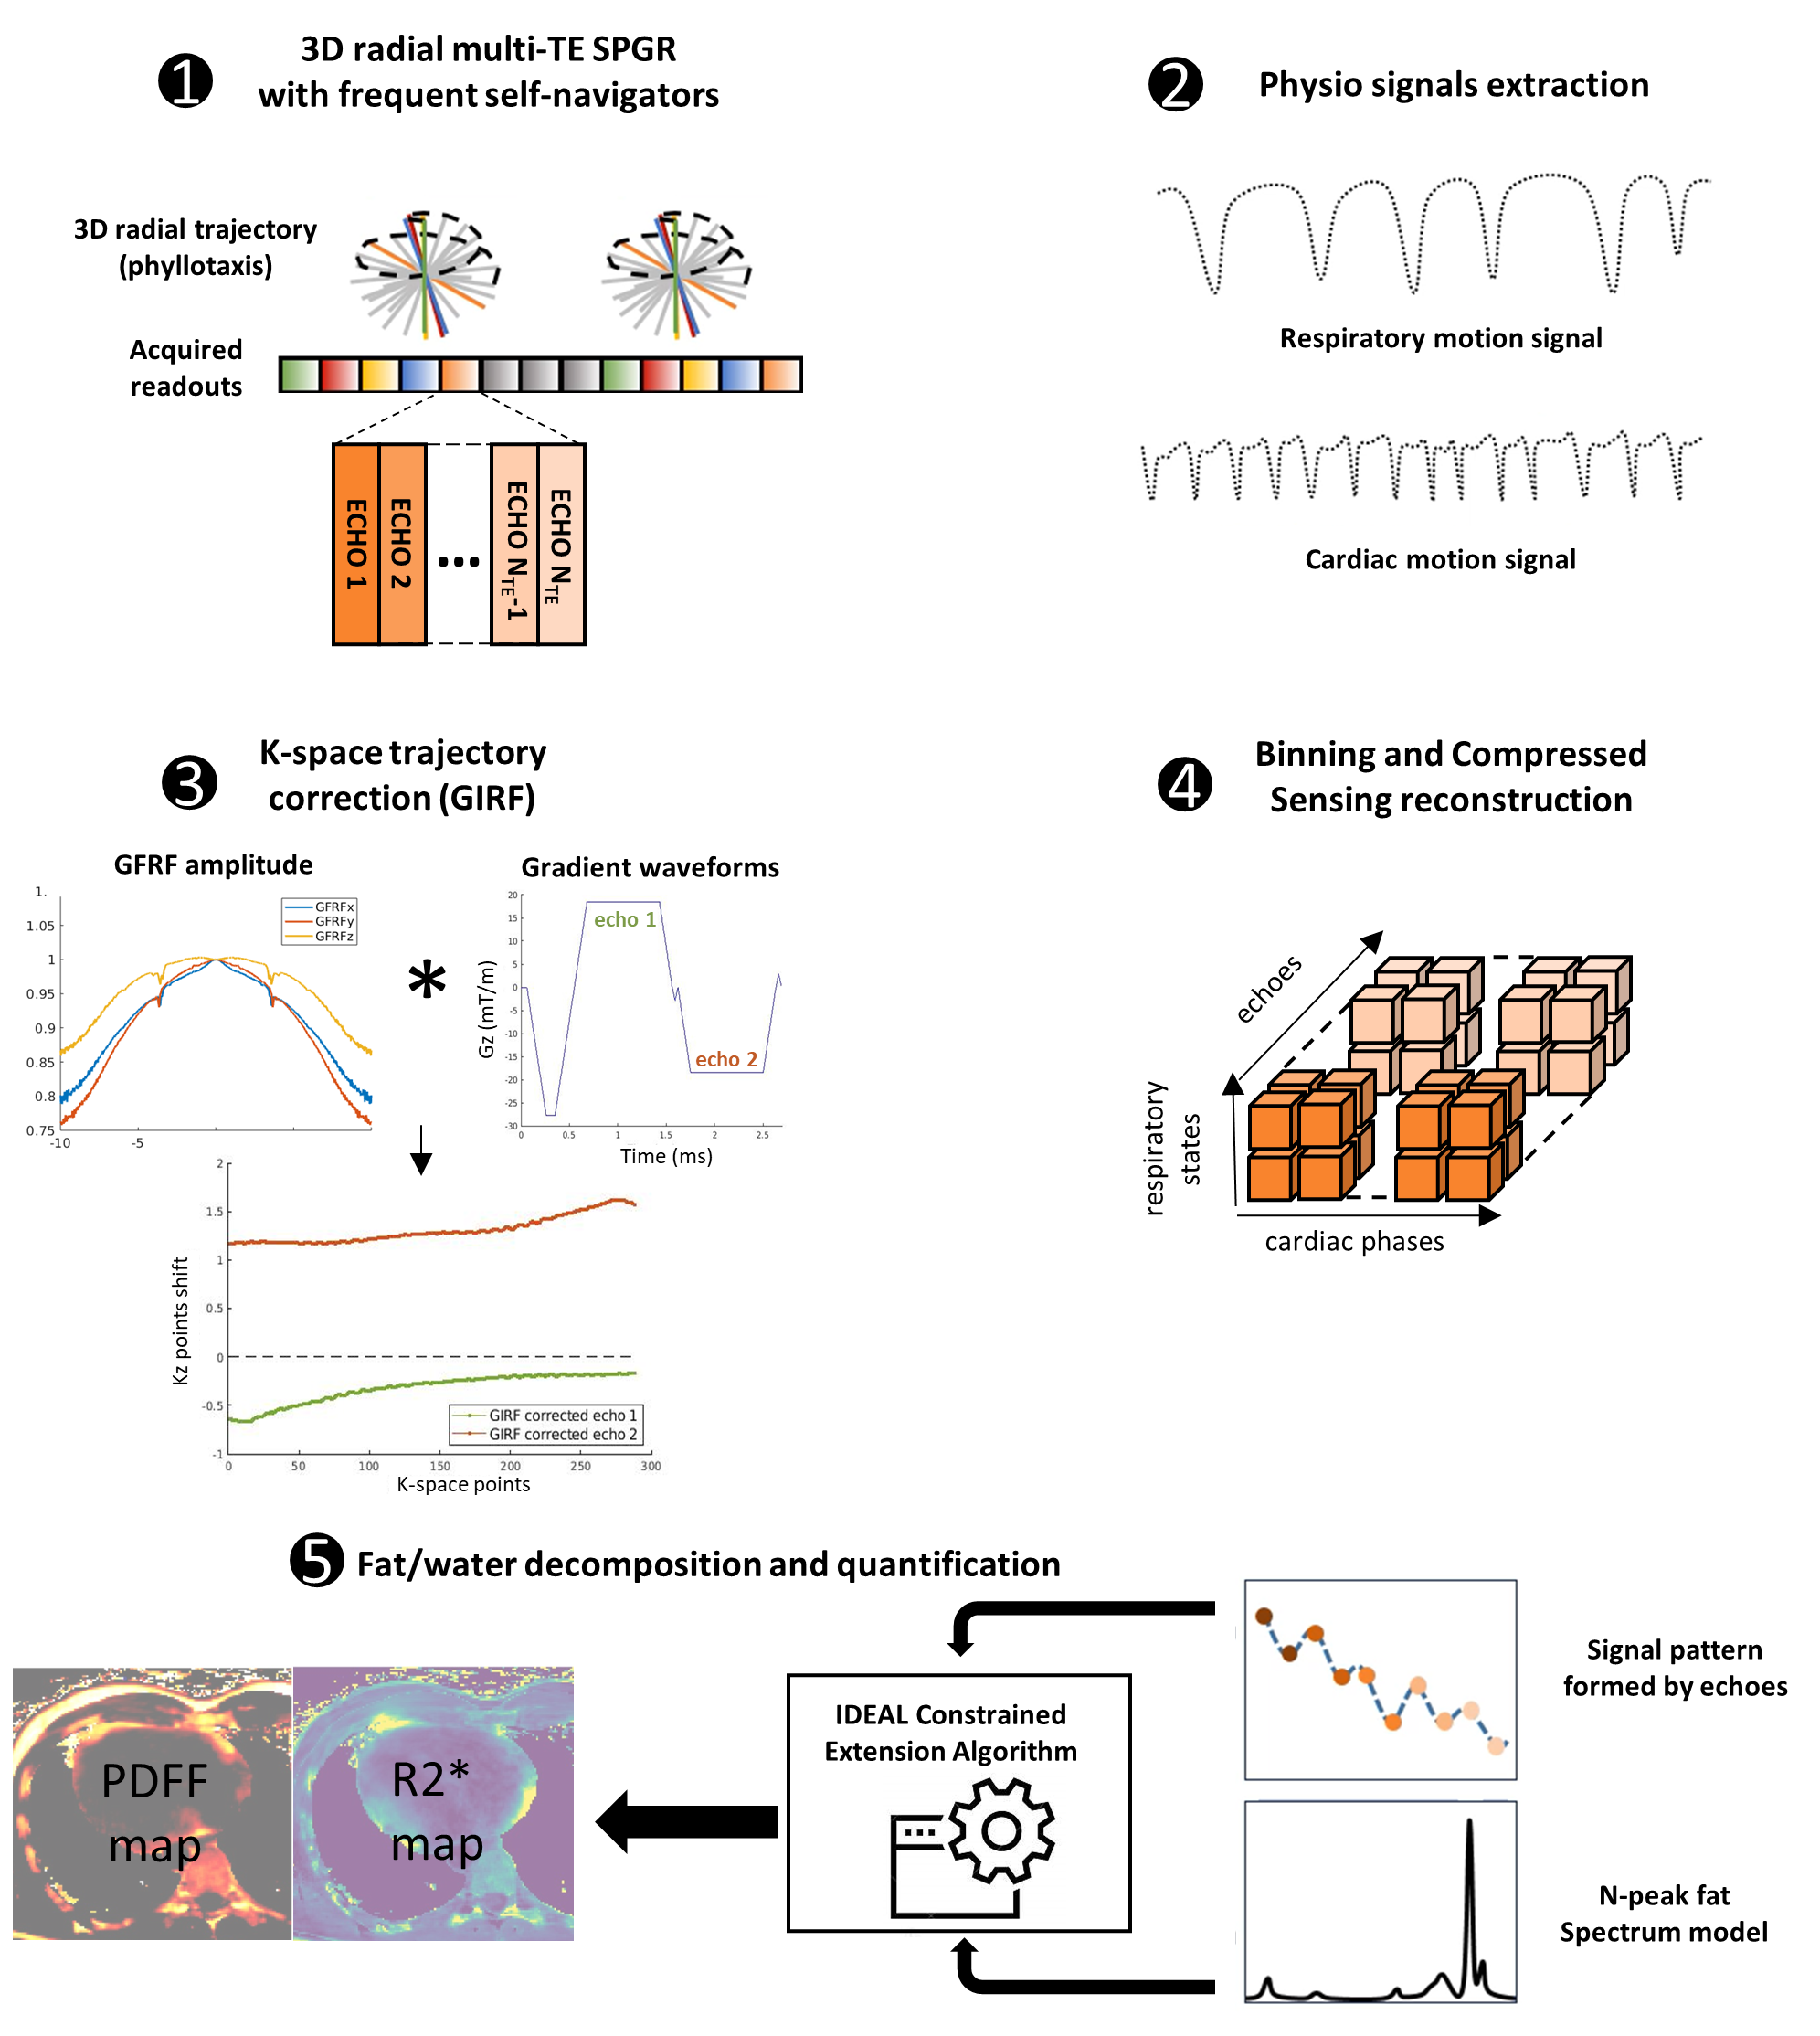
A research 3D radial spoiled gradient echo sequence was implemented with multiple echoes and a phyllotaxis trajectory for integration with the free-running framework5(Fig1). Data were acquired on a 3T scanner (MAGNETOM Vida, Siemens Healthcare, Erlangen, Germany).A ten minute acquisition, with a TR of 15ms and 13 echoes (TE1/ΔTE=1.12/1.07ms) using fast bipolar readouts and 40014 radial views per echo segmented in 3078 segments of 13 lines each was acquired with FOV=(220mm)3 at isotropic 1.5mm resolution with FA=5° and BW=1510 Hz/px.
To compensate for gradients imperfections and delays (which get worse with bipolar readouts), a k-space trajectory correction was applied using the system-specific Gradient system Impulse Response Function (GIRF)7,8. Cardiac and respiratory motion gating signals were extracted from the first echo of the superior-inferior projections. The 6D k-space data (R=26x acceleration) were binned in 4 respiratory phases and 100ms-wide cardiac phases and then were reconstructed using the free-running compressed sensing framework(5).
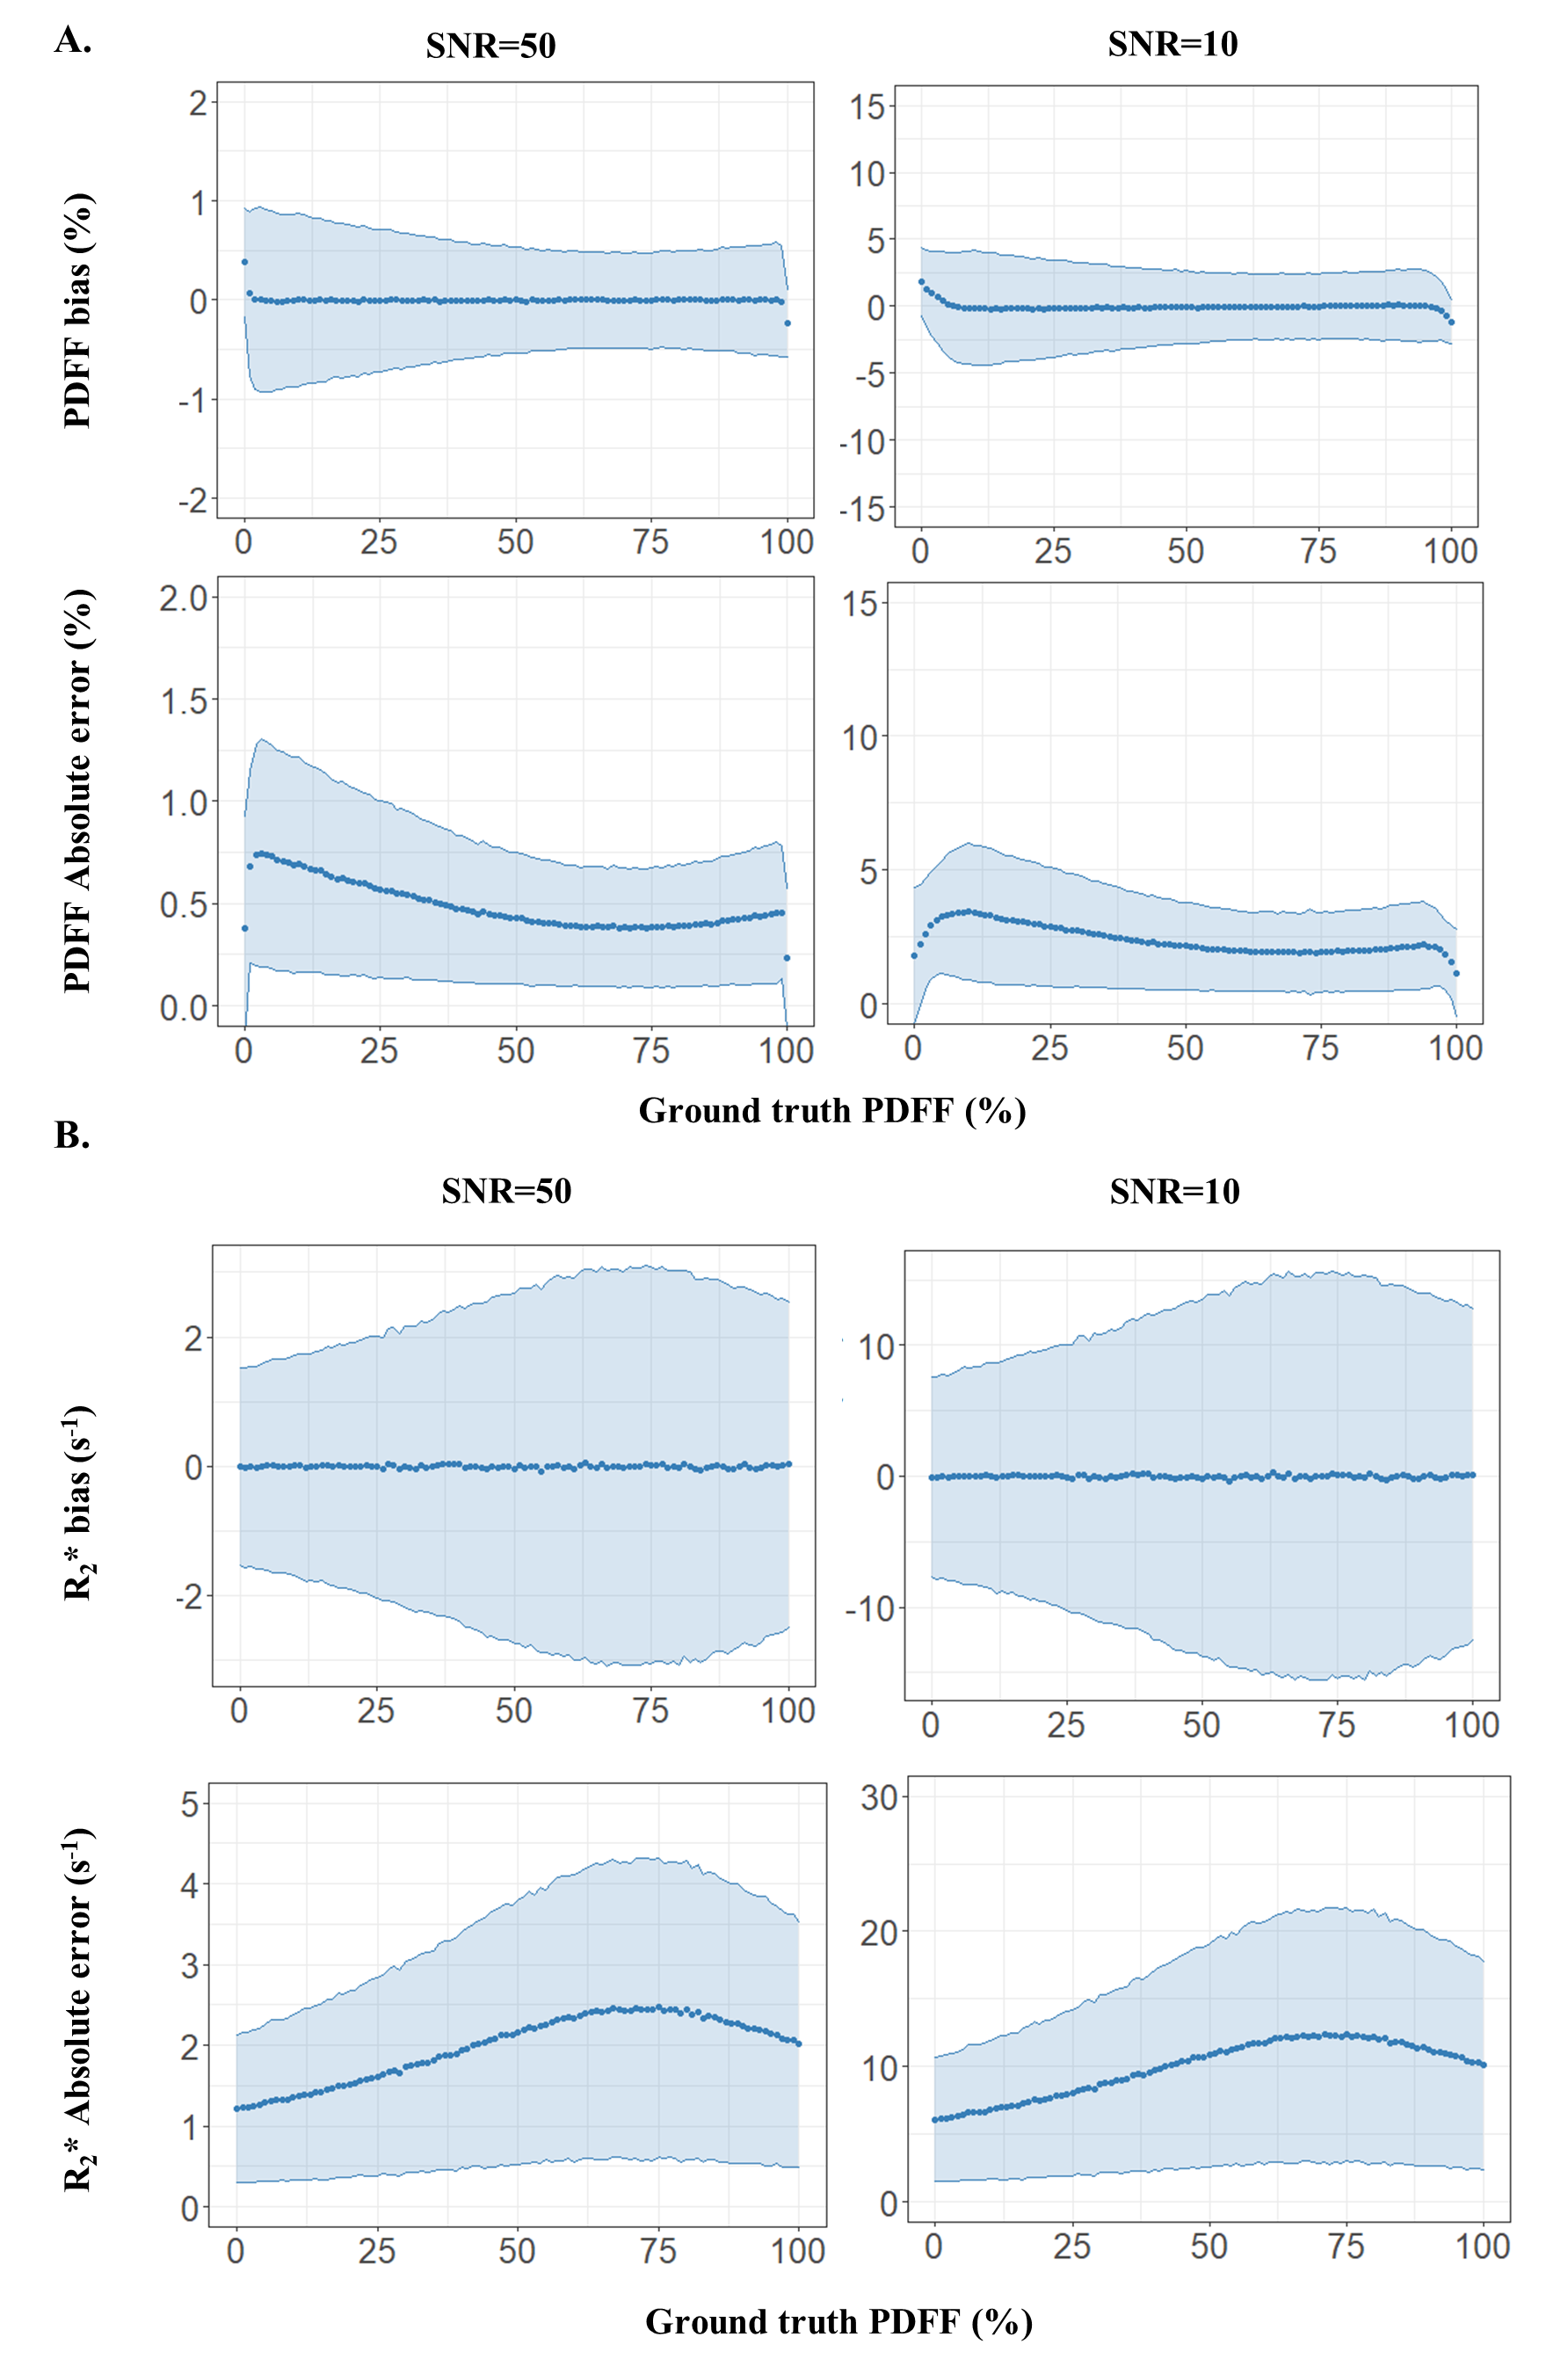
Complex images were processed for fat-water separation using the Iterative Decomposition of water and fat with Echo Asymmetry and Least square Estimation (IDEAL) method with constrained extension9,10. Precision of the quantitative parameters (PDFF, R2*). was evaluated numerically by simulated synthetic Dixon-MRI (TE1/ΔTE=1.12/1.07ms, NTE=13) with the full range of PDFF(0:1:100) and a large range of B0 off-resonance(-200:4:200 Hz) at SNR=10, 50. Cardiac adipose tissue (epicardial and paracardial fat (PAT)) and subcutaneous fat(SAT) were segmented at the apex and the abdomen respectively at TE1 along the fully respiration and cardiac cycle and explored on 11 healthy subjects (38±14 y.o. ; BMI: 23.0±1.6 kg/m2 ; 2 women) and two diabetic patients (63±3 y.o. ; BMI: 28.3±13.8 kg/m2 ; 2 women).
Results
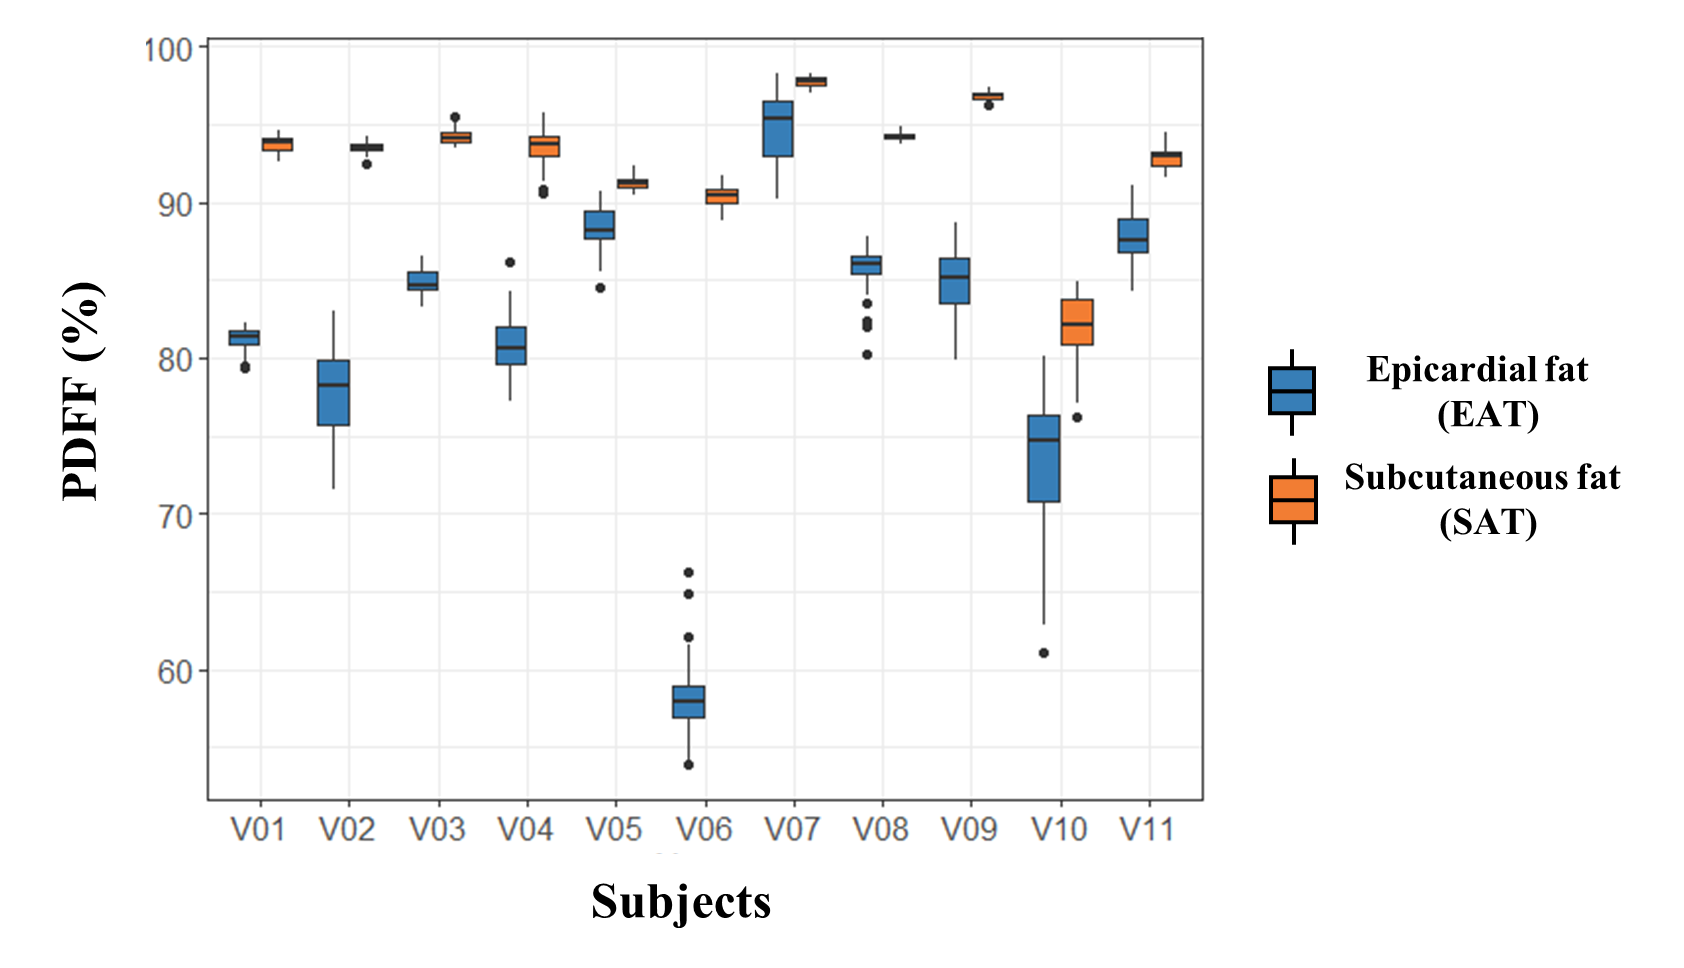
Numerical simulations demonstrated that PDFF and R2* quantification with a SNR=50 were accurate with a mean PDFF and R2* bias less than 0.05% and 0.05 s-1 respectively and precise with limits of agreement of ±1.2 % and 5.0 s-1 (Fig2). B0 maps confirmed a range within ±200 Hz in the heart.In the healthy population, epicardial fat had a significantly lower fat fraction than the subcutaneous fat (PDFF EAT=81.6±9.6% vs PDFF SAT=92.7±4.2%, P<0.001)(Fig3). Although only present in three healthy volunteers and the diabetic patients, paracardial fat PDFF (90.6±3.7%) tended to be superior to EAT PDFF.
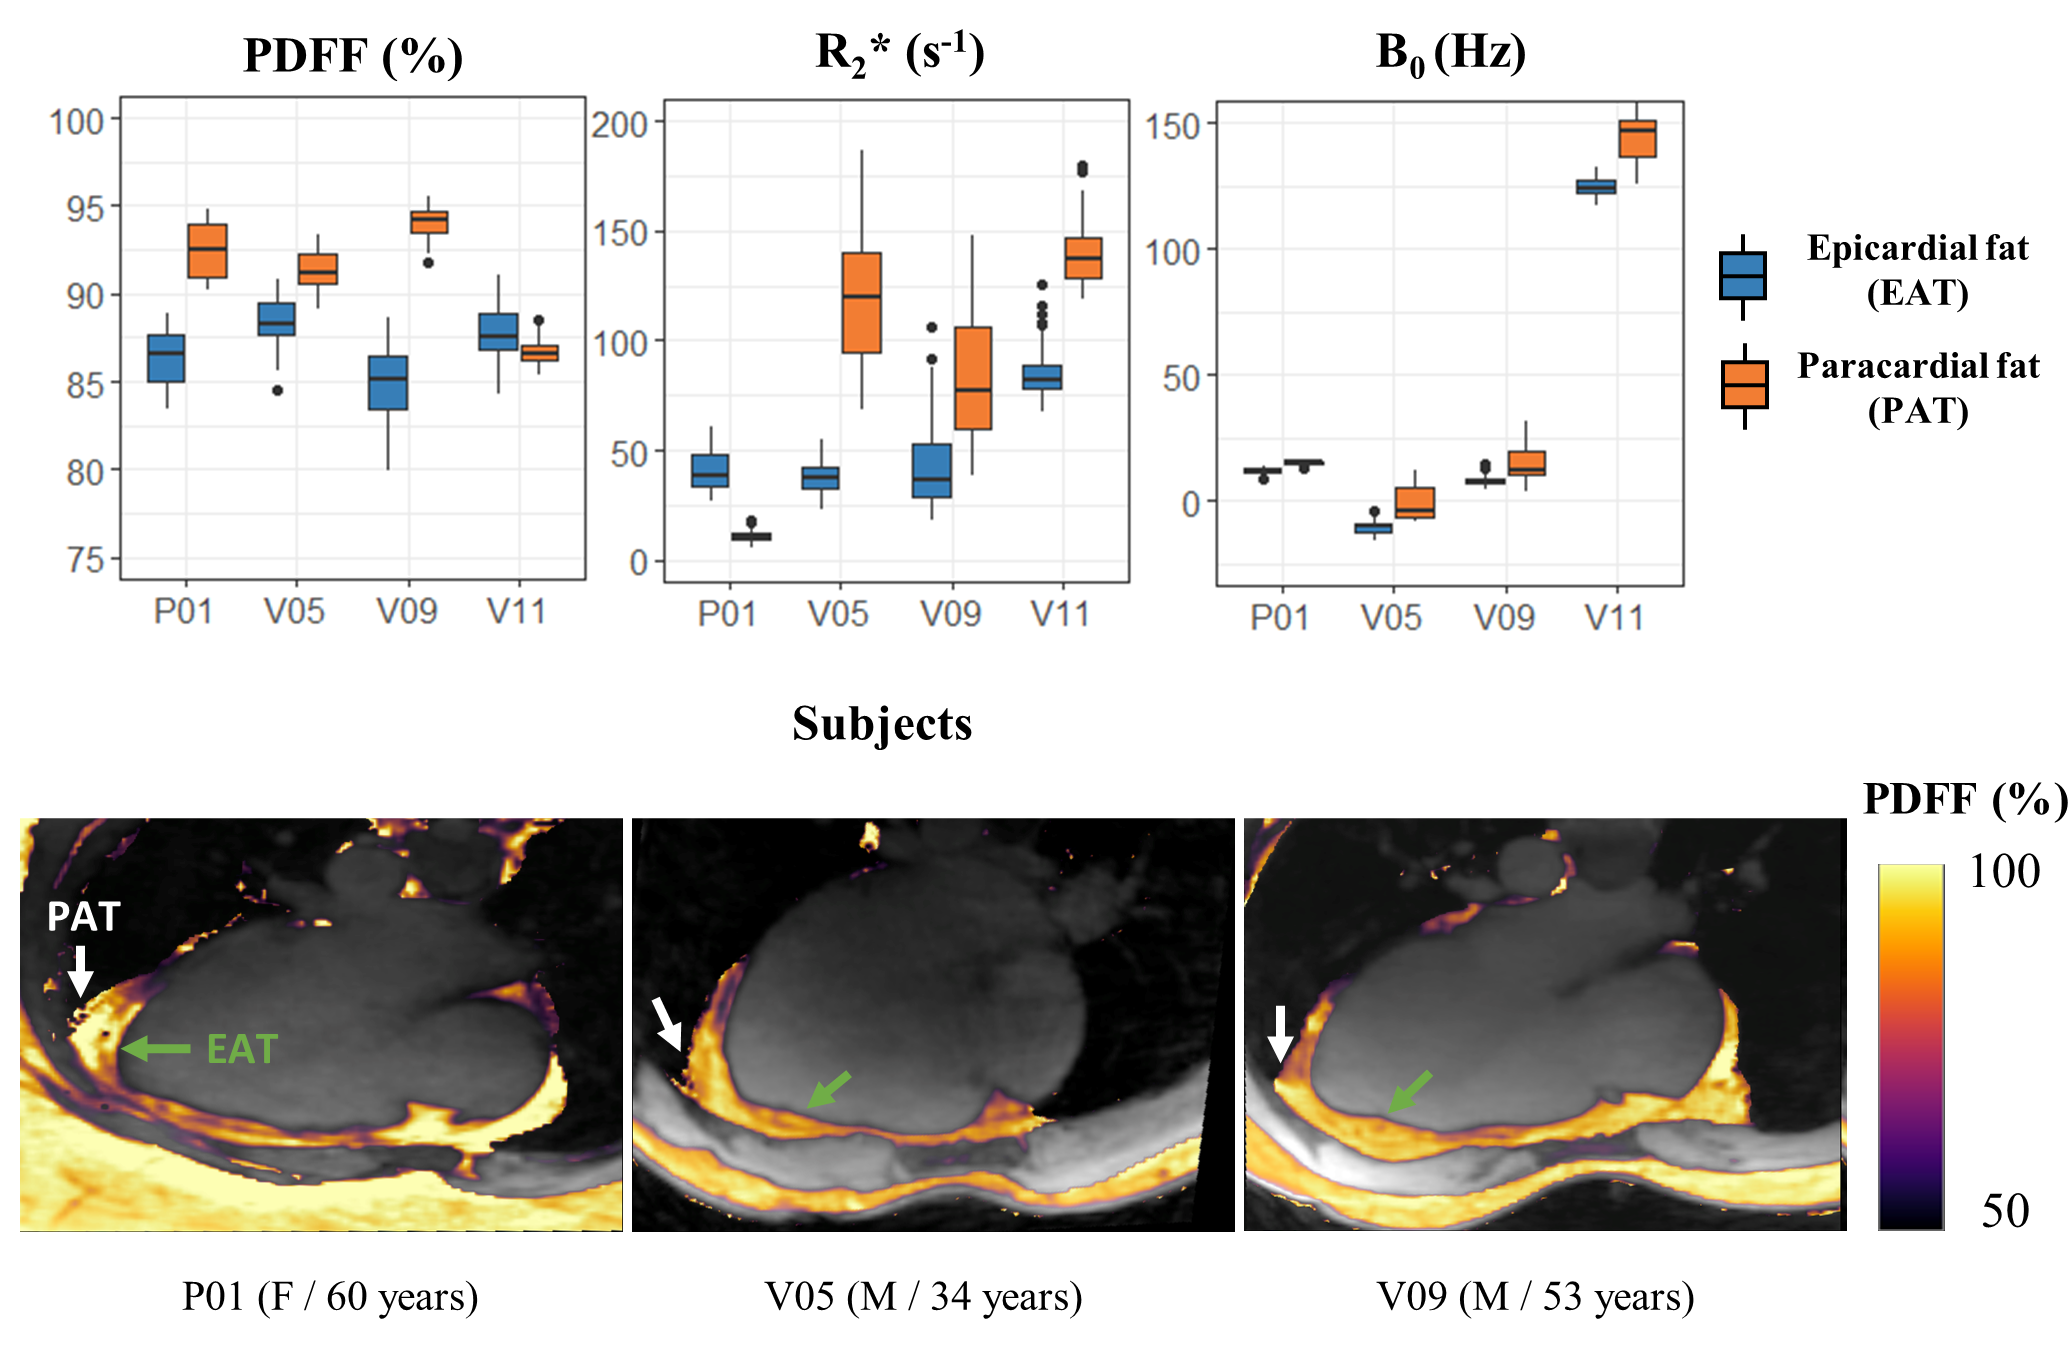
The preliminary results in the type-2 diabetic patients suggested that EAT fat fraction was also lower (86.4±5.0%) compared to either subcutaneous fat (96.3±3.1%) or paracardial fat (92.5±2.9%) (Fig4).
Discussion
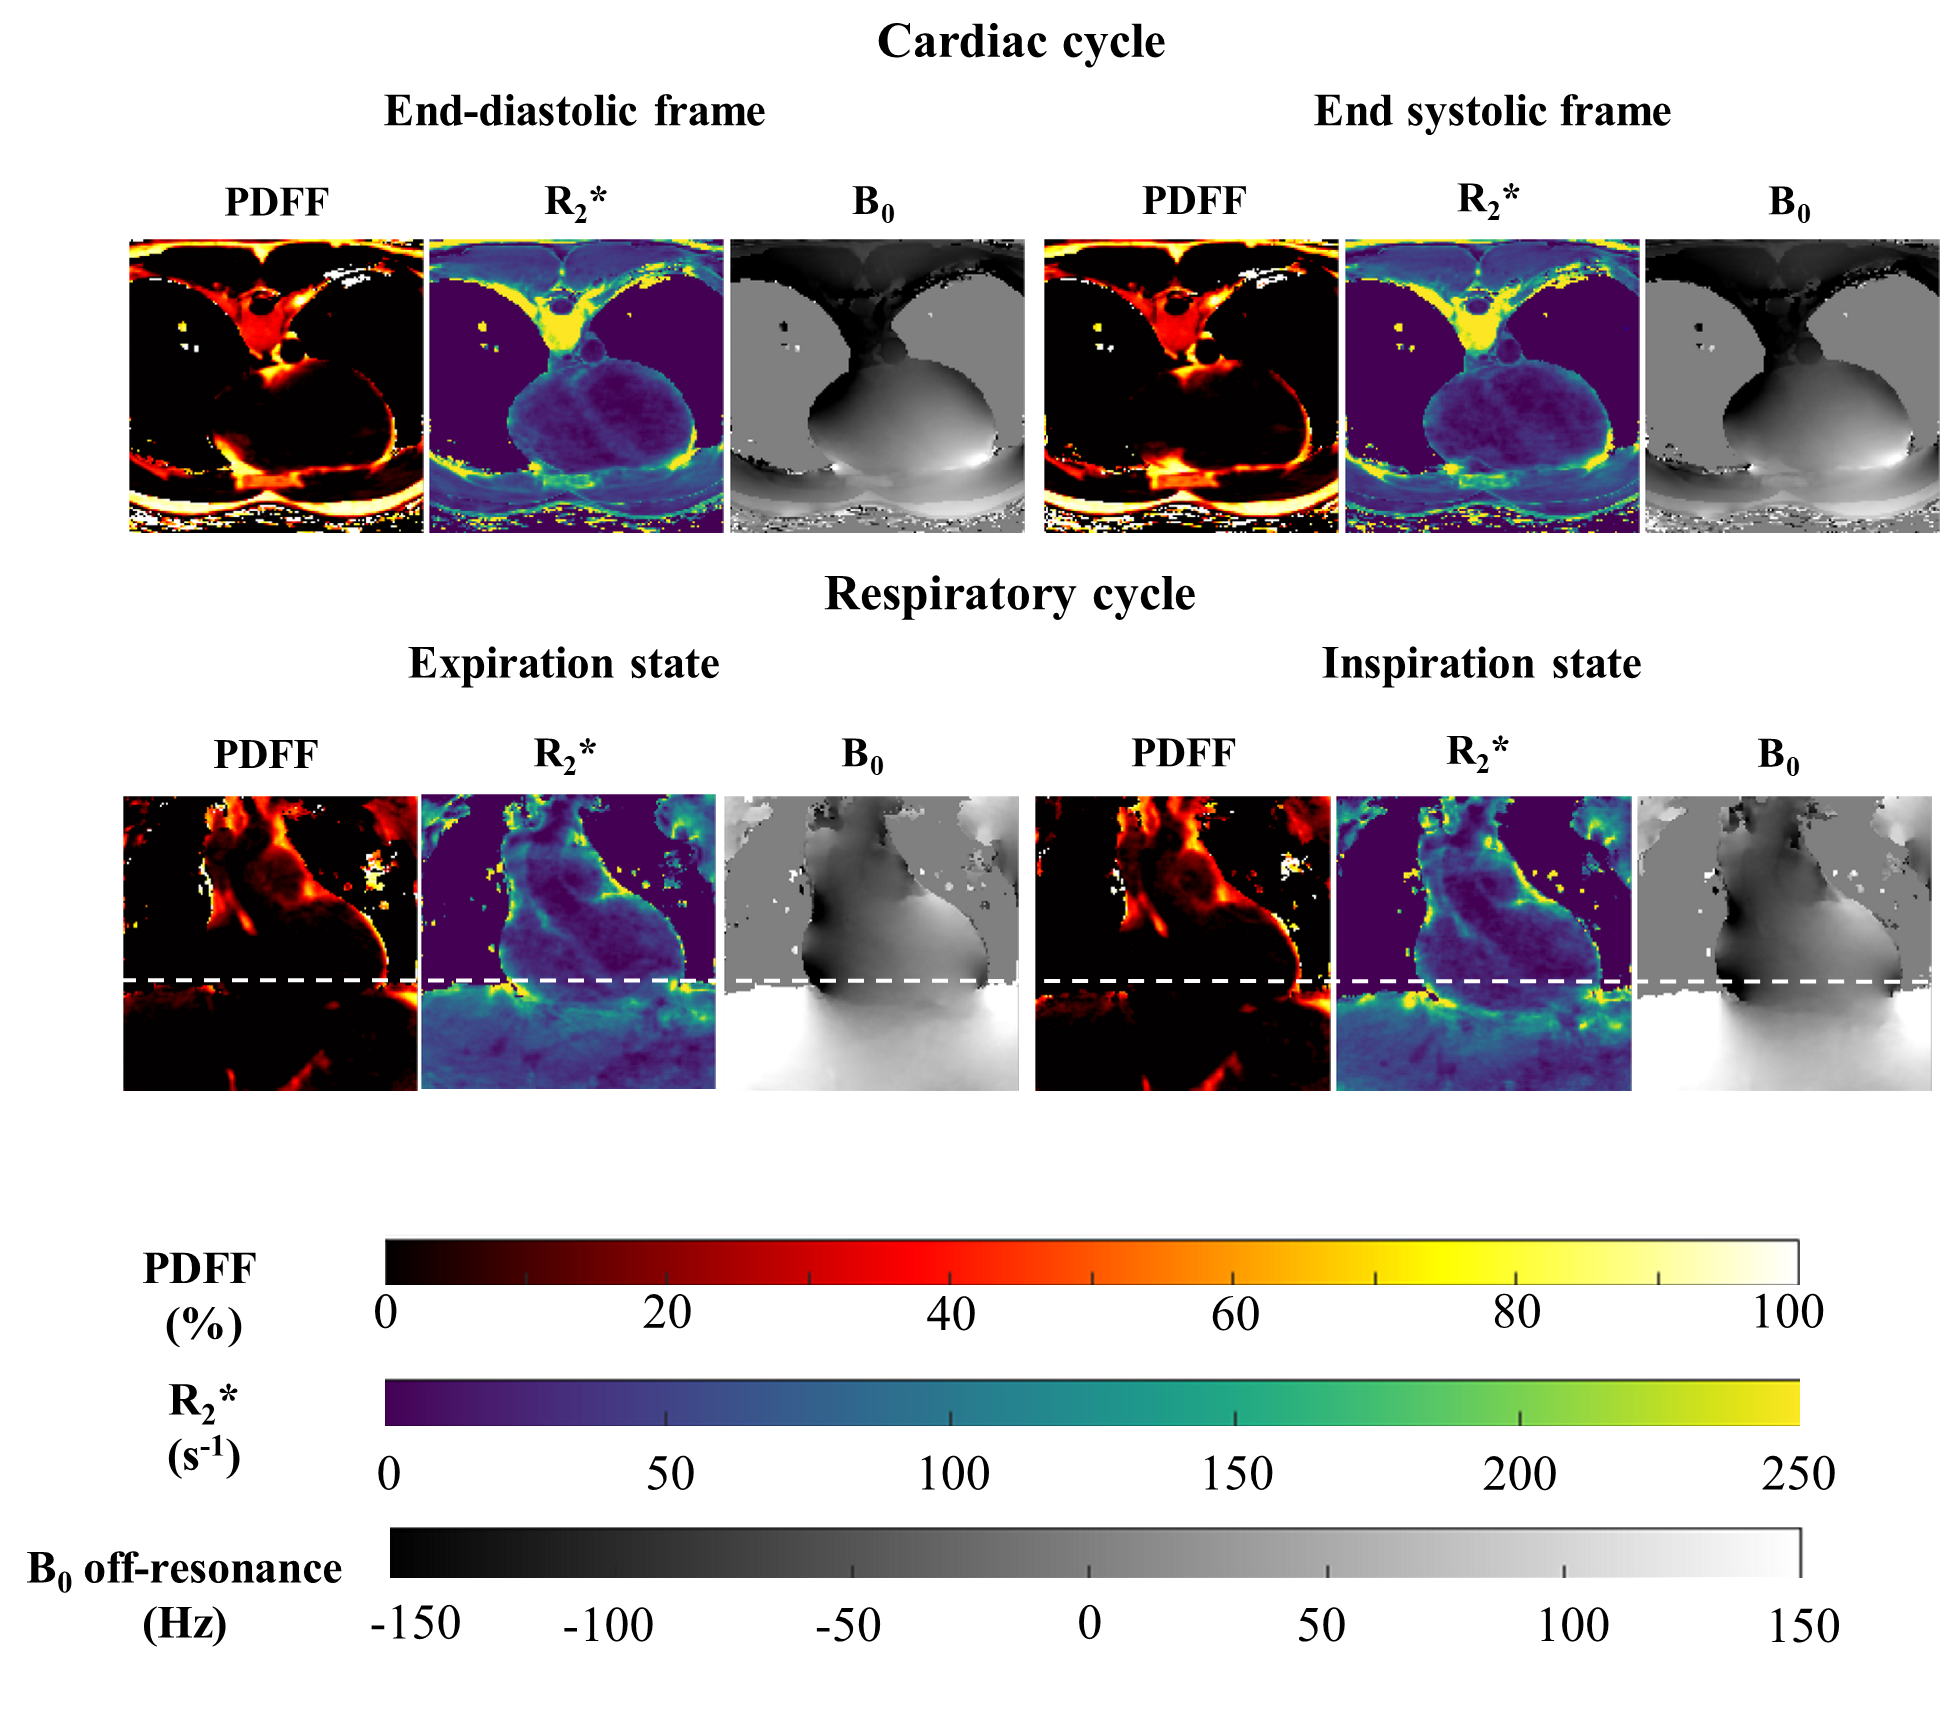
Aiming for a precise high-resolution quantitative imaging of cardiac adipose tissue, a 10 minute free-running cardiac Dixon acquisition provided whole organ coverage with a 1.5 mm isotropic resolution. The method could separate PDFF values between epicardial fat and other surrounding fats.Preliminary results suggested a PDFF difference between EAT and other adipose tissues (SAT and PAT when present) within the order of 5 to 10%. To properly distinguish and probe EAT, the need for a precise mapping technique becomes apparent. From numerical simulations and in vivo results, proposed free-running cardiac Dixon acquisition showed to fit this need. Moreover, the availability of full cardiac and respiratory cycles(Fig5) for cardiac fat quantification offers the possibility to probe EAT in the most suitable cardiac and respiratory phases, which are typically at end-expiration and peak-systole during which the pericardium is thicker. Quantitative PDFF for characterizing EAT (PDFF EAT=81.6±9.6% in healthy population), may be capable to probe the ‘colour’ of adipose tissue (brown, beige or white) as brown fat has been shown to have a lower PDFF than white fat like SAT. A larger cohort of healthy subjects and patients with metabolic disorders may enable the identification of healthy and pathological PDFF ranges.
Due to the proximity of the lungs, the B0 inhomogeneities field map had large spatial variations, influencing R2* quantification (Fig4,Fig5). It would be of interest to integrate a priori information of the scanner magnetic field distribution11,12 to improve the robustness of the B0 field map estimation and correct the R2* quantification13. Further investigation leveraging the 13 echoes could also provide valuable fatty acids composition characterization.
Conclusion
This study demonstrated precise and highly-resolved PDFF and R2* 3D maps to probe cardiac fat in metabolic diseases, which was enabled thanks to free-running cardiac Dixon-MRI GIRF corrected at 3T.Acknowledgements
This project has received financial support from the CNRS through a MITI program and was performed within a laboratory member of France Life Imaging network. (grant ANR-11-INBS-0006)References
1. Gaborit, B.; Sengenes, C.; Ancel, P.; Jacquier, A.; Dutour, A. Role of Epicardial Adipose Tissue in Health and Disease: A Matter of Fat? In Comprehensive Physiology; Terjung, R., Ed.; John Wiley & Sons, Inc.: Hoboken, NJ, USA, 2017; pp. 1051–1082 ISBN 978-0-470-65071-4.
2. Doukbi, E.; Soghomonian, A.; Sengenès, C.; Ahmed, S.; Ancel, P.; Dutour, A.; Gaborit, B. Browning Epicardial Adipose Tissue: Friend or Foe? Cells 2022, 11, 991, doi:10.3390/cells11060991.
3. Reeder, S.B.; Hu, H.H.; Sirlin, C.B. Proton Density Fat-Fraction: A Standardized Mr-Based Biomarker of Tissue Fat Concentration. J. Magn. Reson. Imaging 2012, 36, 1011–1014, doi:10.1002/jmri.23741.
4. Wu, M.; Junker, D.; Branca, R.T.; Karampinos, D.C. Magnetic Resonance Imaging Techniques for Brown Adipose Tissue Detection. Front. Endocrinol. 2020, 11, 421, doi:10.3389/fendo.2020.00421.
5. Di Sopra, L.; Piccini, D.; Coppo, S.; Stuber, M.; Yerly, J. An Automated Approach to Fully Self‐gated Free‐running Cardiac and Respiratory Motion‐resolved 5D Whole‐heart MRI. Magn. Reson. Med. 2019, 82, 2118–2132, doi:10.1002/mrm.27898.
6. Daudé, P.; Troalen, T.; Mackowiak, A.L.C.; Piccini, D.; Yerly, J.; Pfeuffer, J.; Kober, F.; Confort Gouny, S.; Bernard, M.; Stuber, M.; et al. Trajectory Correction Enables Free Running Cardiac DIXON at 3T.; London, UK, May 7 2022; p. Poster.
7. Campbell-Washburn, A.E.; Xue, H.; Lederman, R.J.; Faranesh, A.Z.; Hansen, M.S. Real-Time Distortion Correction of Spiral and Echo Planar Images Using the Gradient System Impulse Response Function: Real-Time Distortion Correction Framework for Fast Imaging. Magn. Reson. Med. 2016, 75, 2278–2285, doi:10.1002/mrm.25788.
8. Berzl,M.,Pfeuffer,J. et al. Improved Spiral Trajectory Correction Using the Gradient Impulse Response Function (GIRF). ISMRM 2017933.
9. Bydder, M.; Ghodrati, V.; Gao, Y.; Robson, M.D.; Yang, Y.; Hu, P. Constraints in Estimating the Proton Density Fat Fraction. Magn. Reson. Imaging 2020, 66, 1–8, doi:10.1016/j.mri.2019.11.009.
10. Daudé, P.; Kober, F.; Confort Gouny, S.; Bernard, M.; Rapacchi, S. Comparative Review of Algorithms and Methods for Proton-Density Fat Fraction (PDFF) Quantification.; London, UK, May 7 2022; p. Oral.
11. Sharma, S.D.; Artz, N.S.; Hernando, D.; Horng, D.E.; Reeder, S.B. Improving Chemical Shift Encoded Water–Fat Separation Using Object-Based Information of the Magnetic Field Inhomogeneity. Magn. Reson. Med. 2015, 73, 597–604, doi:10.1002/mrm.25163.
12. Diefenbach, M.N.; Ruschke, S.; Eggers, H.; Meineke, J.; Rummeny, E.J.; Karampinos, D.C. Improving Chemical Shift Encoding-Based Water-Fat Separation Based on a Detailed Consideration of Magnetic Field Contributions. Magn. Reson. Med. 2018, 80, 990–1004, doi:10.1002/mrm.27097.
13. Hernando, D.; Vigen, K.K.; Shimakawa, A.; Reeder, S.B. R2* Mapping in the Presence of Macroscopic B0 Field Variations. Magn. Reson. Med. 2012, 68, 830–840, doi:10.1002/mrm.23306.
14. Mackowiak, A.L.C.; Roy, C.W.; Yerly, J.; Falcão, M.B.L.; Bacher, M.; Speier, P.; Piccini, D.; Stuber, M.; Bastiaansen, J.A.M. Whole-Heart Motion-Resolved Multi-Peak Fat-Fraction Mapping Using Free-Running 3d Radial Multi-Echo Gre and Pilot Tone. 2022, doi:10.48550/ARXIV.2210.06127.
Figures