0160
Developing a Graph Convolutional Network of Differentiable Graph Module for Multi-Modal MRI Data: An Application to Parkinson's Disease1Paul C. Lauterbur Research Center for Biomedical Imaging, Shenzhen Institutes of Advanced Technology, Chinese Academy of Sciences, Shenzhen, China, 2University of Chinese Academy of Sciences, Beijing, China, 3The Second People’s Hospital of Shenzhen, Shenzhen, China, 4Research Center for Medical AI, Shenzhen Institutes of Advanced Technology, Chinese Academy of Sciences, Shenzhen, China
Synopsis
Keywords: Machine Learning/Artificial Intelligence, Parkinson's Disease
With the ageing of the population, Parkinson's disease (PD) has presented a severe challenge to public health. Here, a deep-learning framework named the AMDGM model was proposed to predict PD patients at an early stage. Firstly, multi-modal image-based models were respectively generated using the AMDGM model. Then, a weighted ensemble network was created as the final model. The proposed method achieved the best AUC performance of 0.872 in the testing cohort, better than others. And the proposed method can predict PD patients early to help clinical radiologists formulate more targeted treatments in the future.Introduction
Parkinson's disease (PD) is the world's second most common neuropsychiatric disease1. In practice, traditional PD diagnosis methods may be subjective since they depend on analyzing motions that are occasionally faint to human eyes and hence challenging to be categorized, potentially leading to misdiagnosis2. Therefore, there is an urgent demand in predicting PD patients at the early stage in the clinic. Currently, Graph Convolutional Networks (GCN) in deep learning are widely concerned as they can effectively integrate multi-modal features and model the correlation between samples. Previous studies have shown the ability of GCN to classify PD and Alzheimer's disease (AD) on MRI with high accuracy3-4. And our group proposed a deep-learning method to differentiate PD patients and healthy controls (HC), an ensemble-learning framework using a graph convolution neural network of differentiable graph module for multi-modal MRI data. The experiments showed that the proposed method could successfully achieve early diagnosis o PD patients based on multi-modal MRI data.Methods
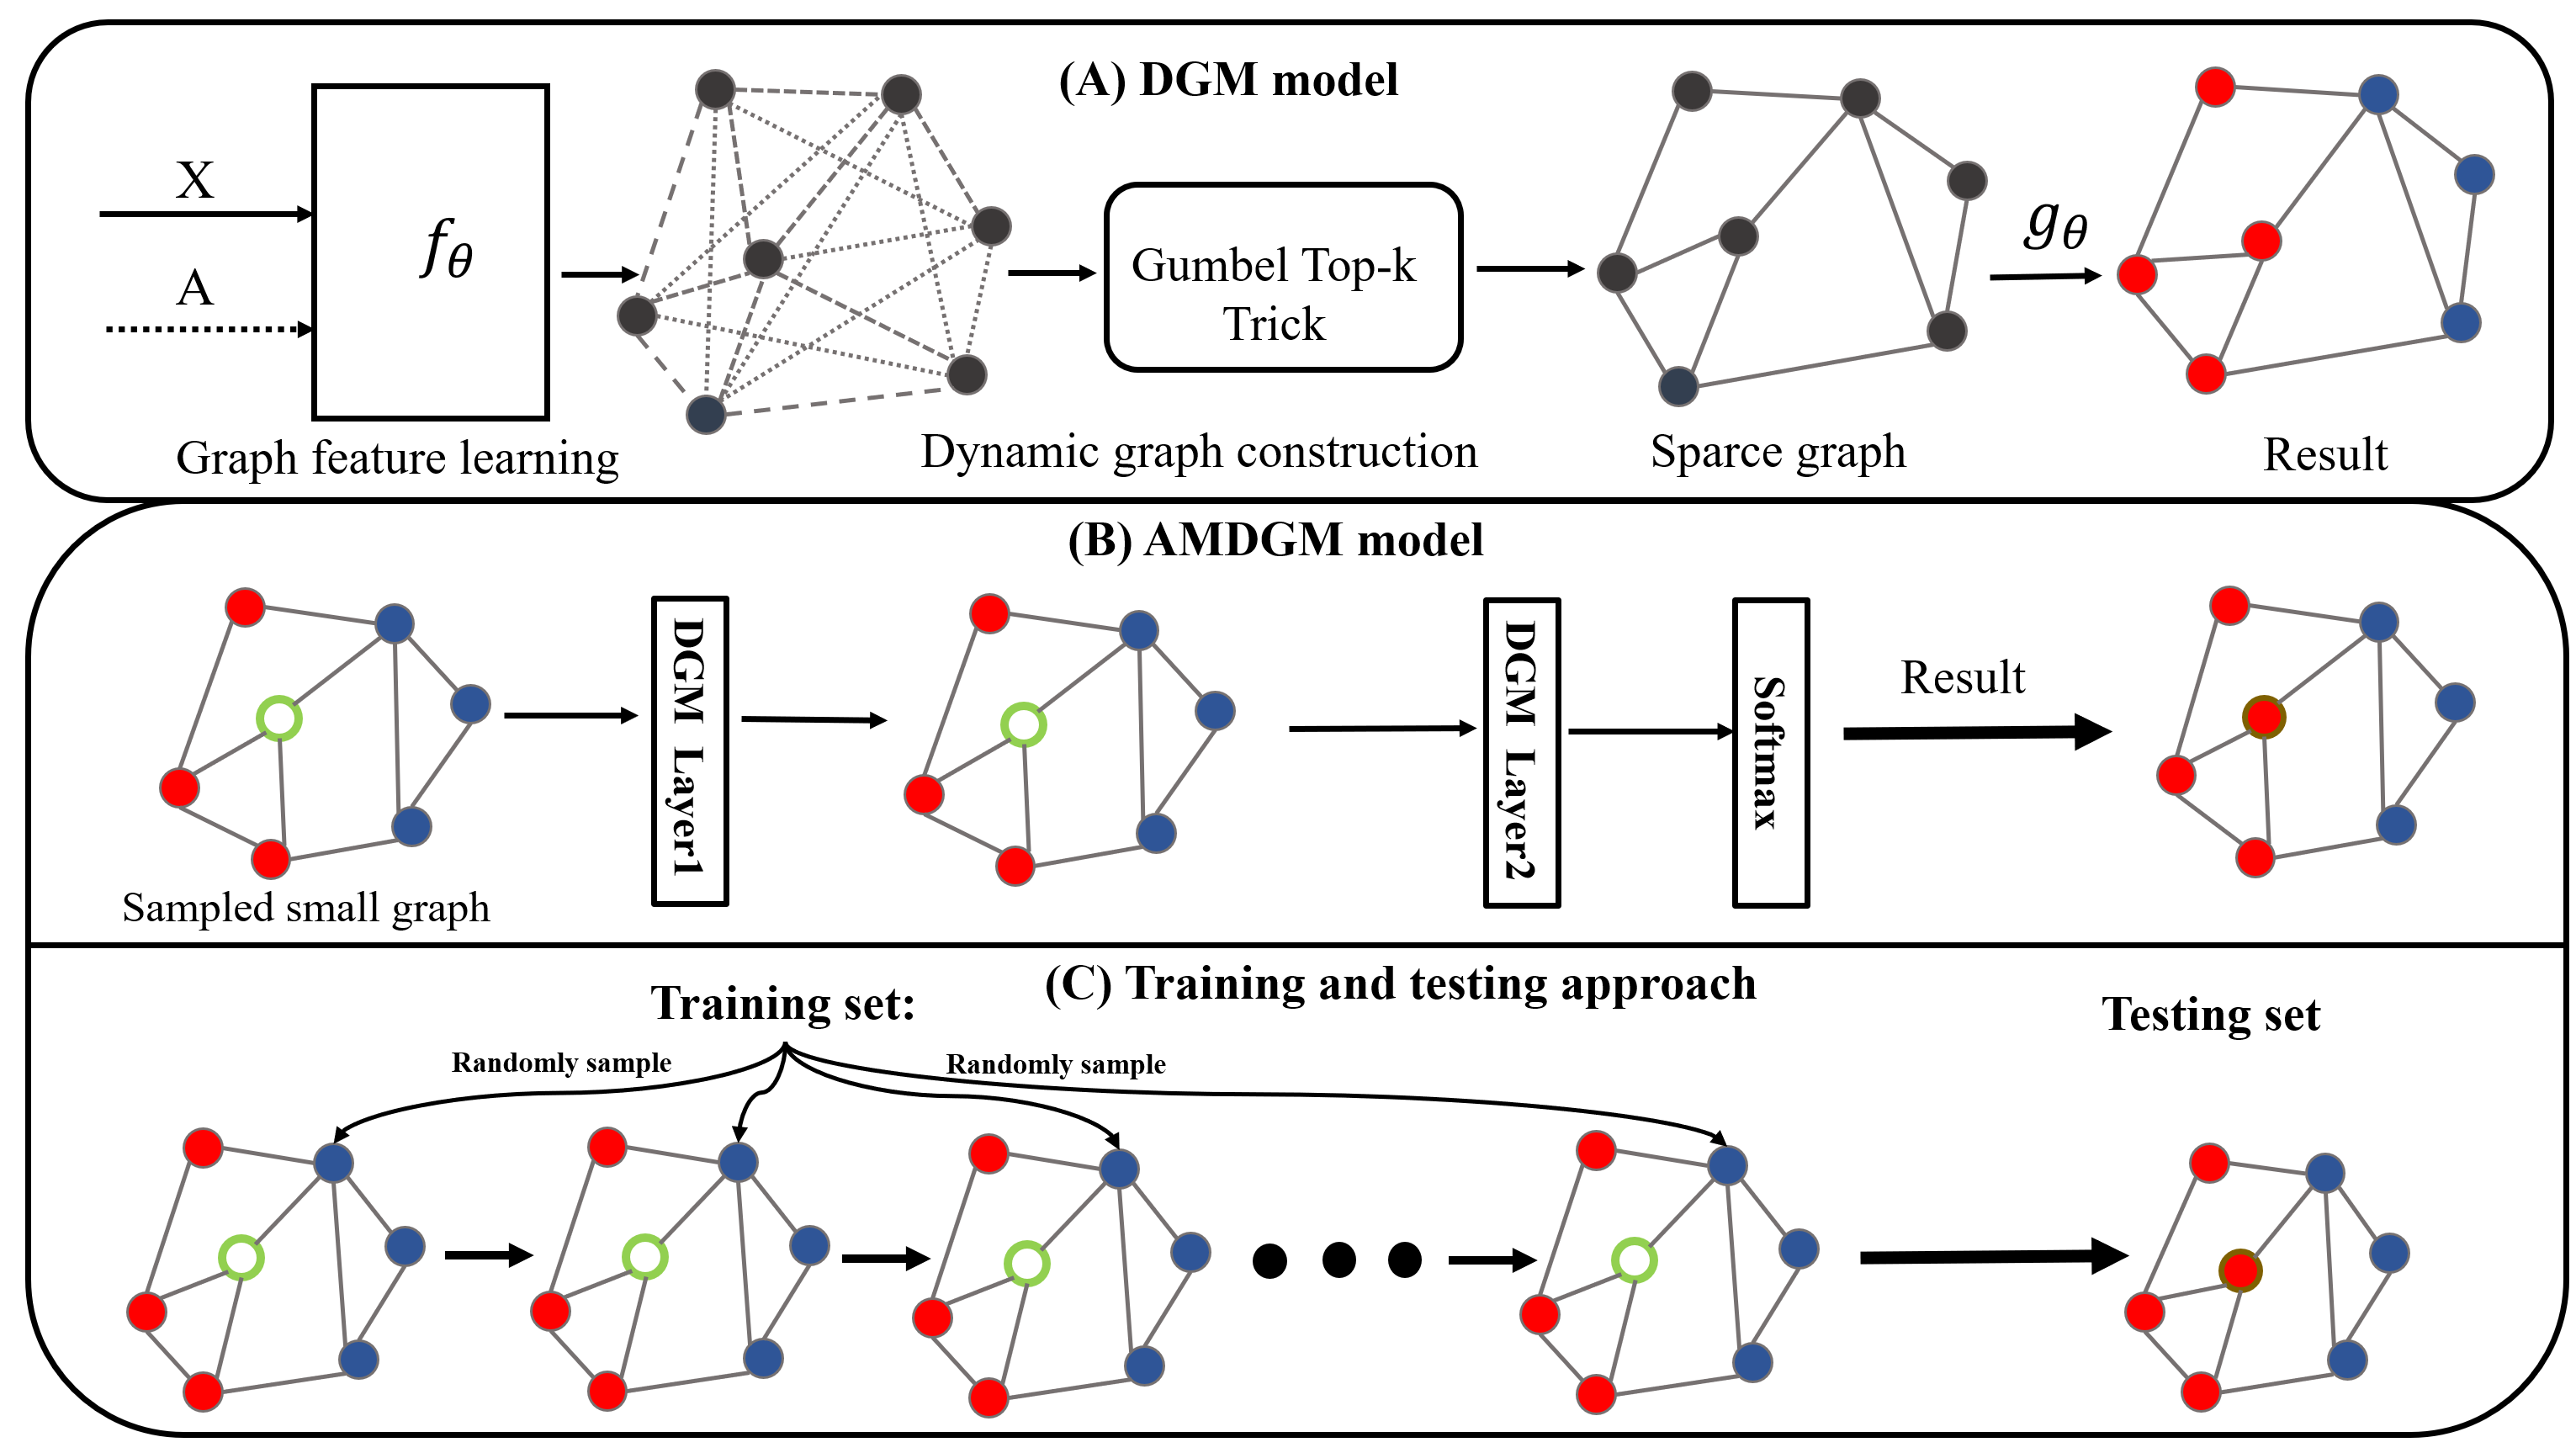
The network we use to present our approach is auto-metric DGM(AMDGM), whose structure is based on the DGM model5. The proposed model improves upon previously developed DGM designs, using the few-shot approach to achieve inductive learning of independent tests and imbalanced positive and negative data samples. An ensemble technique was employed to integrate T1, DTI, and fMRI modalities data. In this way, it received prediction scores from the image-based models as inputs and formed outputs by the weights of the prediction scores.The DGM model (Figure 1A) proposes a generic method for learning the graph based on the characteristics of each layer's output. It takes the feature matrix X as input and yields a graph G as output, and the initial adjacency matrix A is optional as it can be defined following the domain knowledge or directly following the network using the Gumbel-Top-k trick6. To address the issue of imbalanced data samples, inspired by AMGNN model7, we proposed a new model AMDGM (Figure 1B). In this approach, a tiny graph created by randomly chosen samples serves as the input, and the labels of unknown nodes in the graph structure are obtained through multiple AMDGM layers, and then the training and testing strategy was applied (Figure 1C). Samples are initially chosen randomly from the dataset to serve as the model's input X. It contains q known samples per category and one unknown sample whose label is defined as Y:
$$X=\left\{ \left\{ \left( x_1,c_1 \right) ,...,\left( x_{\left( N-1 \right)},c_{\left( N-1 \right)} \right) \right\} ,\left\{ \overline{x} \right\} ;c_i∈\left\{ 1,C \right\} \right\} $$Where x is the sample, $$$\overline{x}$$$ is the unknown sample, c is the label, C is the number of categories, and $$$N=C∙q+1$$$.
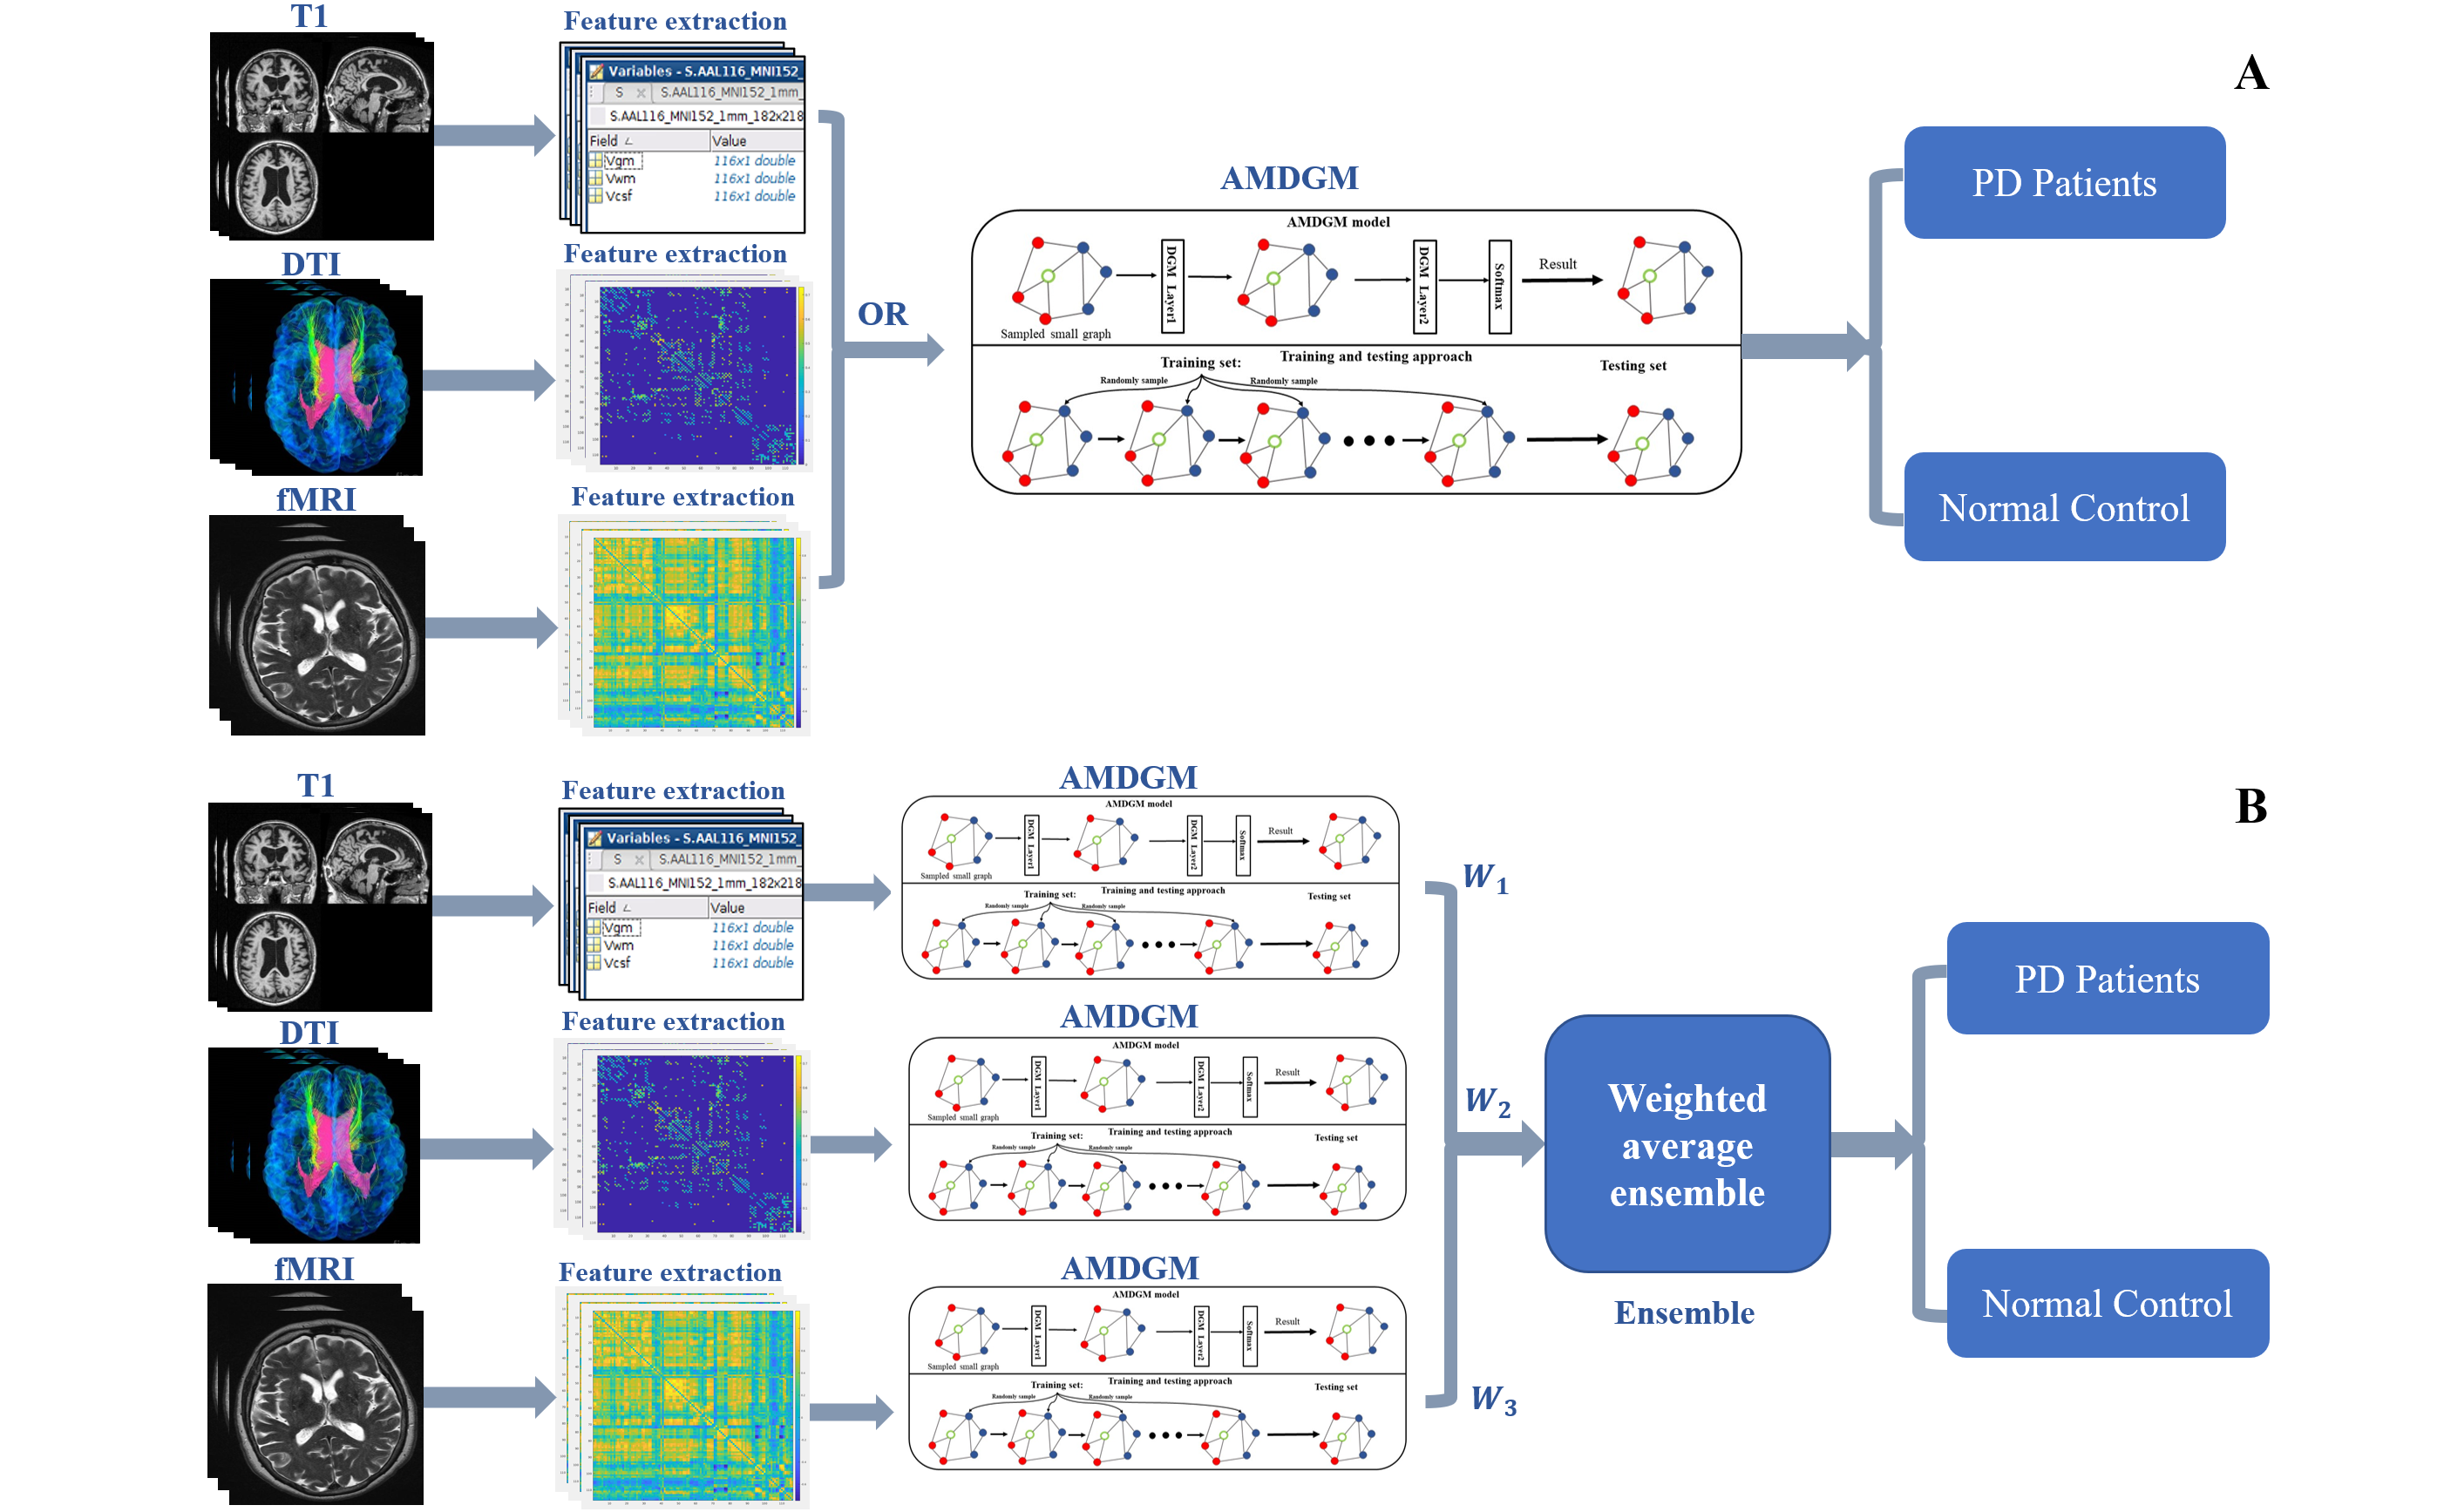
Then the matrix X was put into DGM model as the initial input and the label of the unknown node is obtained. The parameters of the network can be updated through supervised learning. The updated parameters serve as as the initial parameters for training the subsequent new iteration. Finally, the AMDGM architecture was used for prediction challenges in a single input modality (Figure 2A) and directly integrated the three input modalities using an ensemble-learning approach for information fusion (Figure 2B).
The Parkinson’s Progression Markers Initiative (PPMI) database includes 123 PD patients and 41 HC, with T1, DTI, and fMRI modalities data8 (Table 1), and the protocols were approved by our Institutional Reviews Board (IRB). Data were randomly split into a training dataset (n = 114) and an independent test dataset (n = 50). All T1, DTI, and fMRI modalities data are individually preprocessed by the software of SPM, PANDA, and DAPBI9-11. Then the preprocessed images are segmented into AAL-116 template12 and used the REF algorithm for feature selection13 due to the high dimensionality of features.
The Adam optimizer and the binary cross-entropy loss function were implemented to optimize the network, with the learning rate set to 0.001 and batch size of 4 for 10 epochs and iterations were 100. The number of GCN layers used was 2, and the number of q was 10. The weights were $$$W_1=0.2,W_2=0.3,W_3=0.5$$$. The following metrics were calculated to evaluate performance using a five-fold cross-validation procedure: AUC, accuracy, sensitivity, and specificity.
Results
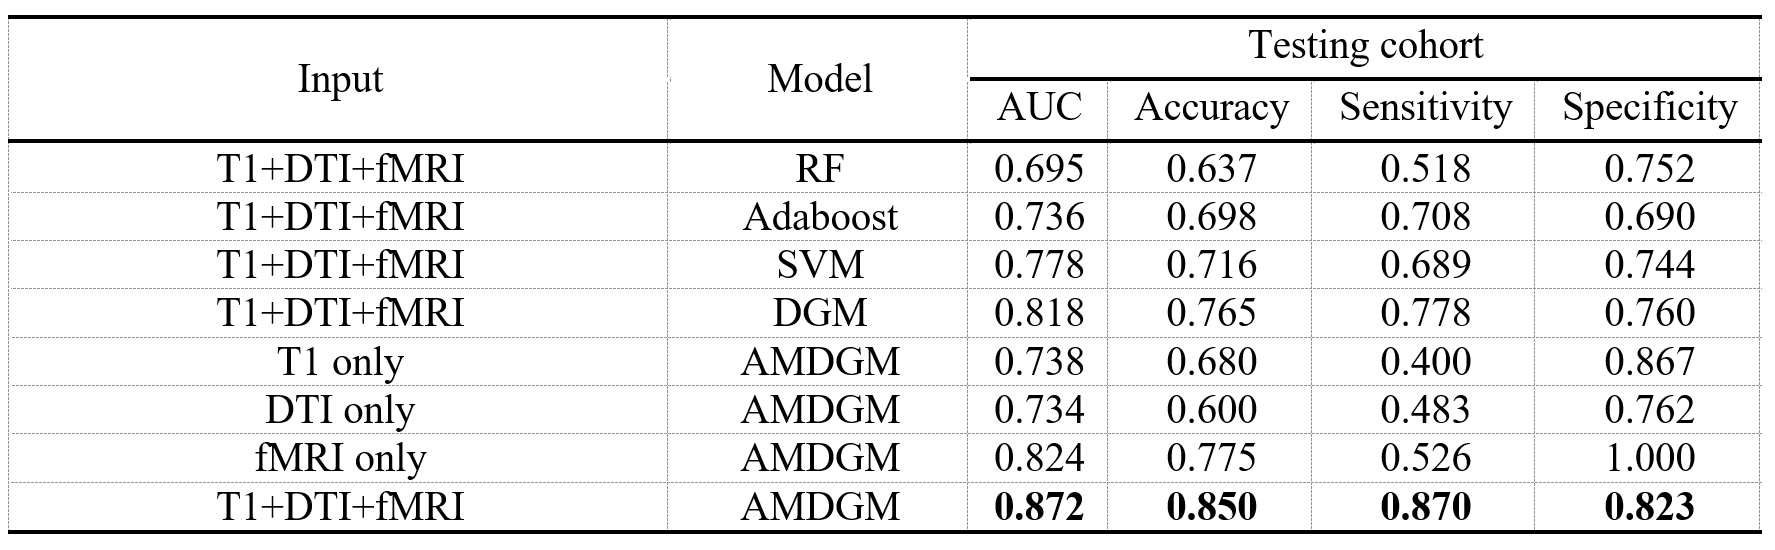
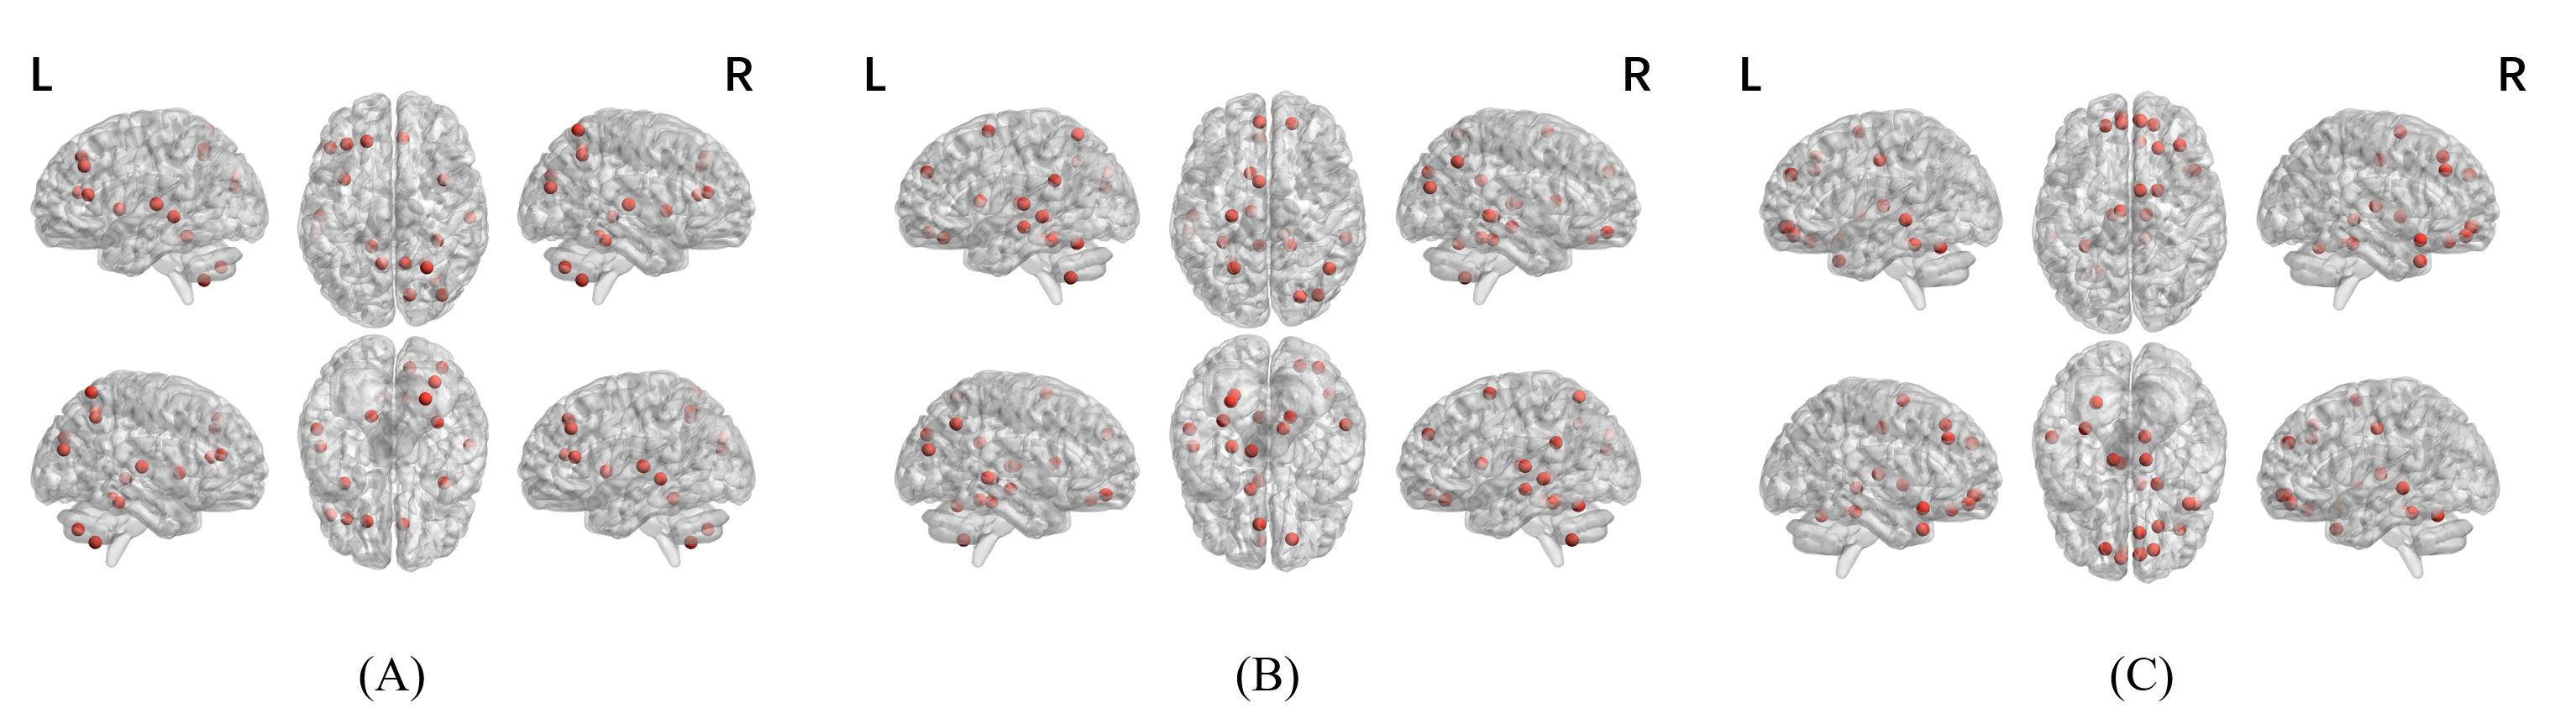
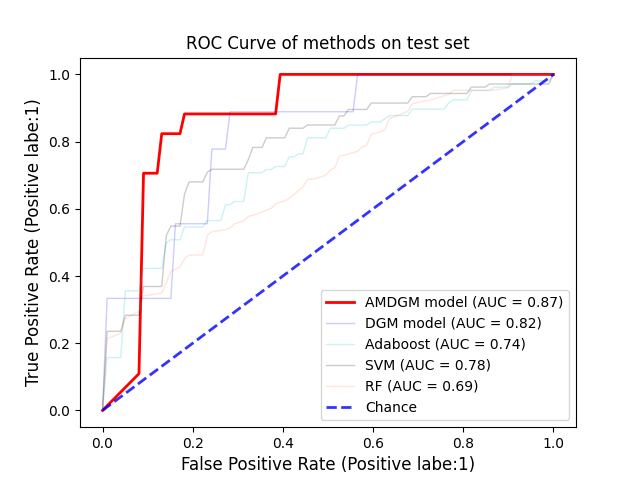
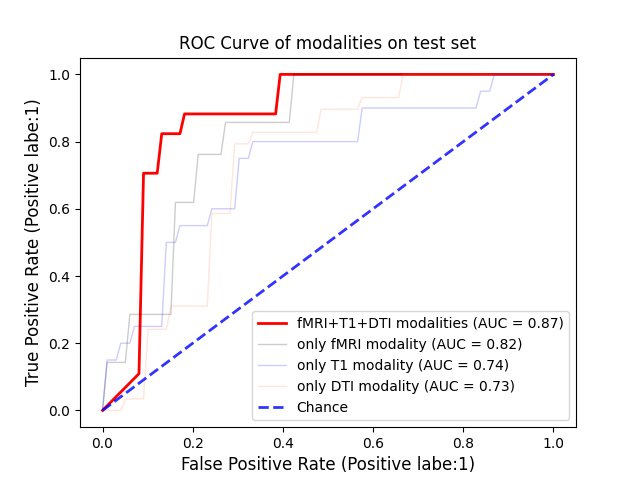
Performance of the single input modality of AMDGM and proposed AMDGM on the dependent test set described in Table 2. The best classification results were obtained for the proposed AMDGM model (T1+DTI+fMRI modalities) with an AUC of 0.872 in the testing cohort. Figure 3 shows the most high-frequency 20 features extracted by the REF algorithm. Figure 4 shows the ROC curve for the single input modality of AMDGM models’ performance on the test set. Figure 5 shows the ROC curve for our proposed AMDGM models’ performance on the test set.Discussion and Conclusion
In this study, the proposed AMDGM model achieved the best AUC performance of 0.872, indicating that integrating multi-modal data on MRI scanners is better than a single MRI modality. And this model can rectify the imbalanced data sample issue. The current test results indicate that the proposed method could be an efficient, reliable way to predict PD patients at an early stage. More significant sample sizes from more than one site are preferred in future investigations.Acknowledgements
This work was partially supported by the National Natural Science Foundation of China (61871373, 62271474, 81830056, U1805261, 81729003, 81901736, 12026603, 12026603 and 81971611), the Strategic Priority Research Program of Chinese Academy of Sciences (XDB25000000 and XDC07040000), the High-level Talent Program in Pearl River Talent Plan of Guangdong Province (2019QN01Y986), the Key Laboratory for Magnetic Resonance and Multimodality Imaging of Guangdong Province (2020B1212060051), the Science and Technology Plan Program of Guangzhou (202007030002), the Key Field R&D Program of Guangdong Province (2018B030335001), the Shenzhen Science and Technology Program, Grant Award (JCYJ20210324115810030), and the Shenzhen Science and Technology Program (Grant No. KQTD20180413181834876, and KCXF20211020163408012).References
1. Mhyre, Timothy R et al. “Parkinson's disease.” Sub-cellular biochemistry, vol. 65 (2012): 389-455.
2. Mei, Jie et al. “Machine Learning for the Diagnosis of Parkinson's Disease: A Review of Literature.” Frontiers in aging neuroscience vol. 13 633752. 6 May. 2021.
3. Payan, Adrien and G. Montana. “Predicting Alzheimer's Disease - A Neuroimaging Study with 3D Convolutional Neural Networks.” ICPRAM (2015), vol. 2015, p. 355-362.
4. Xi, et al. "Multi-View Graph Convolutional Network and Its Applications on Neuroimage Analysis for Parkinson's Disease. " AMIA Symposium, Vol. 2018, 2018, p. 1147-1156.
5. Kazi, Anees et al. “Differentiable Graph Module (DGM) for Graph Convolutional Networks.” IEEE transactions on pattern analysis and machine intelligence, vol. PP 10.1109/TPAMI.2022.3170249. 26 Apr. 2022.
6. W. Kool, H. van Hoof, and M. Welling, “Stochastic beams and where to find them: The gumbel-top-k trick for sampling sequences without replacement,” CoRR, vol. abs/1903.06059,2019.
7. Song, Xiaofan et al. “Auto-Metric Graph Neural Network Based on a Meta-Learning Strategy for the Diagnosis of Alzheimer's Disease.” IEEE journal of biomedical and health informatics, vol. 25,8 (2021): 3141-3152.
8. Kenneth Marek et al., "The Parkinson Progression Marker Initiative (PPMI)," Progress in Neurobiology, vol. 95, no. 4,2011, pp. 629-635.
9. Flandin, Guillaume, and Karl Friston. “Statistical Parametric Mapping (SPM).” Scholarpedia, vol. 3, no. 4, 2008, p. 6232.
10. Cui, Zaixu, et al. “PANDA: A Pipeline Toolbox for Analyzing Brain Diffusion Images.” Frontiers in Human Neuroscience, vol. 7, 2013.
11. Yan, Chao-Gan, et al. “DPABI: Data Processing & Analysis for (Resting-State) Brain Imaging.” Neuroinformatics, vol. 14, no. 3, 13 Apr. 2016, pp. 339–351.
12. Tzourio-Mazoyer, N., et al. “Automated Anatomical Labeling of Activations in SPM Using a Macroscopic Anatomical Parcellation of the MNI MRI Single-Subject Brain.” NeuroImage, vol. 15, no. 1, Jan. 2002, pp. 273–289.
13. Guyon, Isabelle et al. “Gene Selection for Cancer Classification using Support Vector Machines.” Machine Learning, vol.46 (2004): 389-422.
Figures