0151
Repeatability and reproducibility of a multi-vendor spin and gradient echo (SAGE) pulse sequence for dynamic susceptibility contrast MRI1Division of Neuroimaging Research and Barrow Neuroimaging Innovation Center, Barrow Neurological Institute, Phoenix, AZ, United States, 2Department of Radiology, Mayo Clinic College of Medicine, Phoenix, AZ, United States, 3Hyperfine Inc., Guilford, CT, United States, 4The University of Texas MD Anderson Cancer Center, Houston, TX, United States, 5Neuroradiology, Southwest Neuroimaging at Barrow Neurological Institute, Phoenix, AZ, United States, 6Department of Biophysics Medical College of Wisconsin, Milwaukee, WI, United States
Synopsis
Keywords: Tumors, DSC & DCE Perfusion, sequence
Single-echo pulse sequences are commonly employed for DSC-MRI. The multi-echo spin and gradient echo (SAGE) sequence can be useful in multi-contrast and multi-scale imaging of morphologic and functional features of brain tumor vasculature. The goal of this study is to establish harmonized SAGE sequence and analysis protocol across primary MRI vendors to facilitate multi-site clinical trials. In this work, we present initial results of SAGE sequence multi-site reproducibility and repeatability in phantom, healthy volunteers and high-grade glioma patients.Introduction
Dynamic susceptibility (DSC)-MRI techniques have been instrumental in guiding brain tumor patient management. While single-echo pulse sequences are commonly employed for DSC-MRI, multi-echo spin and gradient echo (SAGE) is a compelling alternative that enables multi-contrast and multi-scale imaging of morphologic and functional features of brain tumor vasculature. The overall goal of this NCI Quantitative Imaging Network (QIN) project is to establish a harmonized SAGE sequence and analysis solution across the primary MRI vendors to facilitate multi-site clinical trials. In this work, we present preliminary analysis of SAGE multi-site reproducibility in a phantom study and single-site repeatability in healthy volunteers (HVs) and high-grade glioma (HGG) patients.Methods
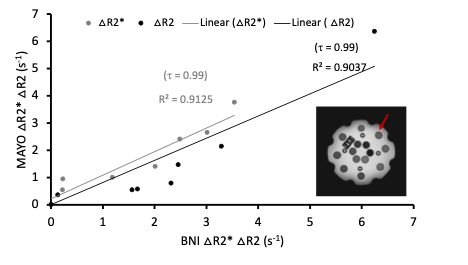
All procedures involving healthy controls and patients were performed according to the guidelines of the internal review board (IRB).Phantom: The essential system phantom by Caliber MRI (Fig.1, inset) was used to compare agreement between ΔR2 and ΔR2* values across vials (outer circle (red arrow)) from 3T MRI scanners at two sites. The parameters employed at Mayo Clinic Arizona (Siemens: echo time (TE) TE1-TE5 = 0.011/0.033/0.063/0.085/0.107 s) and Barrow Neurological Institute (BNI) (Philips: TE1-TE5 = 0.0074/0.0269/0.0582/0.077/0.097 s), flip angle (FA) = 90°, TR = 1.5 s. Data are also being collected on GE scanners with similar parameters.
Healthy volunteers: Data acquired at BNI for HVs (n=13) for visits (V1 and V2) (no contrast agent (CA)) was separated by subjects being taken out of the scanner in between scans for 3-5 minutes to assess repeatability. The acquisition parameters were as follows: TR and TE matched that for Philips above, with resolution 2x2x5 mm3, 18 axial slices, and 25 dynamics.
Patients: Three HGG patients (> 5 mm enhancing lesion) were enrolled so far and underwent a double baseline DSC-MRI study, with visits separated by not more than 8 days. The acquisition parameters matched to HVs with 200 dynamics (CA-Gadavist, 0.1mmol/kg).
We acquired T1 weighted (w) with and without contrast both for HVs and patients as well.
Analysis: The ΔR2 and ΔR2* values in phantom were estimated by subtracting R2 and R2* values of the adjacent vials obtained by bi-exponential fitting of the SAGE signal1,2. Similarly, ΔR2 and ΔR2* values in HVs were estimated from differences in bi-exponentially fitted R2 and R2* values between regions of interest (ROI) segmented from cerebrospinal fluid (CSF) and white matter in a single slice. For patients, we obtained simplified (s) sSAGE2 derived ΔR2 and ΔR2* time-courses which were processed using Boxerman-Schmainda-Weisskoff (BSW) leakage correction3 and then integrated over time to obtain cerebral blood volume (CBV) maps. ROIs of whole brain normal appearing white matter and tumor were segmented using FSL4 and ITK-SNAP5 on the difference of T1w anatomic images obtained before and after contrast injection (T1diff). The registration of SAGE and T1w images from V2 to V1 was performed using analysis of functional neuroimages (AFNI)6 and advanced normalization tools (ANTS)7 in both HVs and patients. Kendall’s tau-b coefficient (τ) was used for correlation estimation.
Results
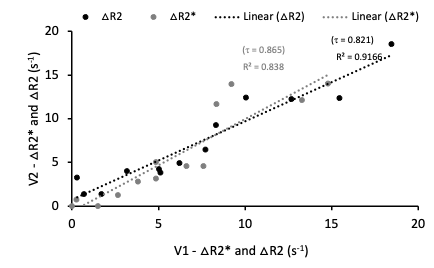
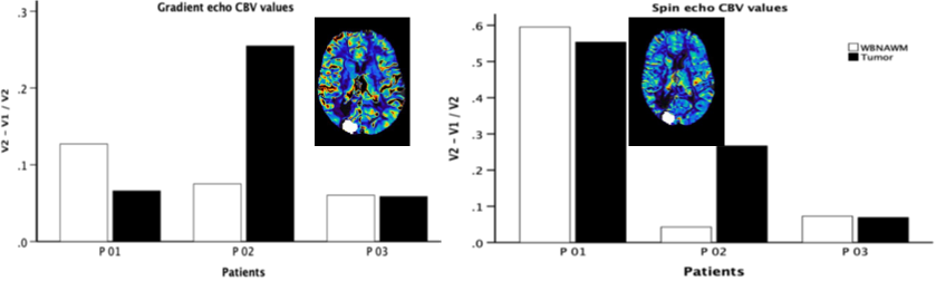
In the phantom vials, the correlation across sites was τ=0.99 for both ΔR2 and ΔR2* (ρ < 0.001 for both) as shown in Fig. 1. The τ values in Fig. 2 show high correlation in healthy volunteers between V1 and V2 for ΔR2 (τ=0.821, ρ < 0.001) and ΔR2* (τ=0.865, ρ < 0.001). Analysis of repeatability in HGG patients is ongoing, but preliminary results in three patients indicate that the percent difference between visits is less than 30% and 60% for GRE and SE CBV values, respectively (Fig. 3).Discussion
The results show high correlation between ΔR2 and ΔR2* values in phantom data obtained from BNI and Mayo, illustrating reproducibility of DSC SAGE-MRI sequence across the two sites. Similarly, the high correlation coefficient in healthy volunteer test-retest ΔR2 and ΔR2* values show the repeatability of SAGE DSC MRI protocol. Preliminary assessment of test-retest in HGG patients is encouraging, but further analysis is needed and, in particular, we are looking to establish QA/QC pipelines specific to SAGE time series to ensure data fidelity.Conclusion
The early analysis of the SAGE repeatability and reproducibility data provides compelling evidence that multi-site, harmonized SAGE is feasible. We are in the process of acquiring test-retest healthy volunteer data from our collaborative partners and additional patient data from BNI.Acknowledgements
This work was supported by National Institutes of Health award number NIH/NCI 1UG3CA247606-01.
We are also thankful to Maurizio Bergamino for his technical inputs.
References
1. Schmiedeskamp, H. et al. Combined spin- and gradient-echo perfusion-weighted imaging. Magnetic Resonance in Medicine 68, 30–40 (2012).
2. Stokes, A., Skinner, J., Yankeelov, T. & Quarles, C. Assessment of a Simplified Spin and Gradient Echo (sSAGE) Approach for Human Brain Tumor Perfusion Imaging. Magnetic Resonance Imaging 34, (2016).
3. Boxerman, J. L., Schmainda, K. M. & Weisskoff, R. M. Relative Cerebral Blood Volume Maps Corrected for Contrast Agent Extravasation Significantly Correlate with Glioma Tumor Grade, Whereas Uncorrected Maps Do Not. Am. J. Neuroradiol. 27, 859 (2006).
4. Jenkinson, M. & Smith, S. A global optimisation method for robust affine registration of brain images. Med Image Anal 5, 143–156 (2001).
5. Yushkevich, P. A. et al. User-guided 3D active contour segmentation of anatomical structures: significantly improved efficiency and reliability. Neuroimage 31, 1116–1128 (2006).
6. Cox, R. W. & Hyde, J. S. Software tools for analysis and visualization of fMRI data. NMR in Biomedicine 10, 171–178 (1997).
7. Avants, B. B., Tustison, N. & Song, G. Advanced Normalization Tools (ANTS).
Figures