0148
Improved diagnostic performance of APTw MRI to multiparametric non-contrast-enhanced MRIs in patients with post-treatment high-grade gliomas1Department of Radiology, Johns Hopkins University, Baltimore, MD, United States, 2Department of Computer science, Johns Hopkins Univeristy, Baltimore, MD, United States, 3Department of Applied Mathematics and Statistics, Johns Hopkins Univeristy, Baltimore, MD, United States, 4Department of Neurology, Johns Hopkins University, Baltimore, MD, United States, 5Department of Radiology, Kennedy Krieger Institute, Baltimore, MD, United States, 6Department of Oncology, Johns Hopkins University, Baltimore, MD, United States, 7Department of Neurosurgery, Johns Hopkins University, Baltimore, MD, United States
Synopsis
Keywords: Tumors, Treatment
We explored non-contrast-enhanced MRI performances of APTw, DWI, SWI, and pCASL at 3 Tesla in glioma patients post-treatment. APTw, ADC, QSM, and CBF histogram parameters from volumetric ROIs were recorded. Multivariable logistics regression with principal component analysis (PCA) was built for differentiating treatment effect from tumor recurrence. Results showed that the regression model trained on the combination of APTw, CBF, and QSM achieved the highest classification performance, with an AUC of 0.90.Target audience
Researchers and clinicians interested in advanced MRI techniques for the management of tumor treatment.Purpose
Newly developed or enlarged lesions in malignant gliomas after surgery and chemoradiation are associated with tumor recurrence or treatment effect.1,2 Non-specific image characteristics of MRI techniques for these two pathologies have posed a formidable clinical and radiologic dilemma for decades. Amide proton transfer-weighted (APTw) imaging is a recent protein-based molecular MRI technique that has shown great potential for glioma diagnostics.3,4 Here, we compared the diagnostic performances of several non-contrast-enhanced MRI sequences,5-7 including diffusion-weighted imaging (DWI), susceptibility-weighted imaging (SWI), pseudo-continuous arterial spin labeling (pCASL), and APTw MRI, and evaluated the incremental diagnostic performance when adding APTw MRI to these MRI sequences in post-treatment glioma patients.Methods
This prospective study was approved by the Institutional Review Board. Patients with suspected recurrent malignant glioma were recruited. MR images were obtained on a 3T Philips MRI scanner, using the following parameters: T2w (TR = 4575 msec, TE = 80 msec, 66 slices, thickness = 2 mm), FLAIR (TR = 11 sec, TE = 100 msec, inversion recovery time = 2.8 s, 66 slices, thickness = 2 mm); T1w and Gd-enhanced T1w (3D MPRAGE, TR = 3 sec, TE = 3.7 msec, inversion recovery time = 843 ms, 132 slices, thickness = 1 mm); DWI (TR = 3688 msec, TE = 80 msec, b value = 1000 s/mm2, 33 slices, thickness = 3.4 mm, gap = 0.6 mm); pCASL (labeling time = 1.8 s, post-labeling delay = 1.8 s, TR = 4.4 s, TE = 15 ms, 15 slices, thickness = 4 mm); SWI (TR = 40 ms, TE1/DTE = 6/6 ms, 5 echoes, 132 slices, thickness = 1 mm); and APTw imaging (RF saturation power = 2 µT, duration = 2 s, TR = 6.5 s, TE = 8.31 ms, 15 slices, thickness = 4 mm).Data processing was performed by Matlab and Python. Isotropic apparent diffusion coefficient (ADC), quantitative susceptibility mapping (QSM), and cerebral blood flow (CBF) maps were, respectively, calculated from acquired DWI (isotropic weighting), SWI, and pCASL images. APTw images were calculated using the magnetization-transfer-ratio asymmetry at 3.5ppm offset from the water frequency, with an intrinsically referenced DB0-correction method (called CEST-Dixon). Advanced MRI images, together with conventional ones, were all resampled and co-registered to T2w images and then to APTw images. Volumetric regions of interest (ROI) were manually drawn using Gd-enhanced T1w and conventional MRI images as references. Volumetric histogram analysis approach was employed to extract histogram parameters from regions with gadolinium enhancement. Notably, the ROIs covered the entire Gd-enhanced tumor contour, which may include liquefactive necrosis, hemorrhage, or blood vessels.
An unpaired student's t test was employed to choose the extracted parameters with significant difference between two entities for further multiparameter analysis. Principal component analysis (PCA) was employed to reduce data dimension and feature selection for model training. The training set and test set were constructed by randomly selecting 80% and 20% scans, and the combinations of different modalities were trained in the training set. Receiver operating characteristic (ROC) analysis was employed to evaluate differentiation capability independently. To evaluate the performances of MRI sequences, statistical significance (P < 0.05) was selected to train multivariable logistic regression models.
Results and Discussion
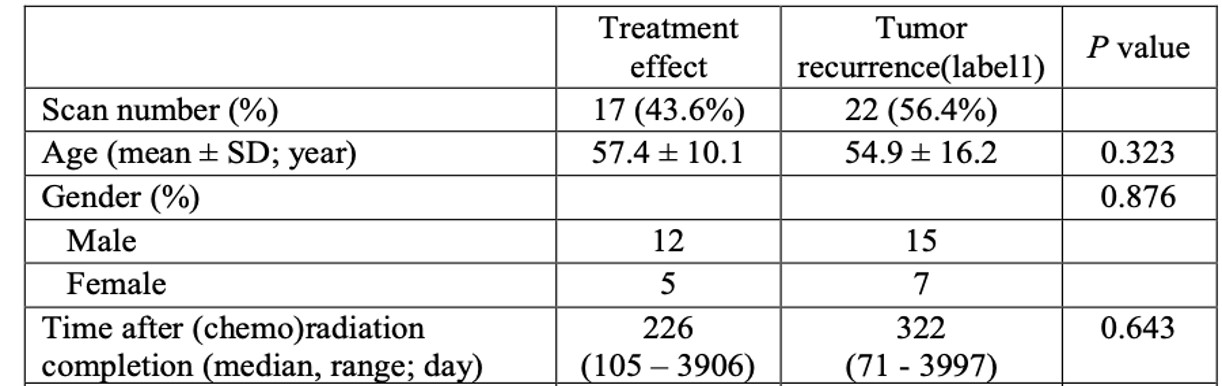
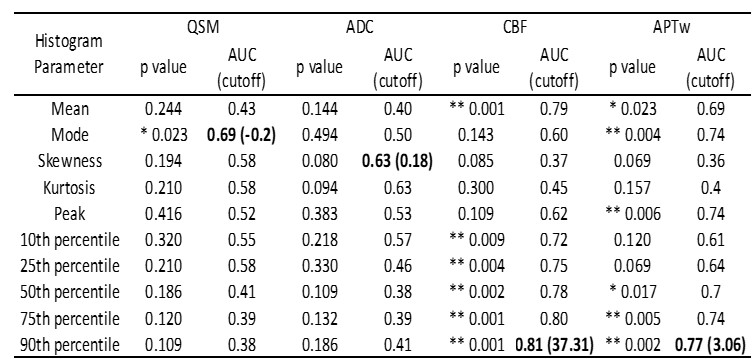
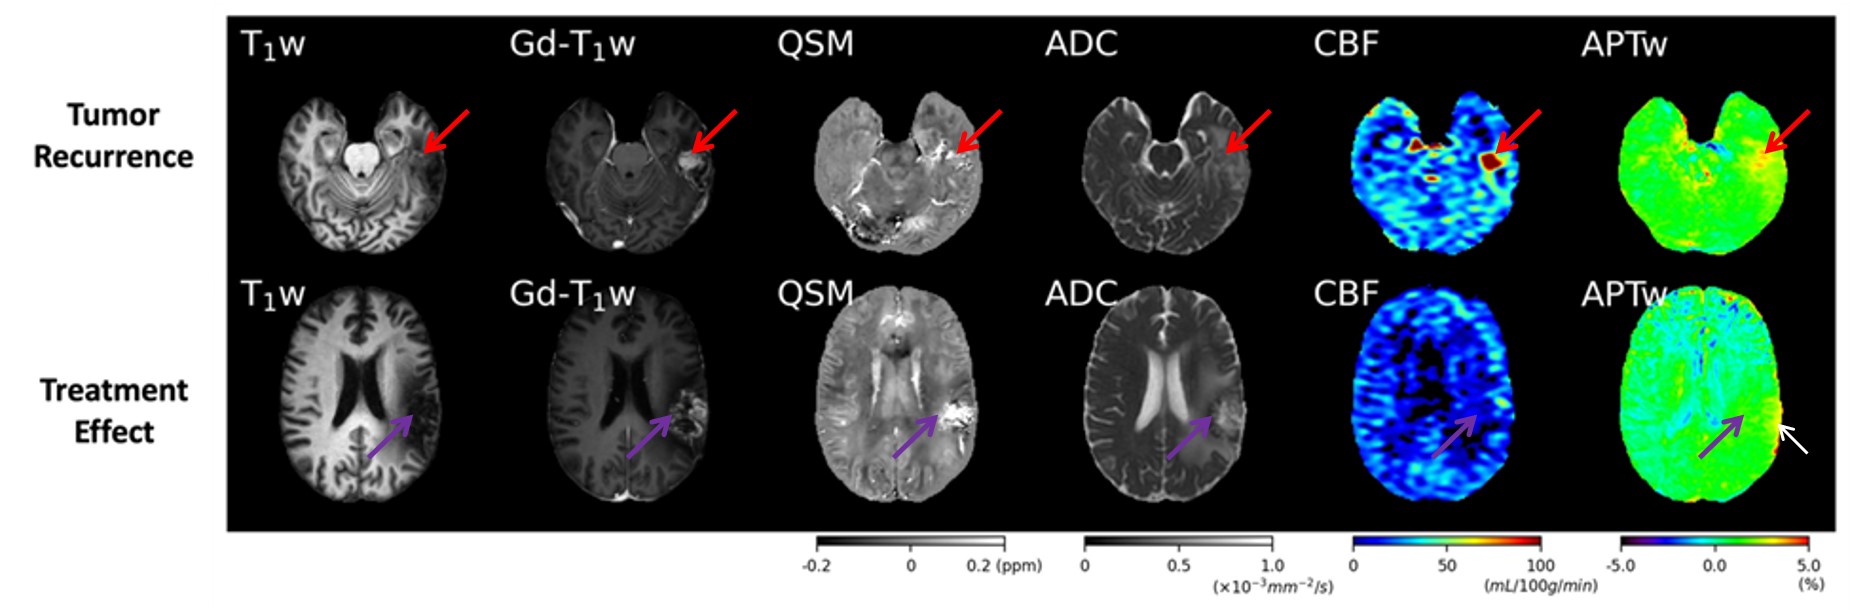
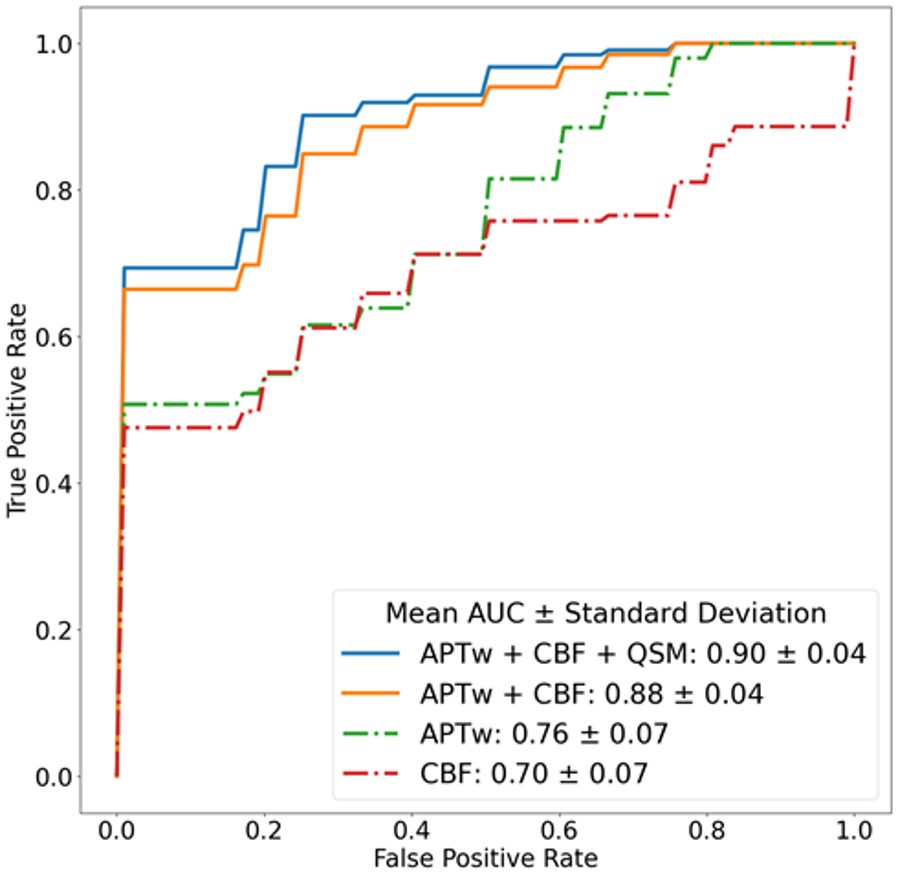
40 scans from 28 patients were collected, including 23 tumor recurrence vs. 17 treatment effect, which were determined by biopsy or integrated clinical diagnosis (Table 1). Two examples of the conventional and advanced MR images from patients with tumor recurrence and treatment effect are shown in Fig. 1. The p values, ROC AUCs, and corresponding cutoff values for all histogram parameters are listed in Table 2. No ADC-derived histogram parameter showed significant difference between the two entities; mode from QSM was the only one parameter with significant difference; CBF and APTw yielded the most histogram parameters (both n = 6) that are able to differentiate treatment effect and tumor recurrence. The logistic regression model trained with the combination of all these significant histogram parameters from APTw, CBF, and QSM achieved the highest classification performance, with a test set AUC of 0.90. This combination model outperformed the joint model trained with APTw and CBF (AUC = 0.88), the single model with APTw (AUC = 0.76) or the single model with CBF (AUC = 0.70), as illustrated in the ROC curves (Fig. 2).Our preliminary results demonstrated that multiple histogram parameters, particularly from APTw and pCASL images, are capable of differentiating between treatment effect and recurrent tumor. The regression model analysis indicates a synergistic and complimentary contribution from APTw and CBF to the classification model and the additional value of APTw parameters. Several limitations of this abstract are: the relatively small sample size, a lack of "gold standard" histopathology for all patients, intratumoral heterogeneity, and a mix of active tumor and treatment effect for many cases.
Conclusions
APTw and pCASL MRI are two powerful, non-contrast-enhanced MRI techniques for the assessment of post-treatment high-grade gliomas. APTw images added value to pCASL and other advanced MR images for the differentiation of treatment effect and tumor recurrence.Acknowledgements
The authors thank our clinical collaborators for help with the patient recruitment and MRI technicians for assistance with MRI scanning. This study was supported in part by grants from the NIH.References
1. Brandes, A.A., et al. Disease progression or pseudoprogression after concomitant radiochemotherapy treatment: Pitfalls in neurooncology. Neuro-Oncology 10, 361-367 (2008).
2. Wen, P.Y., et al. Updated response assessment criteria for high-grade gliomas: response assessment in neuro-oncology working group. J. Clin. Oncol. 28, 1963-1972 (2010).
3. Zhou, J., Heo, H.-Y., Knutsson, L., van Zijl, P.C.M. & Jiang, S. APT-weighted MRI: Techniques, current neuro applications, and challenging issues. J. Magn. Reson. Imaging 50, 347-364 (2019).
4. Zhou, J., et al. Review and consensus recommendations on clinical APT-weighted imaging approaches at 3T: Application to brain tumors. Magn. Reson. Med. 88, 546-574 (2022).
5. Shah, A.H., et al. Discriminating radiation necrosis from tumor progression in gliomas: a systematic review what is the best imaging modality? J. Neuro-Oncol. 112, 141-152 (2013).
6. Ellingson, B.M., Wen, P.Y., van den Bent, M.J. & Cloughesy, T.F. Pros and cons of current brain tumor imaging. Neuro-Oncology 16, 2-11 (2014).
7. Wang, S., et al. Differentiating tumor progression from pseudoprogression in patients with glioblastomas using diffusion tensor imaging and dynamic susceptibility contrast MRI. AJNR Am. J. Neuroradiol. 37, 28-36 (2016).
Figures