0147
Tumor Blood Volume Measurement in Brain Gliomas Using Velocity-Selective Arterial Spin Labeling1Radiology, Zhujiang Hospital of Southern Medical University, Guangzhou, China, 2The Russell H. Morgan Department of Radiology and Radiological Science, Division of MR Research, Johns Hopkins University School of Medicine, Baltimore, MD, United States, 3F.M. Kirby Research Center for Functional Brain Imaging, Kennedy Krieger Institute, Baltimore, MD, USA, Baltimore, MD, United States
Synopsis
Keywords: Tumors, Perfusion
Velocity selective arterial spin labeling (VSASL) has shown comparable CBF measurements in brain gliomas with DSC-PWI. As CBV derived from DSC-PWI is the most widely adopted perfusion marker of brain tumor angiogenesis, the clinical utility for neurooncology imaging of VSASL based CBV quantification worth investigation. This study on preoperative patients with brain gliomas demonstrated that VSASL provided highly correlated quantifications of relative tumor blood volume (R2=0.83) compared to DSC-PWI, and further improved diagnostic performance than VSASL derived relative tumor blood flow measurements (ROC AUC=0.94 vs. 0.89), indicating its potential as a viable non-contrast alternative to DSC-PWI for brain tumor applications.INTRODUCTION
Velocity selective arterial spin labeling (VSASL) has shown comparable cerebral blood flow (CBF) measurements in brain gliomas with dynamic susceptibility contrast perfusion weighted imaging (DSC-PWI)1. As cerebral blood volume (CBV) derived from DSC-PWI is the most widely adopted perfusion measure as a sensitive marker of brain tumor angiogenesis2, the clinical utility for neurooncology imaging of VSASL based CBV quantification3, 4 worth further investigation This study aimed to evaluate the feasibility and performance of VSASL based CBV on preoperative patients with brain gliomas by comparing with VSASL based CBF and DSC-PWI based CBV mapping.METHODS
Consecutive Patients with newly diagnosed brain tumors were recruited to undergo preoperative MRI between Nov. 2017 and Aug. 2021 using a 3T Philips Ingenia scanner. Anatomic MRI, DWI and VSASL-CBV were performed for each subject, with VSASL-CBF and DSC-PWI conducted on subgroups of patients. For both VSASL-CBV4 and VSASL-CBF5 methods, the same 2D multi-slice EPI readout was used with 24 dynamics of label/control, the total duration for each ASL method was 5.0 min.The voxel-wise CBV and CBF quantification of VSASL data was executed in Matlab R2016a (Mathworks Inc, Natick, MA, USA)using standard equations as described in Ref 4, 5.
Three representative 3×3 pixel ROIs were manually chosen from the location of the glioma with the visually identifiable maximal perfusion signal on CBV or CBF maps. The ratio of tumor blood volume (TBV) to CBVWM and tumor blood flow (TBF) to CBFGM, or termed as rTBV or rTBF, were calculated. The maximum value was recorded. The mean values of each variable from two readers were used for further analyses.
Group differences in rTBF or rTBV between low-grade and high-grade glioma were compared with either a student’s t-test or Mann–Whitney U-test as appropriate. The area under the receiver-operating characteristic (ROC) curves were constructed to determine the diagnostic accuracy of perfusion parameters derived from either VSASL or DSC-PWI methods for differentiating low-grade from high-grade glioma. Linear regression and Bland-Altman analyses were performed to evaluate the correlation and agreement of CBV between VSASL and DSC-PWI.
RESULTS
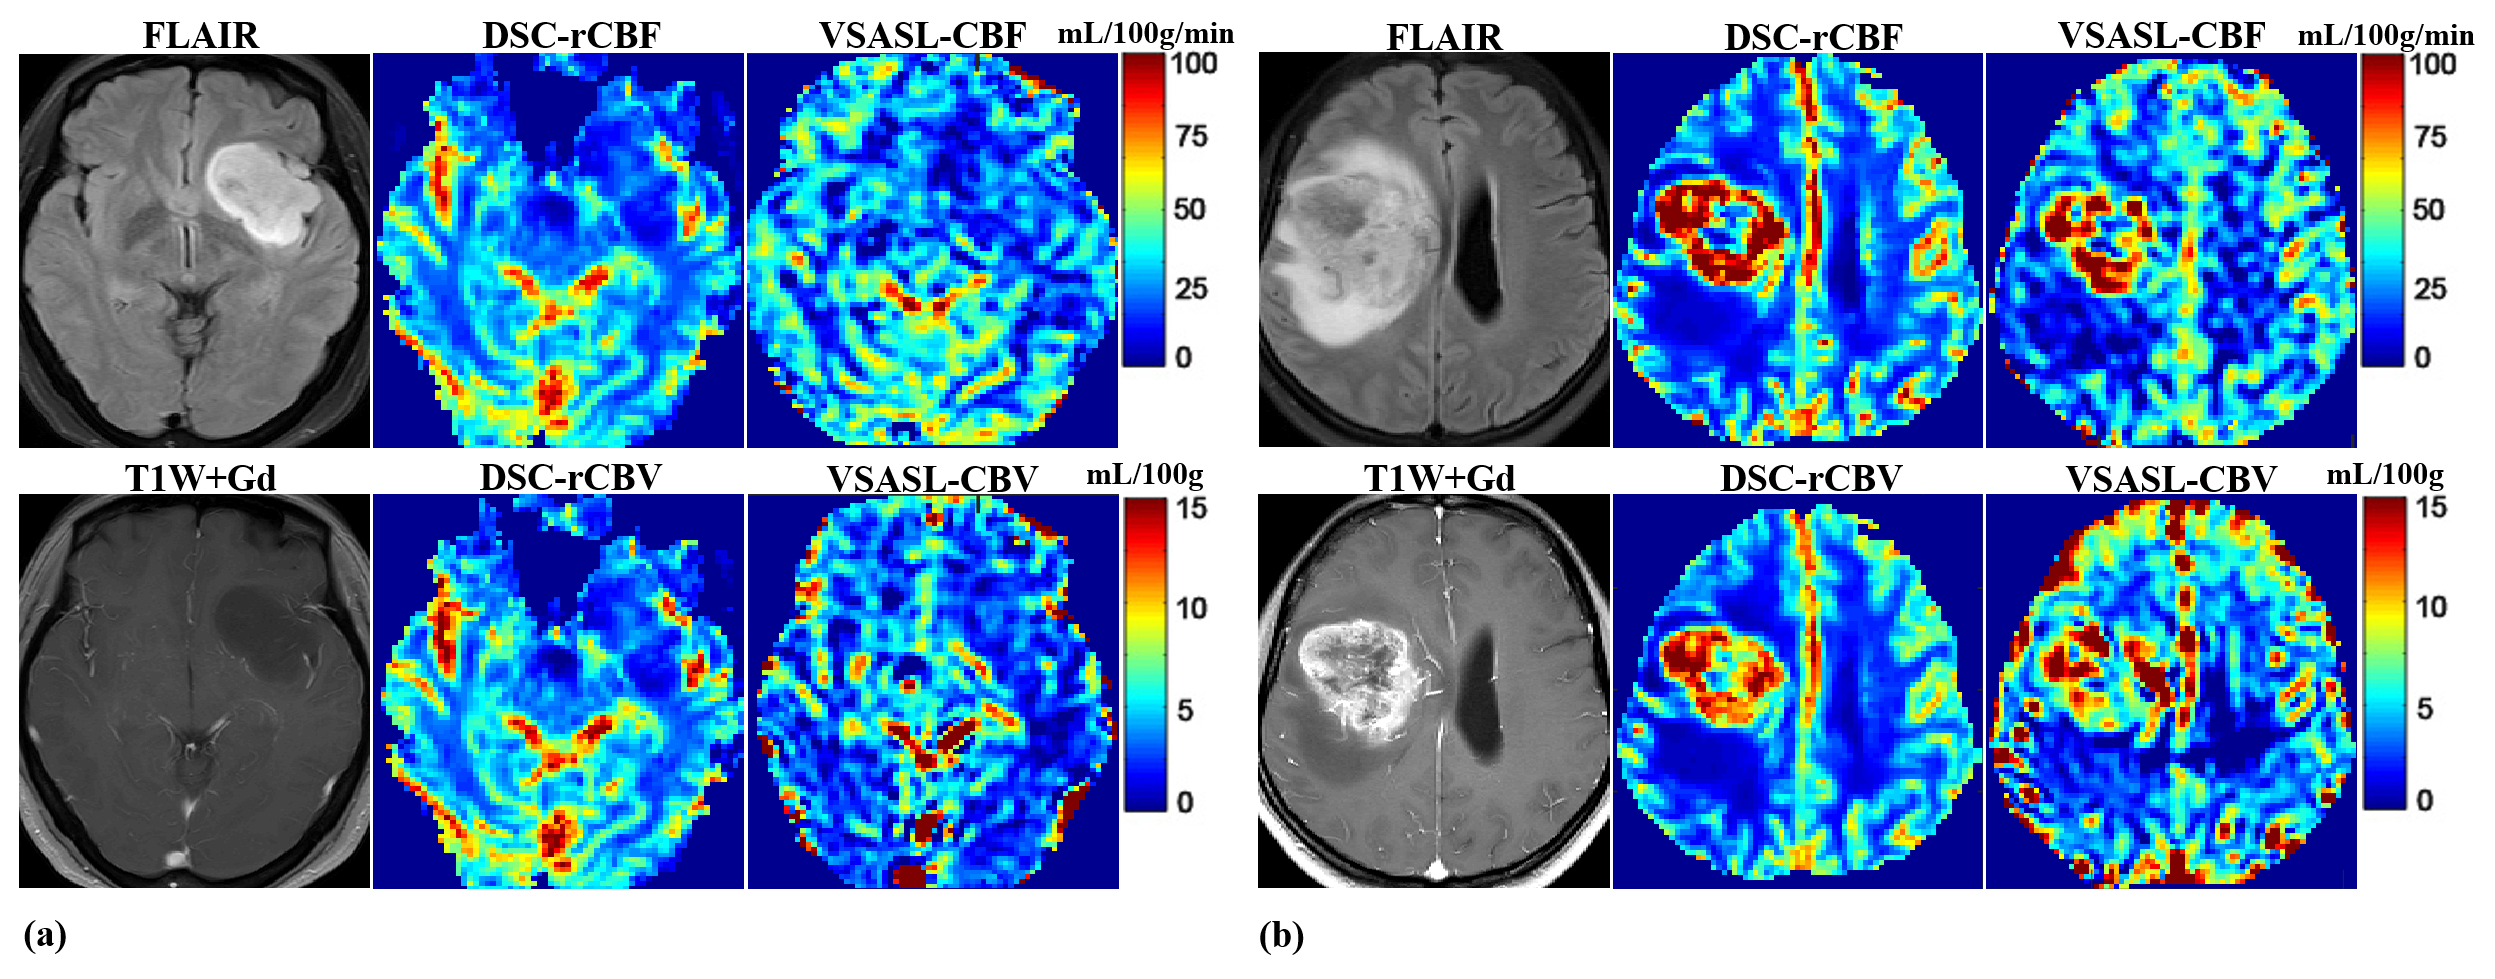
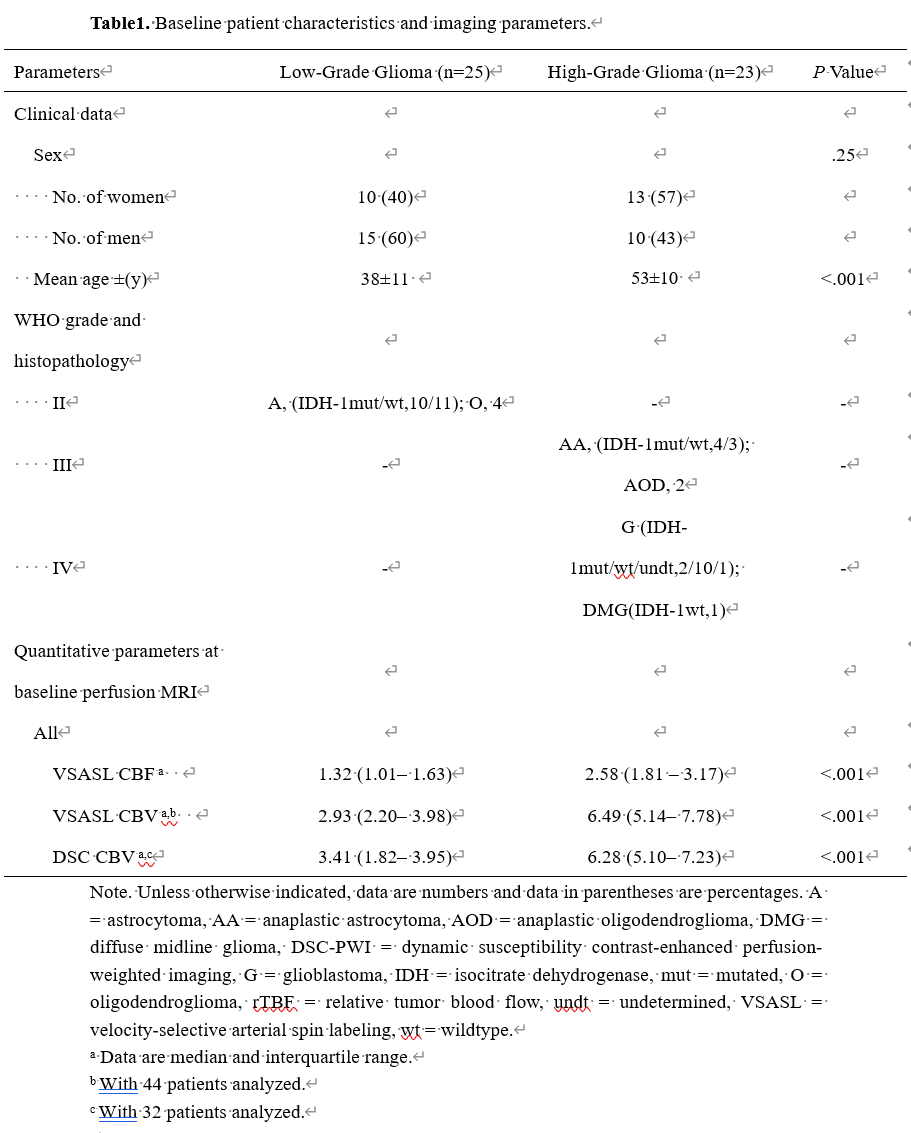
Among the 53 eligible patients, five were excluded due to lack of WHO 4-tier classification (n=1), poor imaging quality (n=3), or corrupt data following post-processing (n=1). 48 patients with untreated glioma were enrolled, including 25 in low-grade glioma (grade II; 38±11yo, 10f/15m) and 23 in high-grade glioma (grade III and IV; 53±10yo, 13f/10m). The histopathology subtypes of different WHO grades and the image characteristics are shown in Table 1. Among these 48 patients with VSASL-CBV images, 32 patients had evaluable DSC-PWI imaging, and 44 had evaluable VSASL-CBF for comparison.Representative images of astrocytoma and glioblastoma are shown in two cases (Fig.1a, b). CBV and CBF maps derived from VSASL and DSC-PWI are largely comparable on visual inspection. As expected, low-grade astrocytoma did not show elevated CBV (Fig.1a), in contrast to glioblastoma with markedly elevated CBV (Fig.1b).
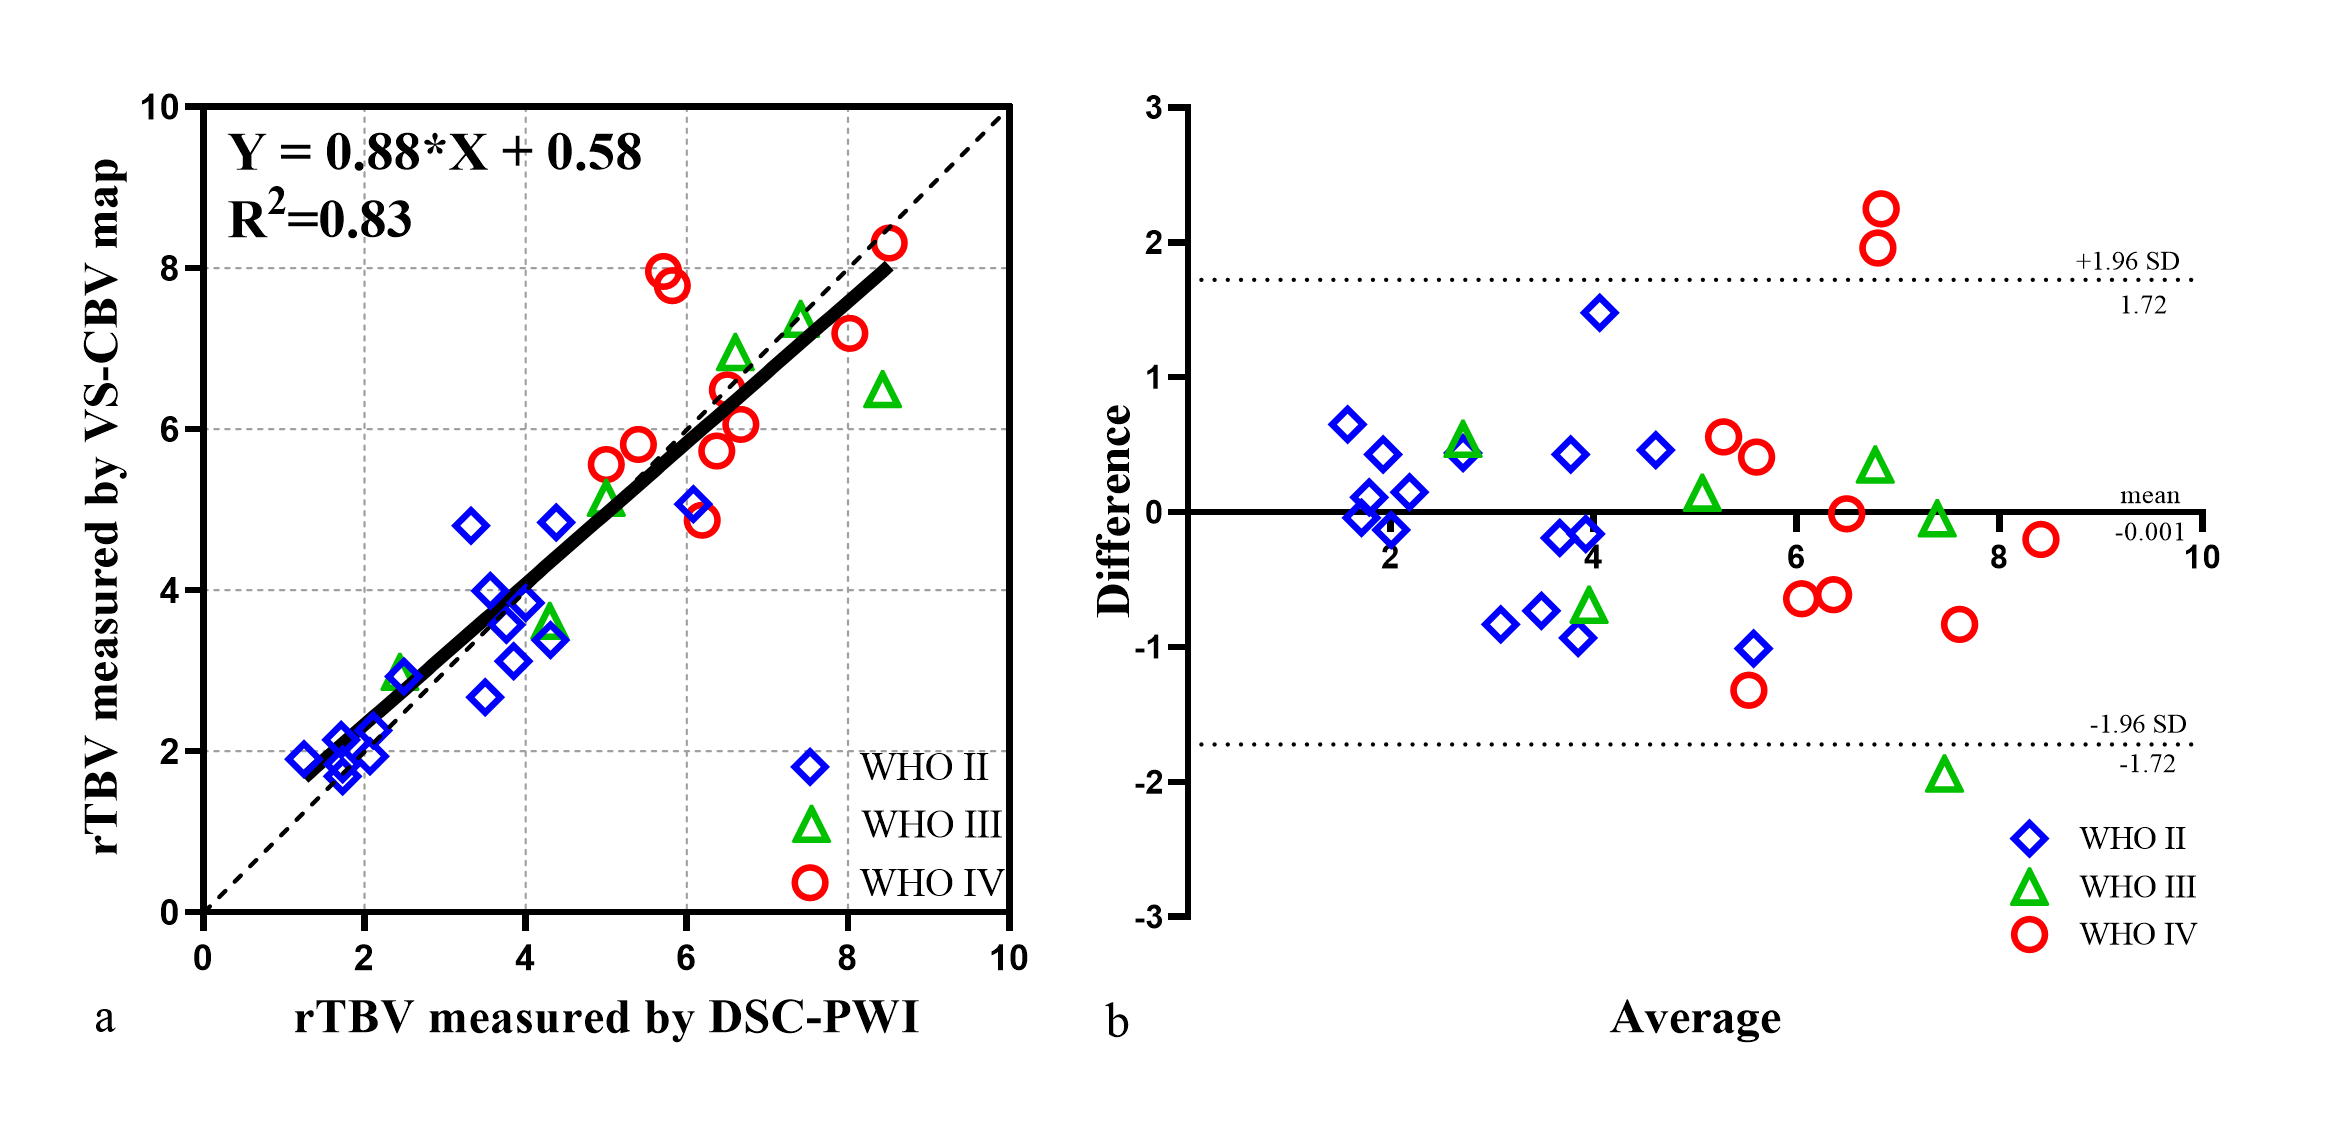
Linear regression analyses between rTBV values of VSASL and DSC-PWI for 32 patients showed high correlation (R2=0.83, Fig.2a). Bland-Altman plots also demonstrated agreement of rTBV between VSASL and DSC-PWI (Fig.2b).
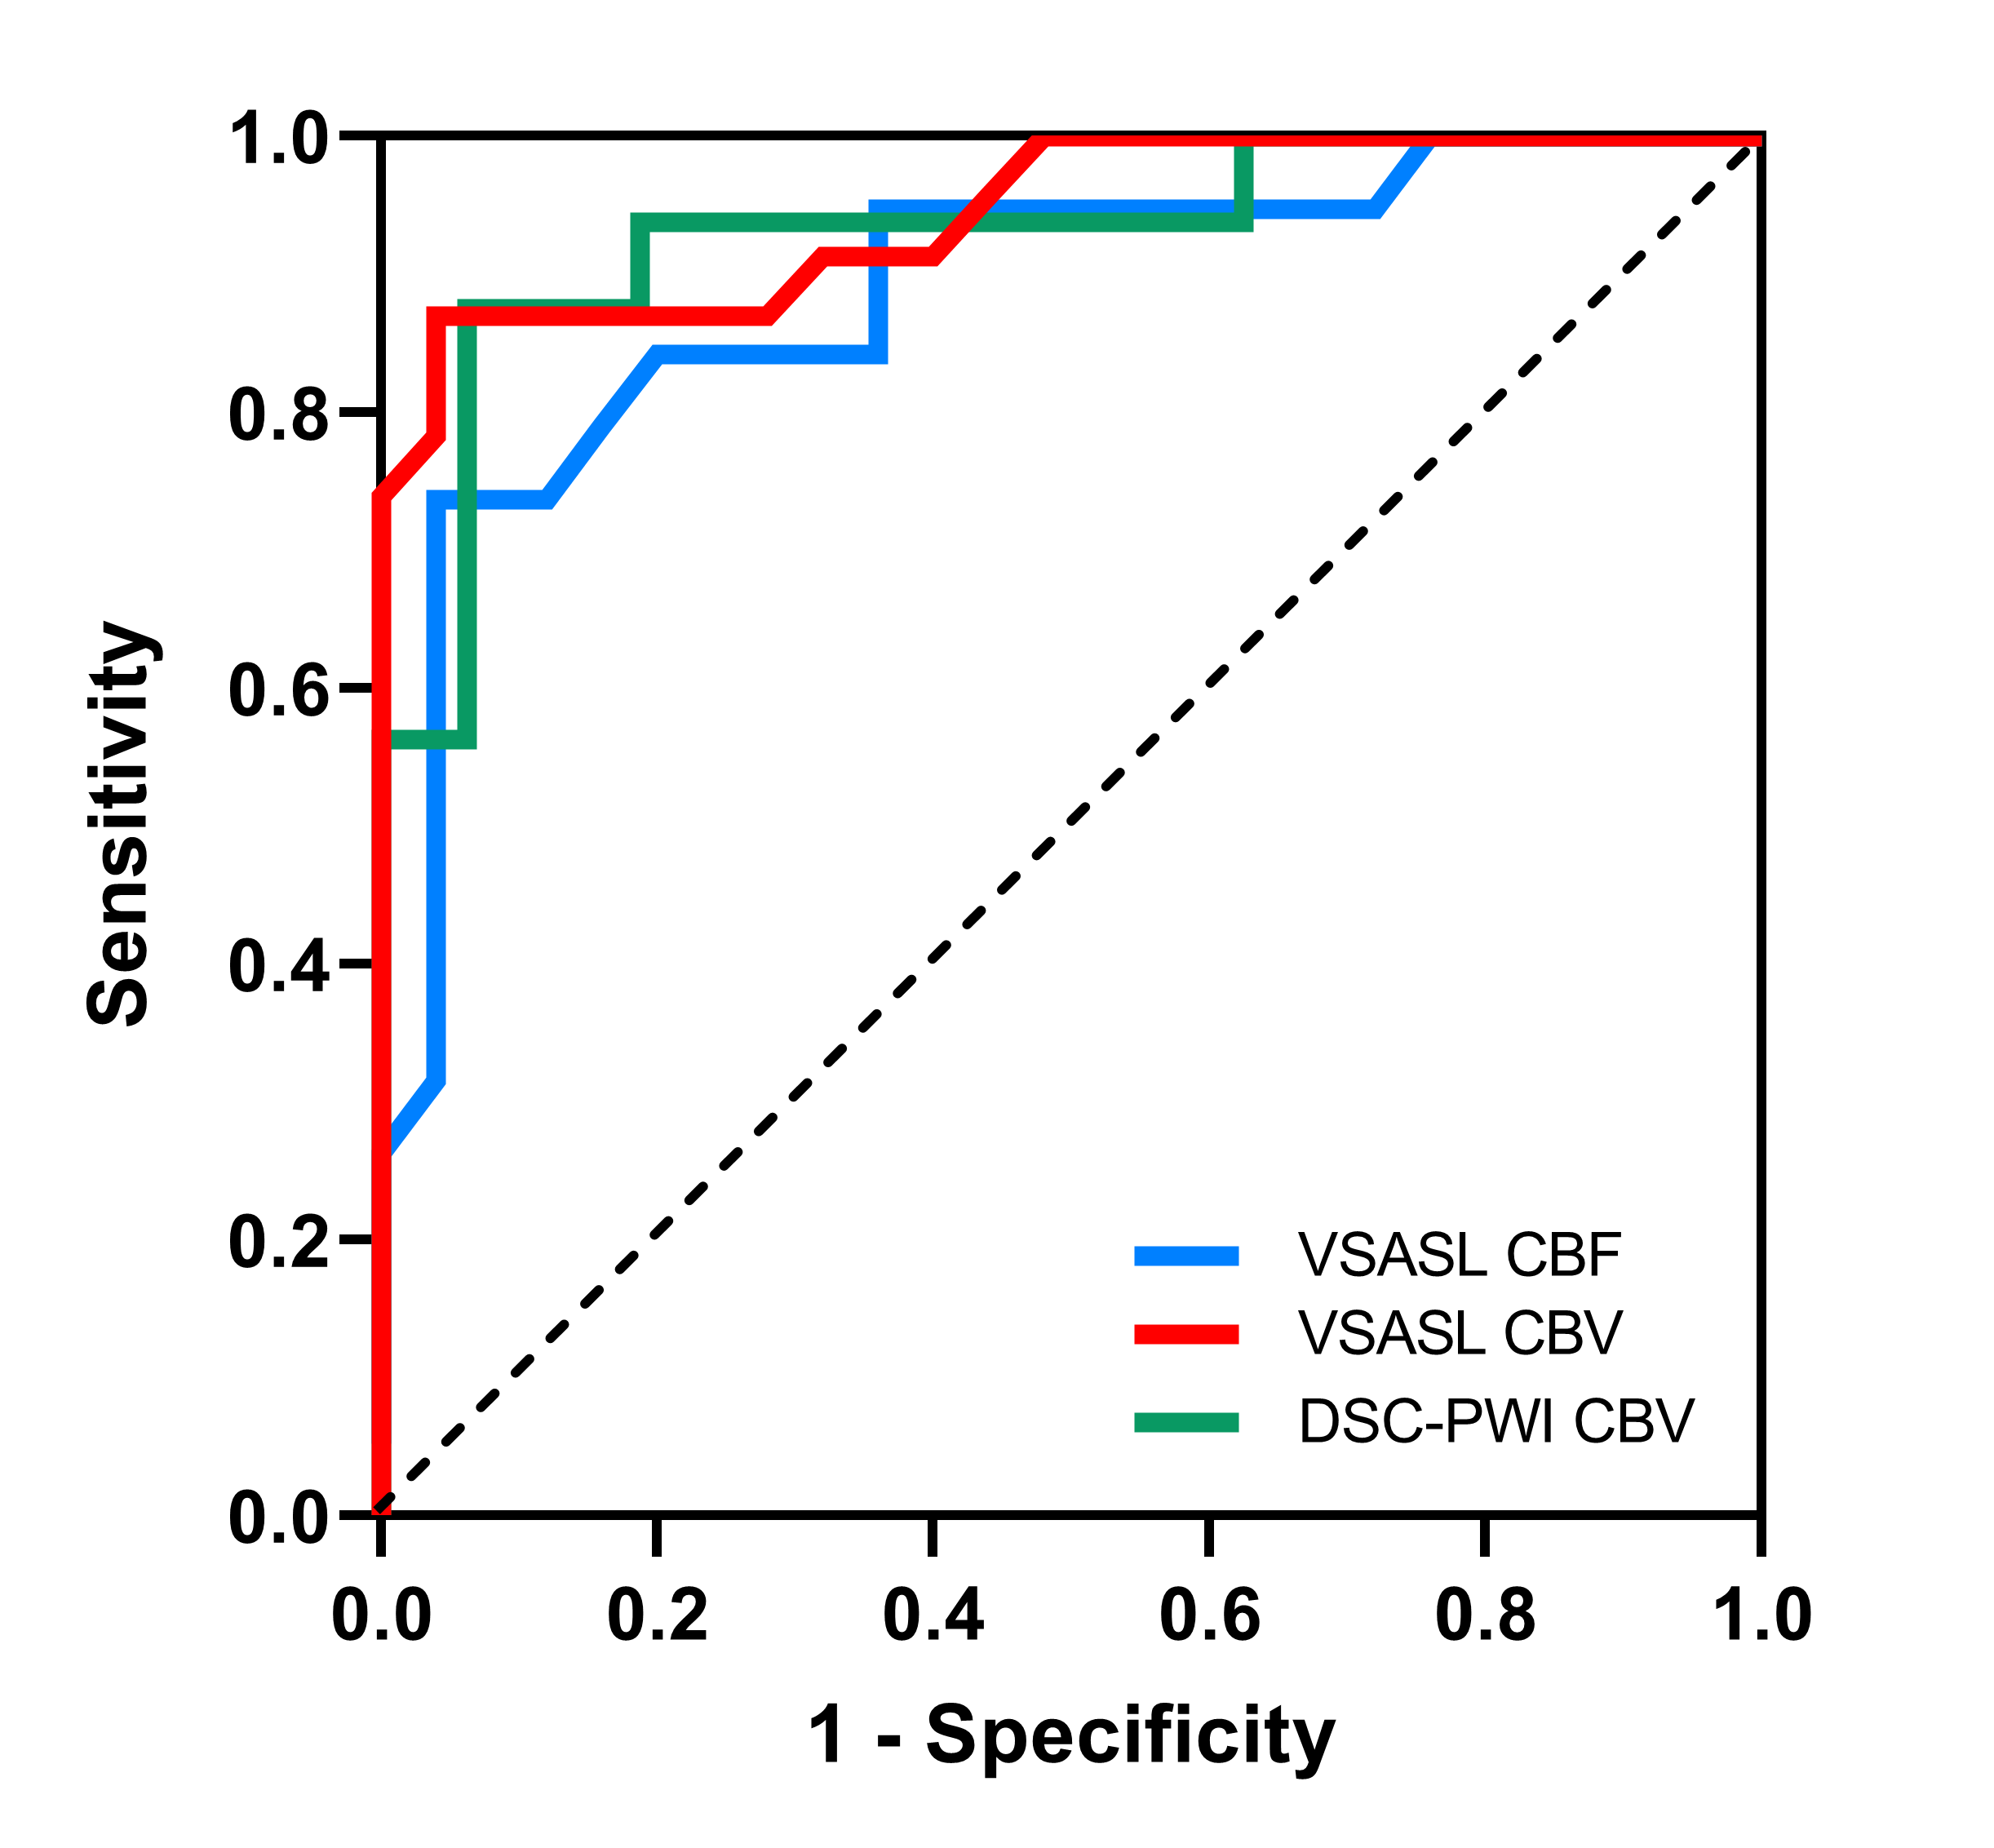
Both VSASL and DSC-PWI derived rTBV, VSASL derived rTBF showed clear distinction between low-grade and high-grade gliomas (Fig.3). The median rTBF and rTBV values in low-grade glioma were all significantly lower than those of high-grade for VSASL-CBF (1.32 vs. 2.58), VSASL-CBV (2.93 vs. 6.49), and DSC-PWI-CBV (3.41 vs. 6.28), P<0.001 (Table 1). The ROC curves showed that VSASL-derived rTBV yielded excellent diagnostic performance in glioma grading with rTBV showing slightly higher accuracy than VSASL-derived rTBF (area under the ROC curve (AUC): 0.94 vs. 0.89) (Fig.4), and comparable with DSC-PWI derived rTBV (AUC: 0.94 vs. 0.93).
DISCUSSION AND CONCLUSION
These results indicate that VSASL provided highly correlated quantifications of relative tumor blood volume when compared to DSC-PWI and further improved diagnostic performance than VSASL derived tumor blood flow measurements. The clinical feasibility of VSASL-CBV will be further tested for brain tumor imaging with 3D acquisition6 for evaluating its potential as a viable non-contrast alternative to the more widely implemented DSC-PWI perfusion methods.Acknowledgements
Thank the colleagues who have paid their efforts in this study.
References
1. Qu Y, Kong D, Wen H, et al. Perfusion measurement in brain gliomas using velocity-selective arterial spin labeling: comparison with pseudo-continuous arterial spin labeling and dynamic susceptibility contrast MRI. Eur Radiol 2022;32:2976-2987.
2. Boxerman JL, Quarles CC, Hu LS, et al. Consensus recommendations for a dynamic susceptibility contrast MRI protocol for use in high-grade gliomas. Neuro Oncol 2020;22:1262-1275.
3. Liu D, Xu F, Lin DD, van Zijl PCM, Qin Q. Quantitative measurement of cerebral blood volume using velocity-selective pulse trains. Magn Reson Med 2017;77:92-101.
4. Qin Q, Qu Y, Li W, et al. Cerebral blood volume mapping using Fourier-transform-based velocity-selective saturation pulse trains. Magn Reson Med 2019;81:3544-3554.
5. Qin Q, van Zijl PC. Velocity-selective-inversion prepared arterial spin labeling. Magn Reson Med 2016;76:1136-1148.
6. Li W, Liu D, van Zijl PCM, Qin Q. Three-dimensional whole-brain mapping of cerebral blood volume and venous cerebral blood volume using Fourier transform-based velocity-selective pulse trains. Magn Reson Med 2021;86:1420-1433.
Figures