0144
An exploration of peritumoral glutamate and glutamine in diffuse gliomas using 7T MRSI1Department of Neurosurgery, Medical University of Vienna, Vienna, Austria, 2High-field MR Center, Department of Biomedical Imaging and Image-guided Therapy, Medical University of Vienna, Vienna, Austria, 3Christian Doppler Laboratory for MR Imaging Biomarkers, Vienna, Austria, 4Division of Neuropathology and Neurochemistry, Department of Neurology, Medical University of Vienna, Vienna, Austria, 5Division of Oncology, Department of Internal Medicine I, Medical University of Vienna, Vienna, Austria, 6Division of Neuroradiology and Musculoskeletal Radiology, Department of Biomedical Imaging and Image-guided Therapy, Medical University of Vienna, Vienna, Austria, 7Medical Image Analysis und AI, Danube Private University, Krems, Austria
Synopsis
Keywords: Tumors, Spectroscopy
Research indicates that glutamate (Glu) and glutamine (Gln) play a role in the infiltrative properties of diffuse gliomas. Overcoming limitations of previous MRSI techniques, our 7T MRSI approach allows high-resolution Glu imaging. We investigated intra- and peritumoral Glu and Gln in a cohort of 36 patients and found significant increases in peritumoral Glu/tNAA, Gln/tNAA, Glu/tCr, and Gln/tCr compared to a NAWM control region. We established peritumoral Dice similarity coefficients of 0.67 for Glu/tNAA and Gln/tNAA compared to 0.31 for tCho/tNAA.
Our results that Glu/Gln imaging could investigate the metabolism of infiltrative gliomas.
Introduction
Diffuse Gliomas are the most common and most malignant brain tumours1. Their high morbidity and mortality2 originate from their infiltrative growth into surrounding brain parenchyma that makes treatment such as resection exceedingly difficult. The most recent WHO classification3 has put emphasis on molecular properties of gliomas which cause metabolic alterations such as the production of 2-hydroxyglutarate (2HG) in isocitrate dehydrogenase-mutations (IDH). Currently, the recognised classes of gliomas are “astrocytoma, IDH-mutant”, “oligodendroglioma, IDH-mutant, and 1p/19q-codeleted”, and “glioblastoma, IDH-wildtype”.Presurgical delineation of the infiltration zone to allow a maximum safe resection is difficult using structural MRI. Metabolic imaging, such as PET or MRSI adds information, but is limited to few molecules, e.g., PET tracers, choline/N-acetyl-aspartate-ratios (tCho/tNAA) and 2HG. More recent research has also cast light on the role of the neurotransmitter glutamate (Glu) and the related amino-acid glutamine (Gln) in glioma progression4. Infiltrating glioma cells release intercellular Glu, which might become cytotoxic5–7 as they develop glutamatergic neurogliomal synapses to drive further infiltration8,9. Additional connections between Glu and metabolic pathways, infiltration, IDH-status, and epileptogenesis are not yet fully understood10–12.
MRS has been used to investigate Glu in gliomas in rare studies13,14 but is limited by spatial resolution and the ability to separate Glu from Gln. We have developed a 7T MRSI technique able to deliver high-resolution Glu maps17,19, specifically in high-grade-gliomas, unravelling Glu heterogeneity within tumours17,18 and discovered that intratumoral Gln/tNAA hotspots better correspond to PET results than tCho/tNAA20.
We hypothesise that 7T MRSI detects peritumoral changes in Glu that differ from Gln and tCho. Such changes could be the basis for further research on the role of Glu in glioma infiltration and epileptogenesis.
Methods
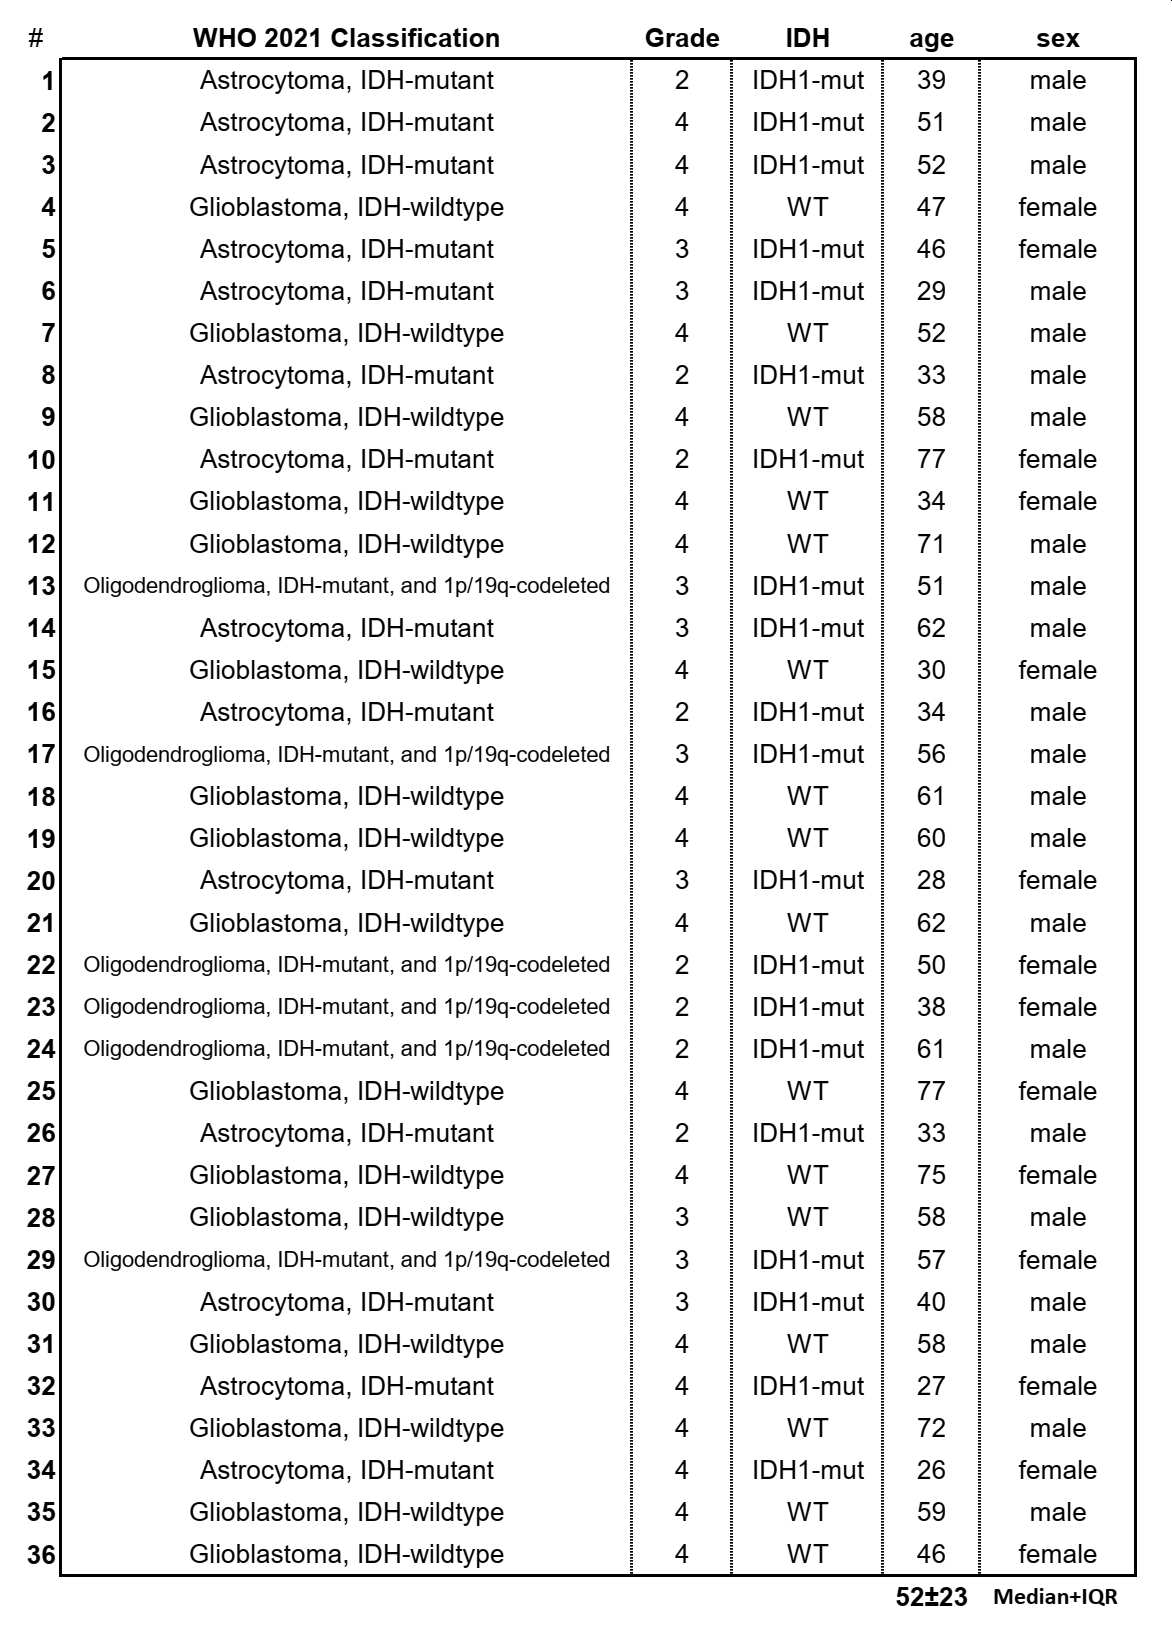
This study retrospectively evaluated 7T MRSI data of a cohort of 36 glioma patients (Figure 1). After IRB approval and with informed consent (inclusion: suspected glioma, age ≥18, Karnofsky-index ≥70; exclusion: claustrophobia, pregnancy, breastfeeding, and ferromagnetic implants) scans were conducted using a 7T scanner (Siemens Healthineers) with a 32-channel receive head coil (Nova Medical)17,18. In 15 minutes, an MRSI matrix of 64×64×39 with 3.4 mm nominal isotropic resolution was acquired and processed using an in-house pipeline including LCmodel. We evaluated the resulting relative metabolite quantities and a tumour segmentation (TU) based on clinical 3T MRI using a python pipeline. As a first step, a normal-appearing white matter (NAWM) control ROI derived and a peritumoral region (PT) encompassing the brain in a 2 cm / 6 voxel radius were defined. From this PT-ROI, GM-voxels were subtracted as the inclusion of higher-Glu GM would impact a comparison to NAWM.A first analysis looked at the differences in the median ratios of Glu/tNAA, Gln/tNAA, tCho/tNAA, Glu/tCr, and Gln/tCr between the ROIs of TU, PT, and NAWM using paired two-sided t-tests.
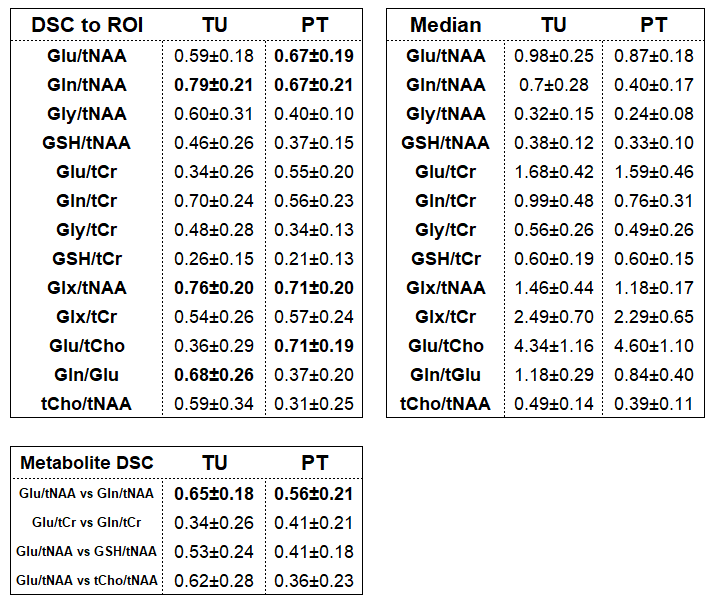
A second analysis determined Dice similarity coefficients (DSC, to the ROI) and median values and for hotspots (>1.5 of NAWM median) of the metabolite ratios described in Figure 2 in the TU and PT ROIs. Additionally, DSCs between Glu/tNAA-Gln/tNAA, Glu/tCr-Gln/tCr, Glu/tNAA-glutathione(GSH)/tNAA, Glu/tNAA-tCho/tNAA, were determined.
A third analysis was focused on correlations between tumor grade, IDH status, age, sex, and tumour classification and ratio medians, with correlation coefficients <-0.5 or >0.5 as relevant findings.
Results
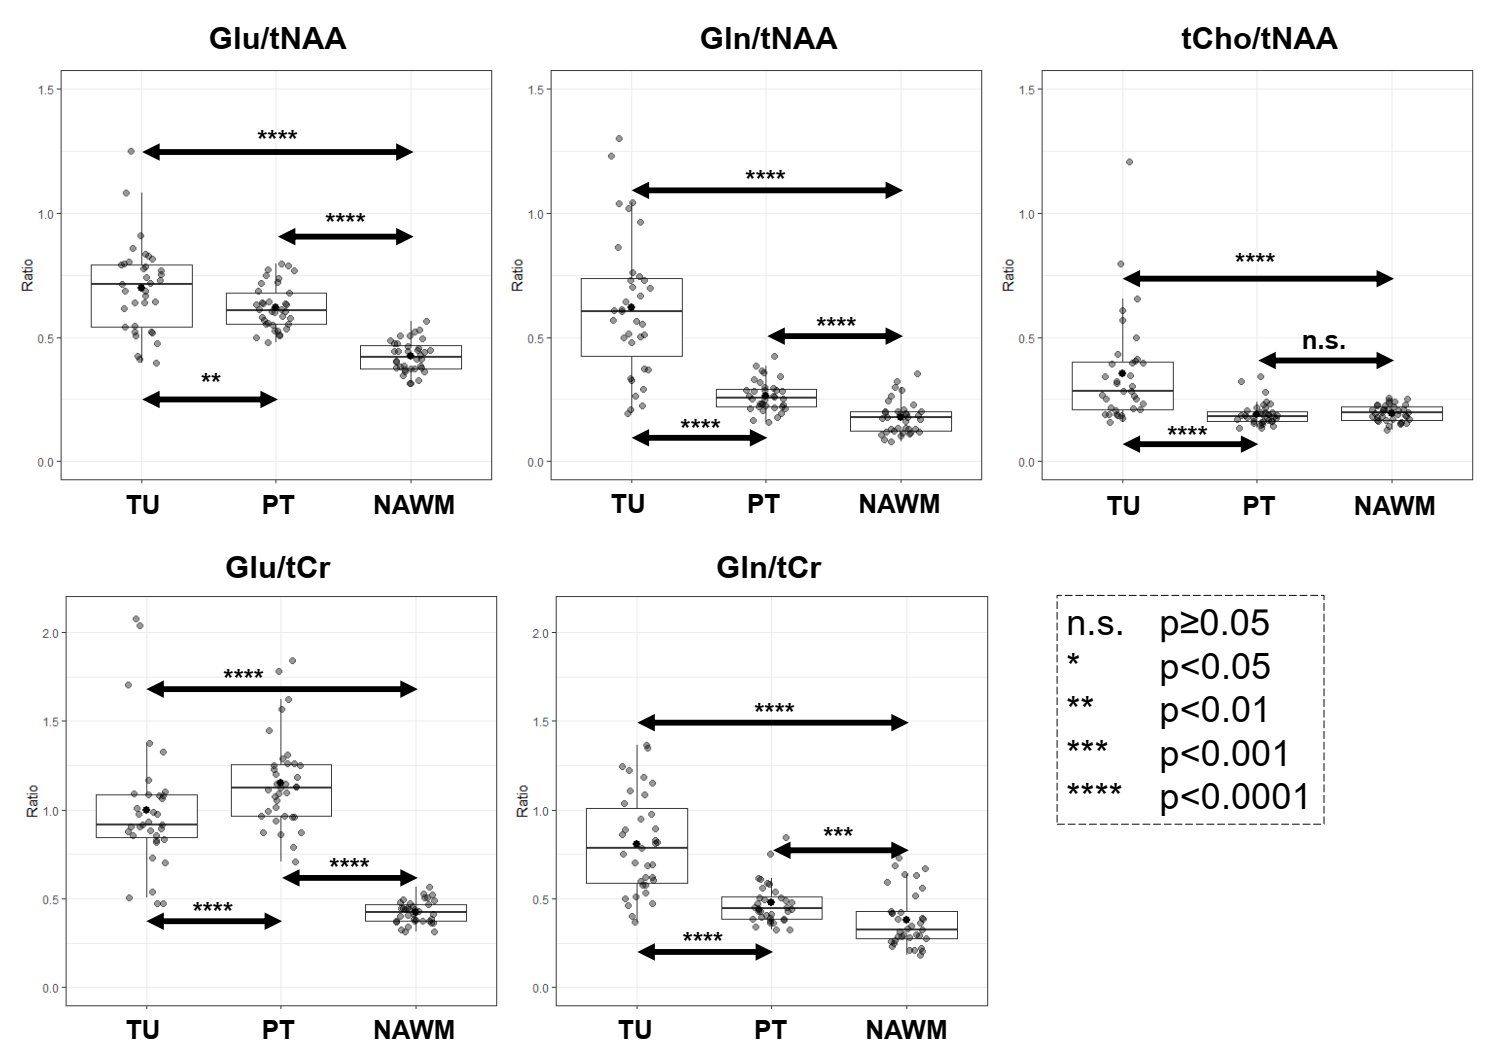
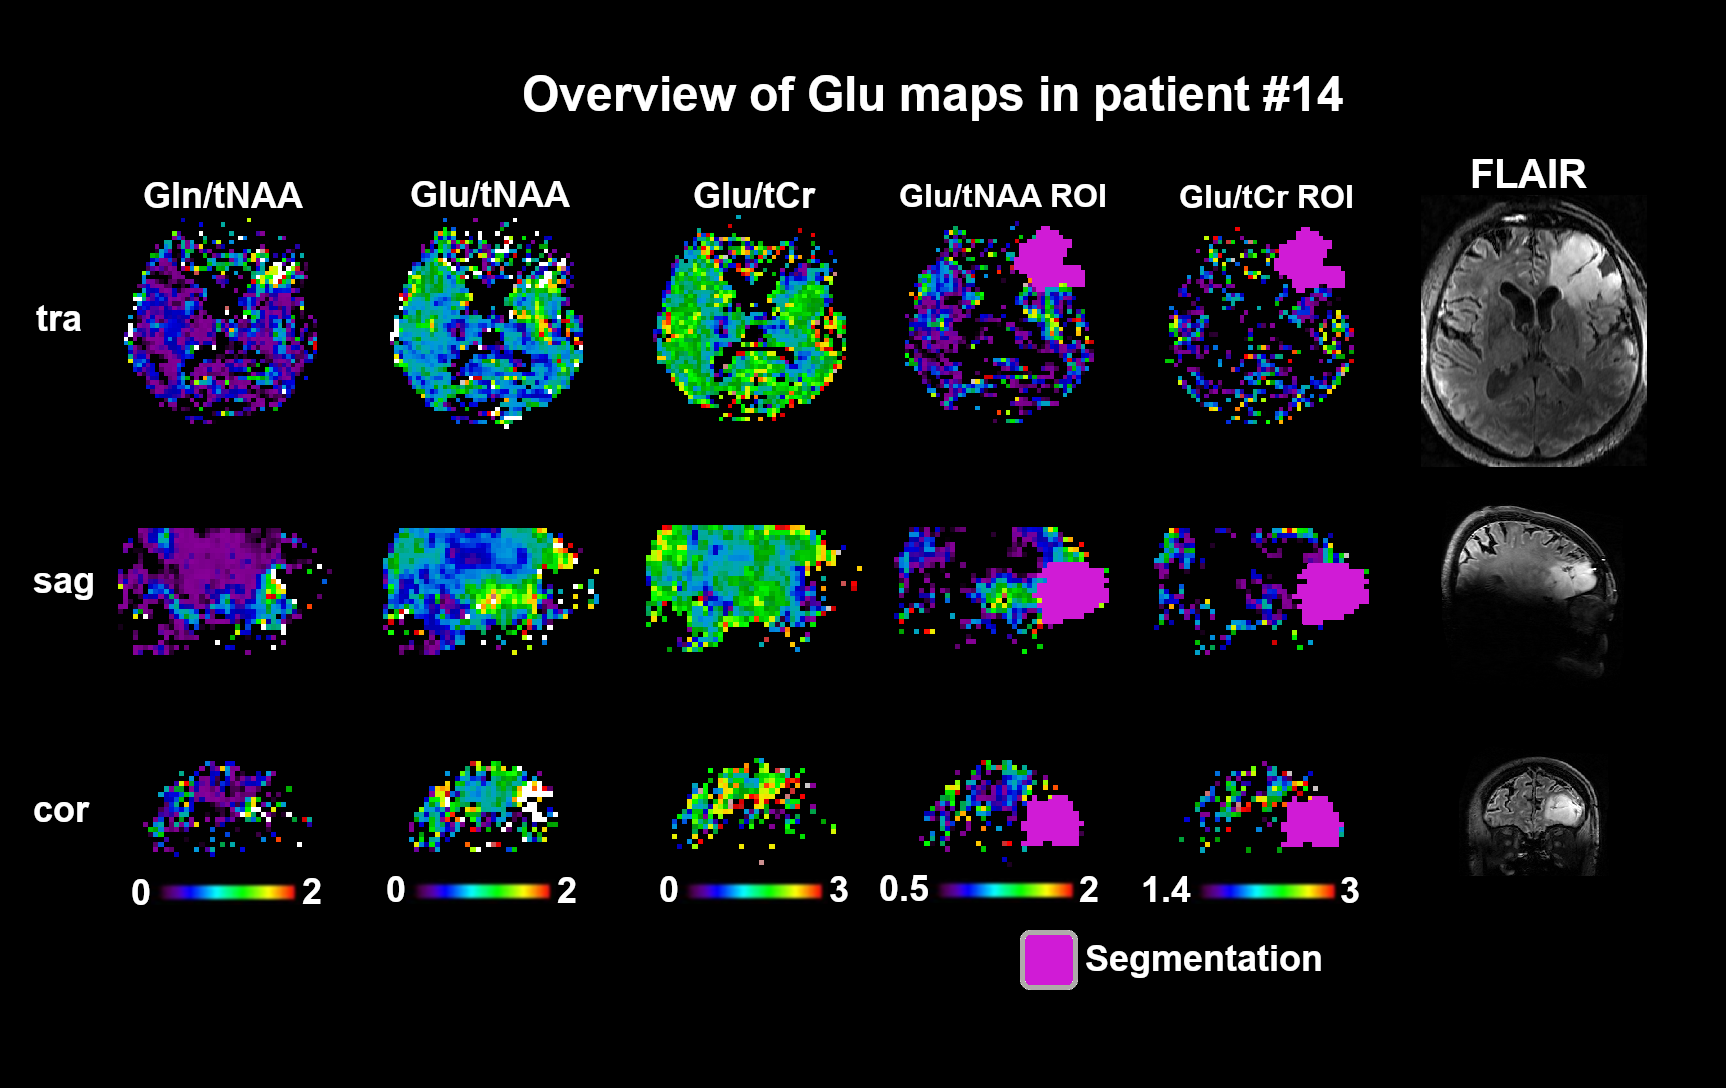
As summarised in Figure 3, for Glu/tNAA, Gln/tNAA, Glu/tCr, and Gln/tCr, all differences were statistically significant (most so for Glu/tCr PT vs NAWM), while for tCho/tNAA only the differences of TU to PT and TU to NAWM were significant.For the DSCs, as expected from our previous work, in TU, Gln ratio DSCs were the highest. In PT, Glu and Gln ratios resulted in similar DSCs, while the highest DSCs were Glx/tNAA and Glu/tCho with 0.71. With DSCs of 0.56 and 0.41, the overlap of Glu and Gln ratios to tNAA and to tCr was limited. Gly and GSH hotspots featured lower DSCs than those for Glu. Hotspot median values for Glu ratios were higher in the PT. Figure 4 shows map examples in one patient.
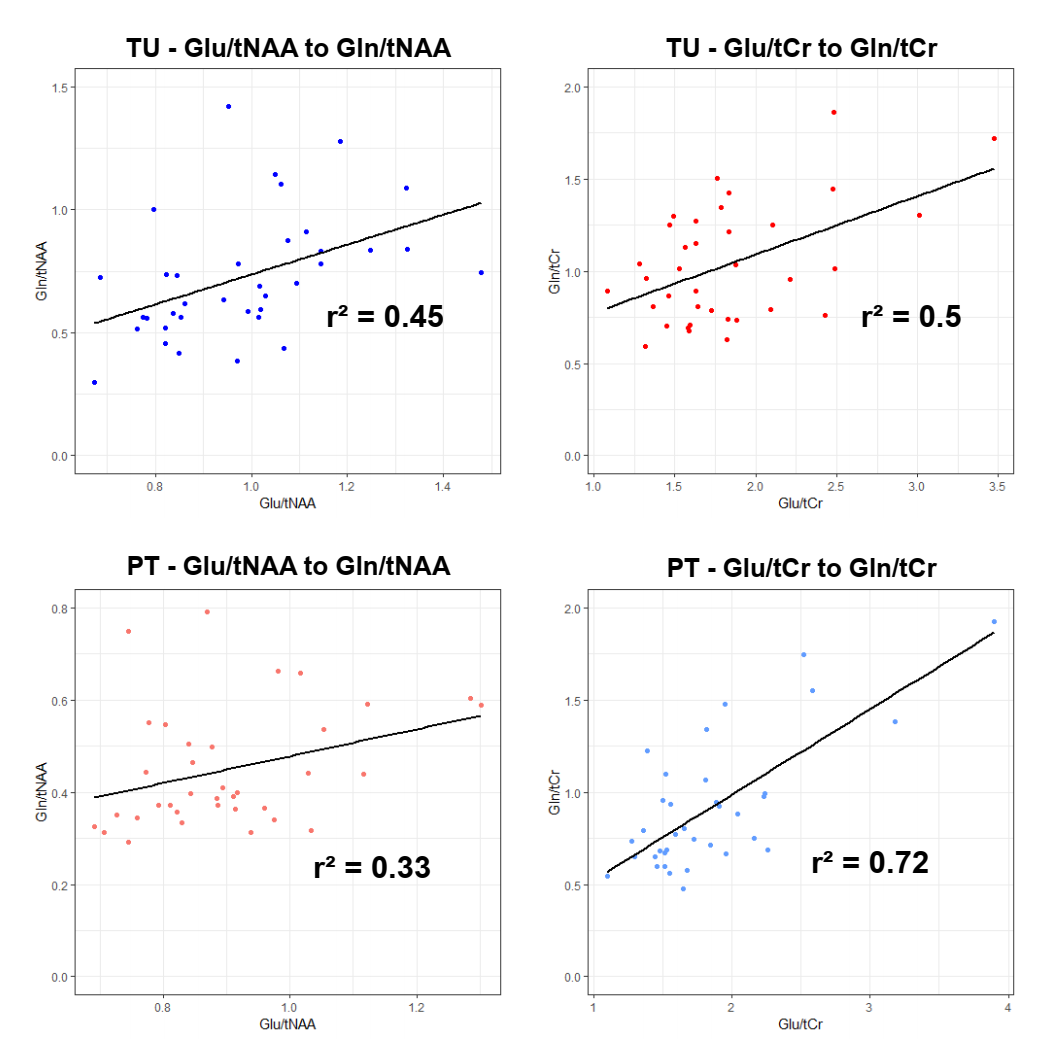
We found the expected correlation of -0.70 between IDH mutation and tumour grade, but no correlations for the hotspot ROIs. For the un-thresholded medians, Glx/tCr correlated with 0.53 to IDH-wildtype as well as grade. Glu/tCr and Gln/tCr correlated with age (0.57 and 0.58). Figure 5 shows that there is a moderate amount of correlation for Glu and Gln ratios, but the PT difference between ratios to tNAA and tCr shows the strong effects of divisor choice on MRSI ratio evaluation.
Discussion and Conclusions
For the first time, we demonstrated significant increases of imaged peritumoral Glu and Gln ratios derived from 7T MRSI compared to NAWM. Additionally, both metabolites defined larger peritumoral ROIs than the clinical reference tCho/tNAA. While hotspot sizes were similar, they did only partially overlap. These results demonstrate that Glu/Gln distributions may play a potential role in investigating peritumoral regions in diffuse gliomas for improved detection/identification of infiltration/edema/progression. These findings may contribute to better treatment planning and progress monitoring in diffuse gliomas.Cohort size and a lack of verification by direct tissue sample limit our study as well as the lack of concentration estimation in tumoral tissues.
We conclude that 7T MRSI-based peritumoral Glu/Gln imaging may be used to investigate the glioma infiltration.
Acknowledgements
This study was supported by the Austrian Science Fund (FWF) projects KLI-646 FW and KLI 1089-B as well as a 2021 Comprehensive Cancer Center grant of the Medical University of Vienna.References
1. Ostrom QT, Cote DJ, Ascha M, Kruchko C, Barnholtz-Sloan JS. Adult Glioma Incidence and Survival by Race or Ethnicity in the United States From 2000 to 2014. JAMA Oncol. 2018;4(9):1254. doi:10.1001/jamaoncol.2018.1789
2. Wen PY, Kesari S. Malignant Gliomas in Adults. N Engl J Med. 2008;359(5):492-507. doi:10.1056/NEJMra0708126
3. Louis DN, Perry A, Wesseling P, et al. The 2021 WHO Classification of Tumors of the Central Nervous System: a summary. Neuro-Oncol. 2021;23(8):1231-1251. doi:10.1093/neuonc/noab106
4. Yao PS, Kang DZ, Lin RY, Ye B, Wang W, Ye ZC. Glutamate/glutamine metabolism coupling between astrocytes and glioma cells: Neuroprotection and inhibition of glioma growth. Biochem Biophys Res Commun. 2014;450(1):295-299. doi:10.1016/j.bbrc.2014.05.120
5. So JS, Kim H, Han KS. Mechanisms of Invasion in Glioblastoma: Extracellular Matrix, Ca2+ Signaling, and Glutamate. Front Cell Neurosci. 2021;15:663092. doi:10.3389/fncel.2021.663092
6. Noch E, Khalili K. Molecular mechanisms of necrosis in glioblastoma: The role of glutamate excitotoxicity. Cancer Biol Ther. 2009;8(19):1791-1797. doi:10.4161/cbt.8.19.9762
7. Maus A, Peters GJ. Glutamate and α-ketoglutarate: key players in glioma metabolism. Amino Acids. 2017;49(1):21-32. doi:10.1007/s00726-016-2342-9
8. Venkataramani V, Tanev DI, Strahle C, et al. Glutamatergic synaptic input to glioma cells drives brain tumour progression. Nature. 2019;573(7775):532-538. doi:10.1038/s41586-019-1564-x
9. Tabatabaee M, Menard F. Glutamate Signaling and Filopodiagenesis of Astrocytoma Cells in Brain Cancers: Survey and Questions. Cells. 2022;11(17):2657. doi:10.3390/cells11172657
10. Lange F, Hörnschemeyer J, Kirschstein T. Glutamatergic Mechanisms in Glioblastoma and Tumor-Associated Epilepsy. Cells. 2021;10(5):1226. doi:10.3390/cells10051226
11. Hujber Z, Horváth G, Petővári G, et al. GABA, glutamine, glutamate oxidation and succinic semialdehyde dehydrogenase expression in human gliomas. J Exp Clin Cancer Res. 2018;37(1):271. doi:10.1186/s13046-018-0946-5
12. Ravi VM, Will P, Kueckelhaus J, et al. Spatially resolved multi-omics deciphers bidirectional tumor-host interdependence in glioblastoma. Cancer Cell. 2022;40(6):639-655.e13. doi:10.1016/j.ccell.2022.05.009
13. Nagashima H, Sasayama T, Tanaka K, et al. Myo-inositol concentration in MR spectroscopy for differentiating high grade glioma from primary central nervous system lymphoma. J Neurooncol. 2018;136(2):317-326. doi:10.1007/s11060-017-2655-x
14. Nguyen HD, Diamandis P, Scott MS, Richer M. Deciphering of Adult Glioma Vulnerabilities through Expression Pattern Analysis of GABA, Glutamate and Calcium Neurotransmitter Genes. J Pers Med. 2022;12(4):633. doi:10.3390/jpm12040633
15. Autry AW, Lafontaine M, Jalbert L, et al. Spectroscopic imaging of D-2-hydroxyglutarate and other metabolites in pre-surgical patients with IDH-mutant lower-grade gliomas. J Neurooncol. 2022;159(1):43-52. doi:10.1007/s11060-022-04042-3
16. Hashiguchi M, Tanaka K, Nagashima H, et al. Glutamic Acid and Total Creatine as Predictive Markers for Epilepsy in Glioblastoma by Using Magnetic Resonance Spectroscopy Before Surgery. World Neurosurg. 2022;160:e501-e510. doi:10.1016/j.wneu.2022.01.056
17. Hingerl L, Strasser B, Moser P, et al. Clinical High-Resolution 3D-MR Spectroscopic Imaging of the Human Brain at 7 T: Invest Radiol. 2020;55(4):239-248. doi:10.1097/RLI.0000000000000626
18. Hangel G, Cadrien C, Lazen P, et al. High-resolution metabolic imaging of high-grade gliomas using 7T-CRT-FID-MRSI. NeuroImage Clin. 2020;28:102433. doi:10.1016/j.nicl.2020.102433
19. Hangel G, Spurny‐Dworak B, Lazen P, et al. Inter‐subject stability and regional concentration estimates of 3D‐FID‐MRSI in the human brain at 7 T. NMR Biomed. 2021;34(12). doi:10.1002/nbm.4596
20. Hangel G, Lazen P, Sharma S, et al. 7T HR FID-MRSI Compared to Amino Acid PET: Glutamine and Glycine as Promising Biomarkers in Brain Tumors. Cancers. 2022;14(9):2163. doi:10.3390/cancers14092163
Figures