0143
Probing Tumor Heterogeneity in Mouse Glioblastoma with Dynamic Glucose-Enhanced Deuterium Metabolic Imaging1Champalimaud Research, Champalimaud Foundation, Lisbon, Portugal, 2(Present Address) Preclinical MRI, Institute for Research & Innovation in Health (i3S), Porto, Portugal, 3Center of Functionally Integrative Neuroscience (CFIN) and MINDLab, Department of Clinical Medicine, Aarhus University, Aarhus, Denmark, 4Department of Physics and Astronomy, Aarhus University, Aarhus, Denmark
Synopsis
Keywords: Tumors, Deuterium, glioma
Dynamic glucose-enhanced deuterium MRS (DGE 2H-MRS) coupled with Marchenko-Pastur PCA (MPPCA) denoising has been recently applied to immunocompetent mouse glioblastoma subtypes (GL261 and CT2A), demonstrating the ability to measure glucose metabolism through glycolysis and mitochondrial oxidation non-invasively, and its association with tumor proliferation. Here, we extend this approach to DGE Deuterium Metabolic Imaging (DGE-DMI) coupled with tensor MPPCA (tMPPCA) denoising, to map glucose fluxes in the same mouse models of glioblastoma. Our results demonstrate a strong association between glycolytic rates and MRI and histologic features of inter/intra-tumor heterogeneity.INTRODUCTION
Glioblastoma (GBM) are aggressive brain tumors with poor prognosis, largely due to their intrinsic heterogeneity and lack of non-invasive methods to assess it [1]. To address this gap, dynamic glucose-enhanced deuterium spectroscopy (DGE 2H-MRS) was previously harnessed with Marchenko-Pastur Principal Component Analysis (MPPCA) denoising [2-4], demonstrating its ability to differentially quantify glucose turnover rates through glycolysis and mitochondrial oxidation in mouse glioblastoma, and modulation of these pathways fluxes in vivo according to tumor cell proliferation [5]. Here, we expand this approach to DGE Deuterium Metabolic Imaging (DGE-DMI) [6, 7] coupled with tensor MPPCA (tMPPCA) denoising [8]. Thus, we investigate for the first time the links between glucose metabolic fluxes and heterogeneity features of the tumor microenvironment and its surrounding tissues in mouse glioblastoma.METHODS
GBM tumors in vivo and post-mortemAll animal experiments were preapproved by institutional and national authorities, and carried out according to European Directive 2010/63. GBM tumors were induced in immunocompetent C57BL6/j mice by intracranial stereotactic injection of 1E5 glioma cells (GL261, n=5; or CT2A, n=5) in the caudate nucleus [9]. The animals were monitored for tumor growth at 1 T (Bruker Icon) and studied 2-6 weeks post-inoculation at 9.4 T (Bruker BioSpec), using a customized 2H/1H transmit-receive surface coilset (NeosBiotec). Fasted mice (4-6h) were cannulated in the tail vein and placed in the animal holder (1-2% isoflurane in 29% O2; rectal temperature 36-37ºC; breathing 60-80BPM. DGE-DMI was acquired with slice-FID CSI (10kHz SLR excitation pulse, 55º flip angle, 2.27 slice thickness, with final in-plane resolution 560×560 µm2, 175ms TR, 256 complex points, BW=1749 Hz), following a 6,6′-2H2-glucose i.v. bolus injection (2 g/Kg). Each animal further underwent T2-w (RARE: 3s TR, 40ms TE, Turbo-8, 1mm slice thickness, 70×70 µm2 resolution) and DCE-T1 MRI (FLASH: 8º flip-angle, 16ms TR, 2.27mm slice thickness, 140×140 µm2 resolution; Gd-DOTA i.v. bolus, 0.1 mmol/Kg), to assess tumor volume and tissue perfusion, respectively. Finally, animals were sacrificed, the brains were removed, washed in PBS and immersed in 4% PFA until paraffin embedding, 1 week later. Samples were sectioned for histology and digitalization.
Data analyses
DGE-DMI data were processed in MATLABR R2018b and jMRUI 6.0b. This included tMPPCA denoising [8] and spectral quantification using AMARES and DHO reference (natural abundance) [5], with quality control based on Cremer-Rao Lower Bounds (<50%) and SNR of the initial DHO peak (SNRi >3). Data were analyzed voxel-wise with kinetic modeling to generate glucose flux maps through glycolysis (glucose-to-lactate) and mitochondrial oxidation (glucose-to-glutamine-glutamate), as recently reported [5]; additionally, average concentration maps [10] were generated for glucose, lactate, and glutamine-glutamate. DCE T1-MRI data were analyzed with DCE@urLab [11], using the Extended Tofts model to derive tissue perfusion (ktrans). Histopathological analyses (H&E staining) were performed independently by an experimental pathologist, and semi-automated cell counting performed on immunostained sections (ki67) with QuPath 0.2.3, as before [5]. Groups were compared using the two-tailed Student’s t-test, and correlation analyses performed with the Pearson R coefficient.
RESULTS
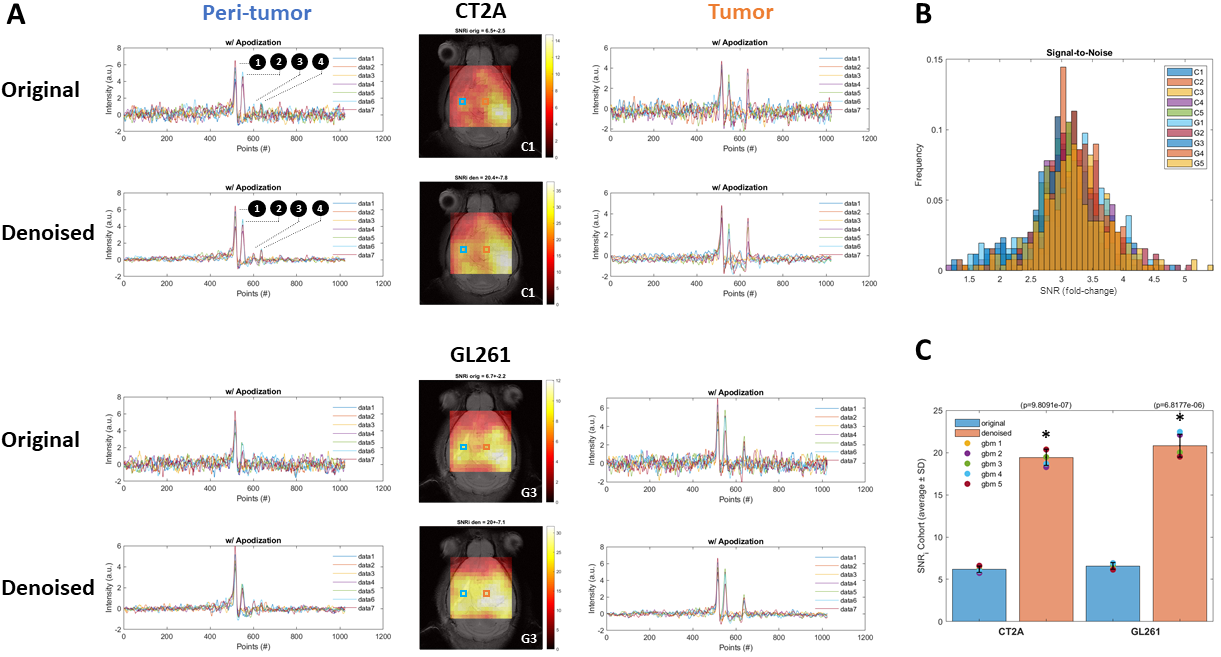
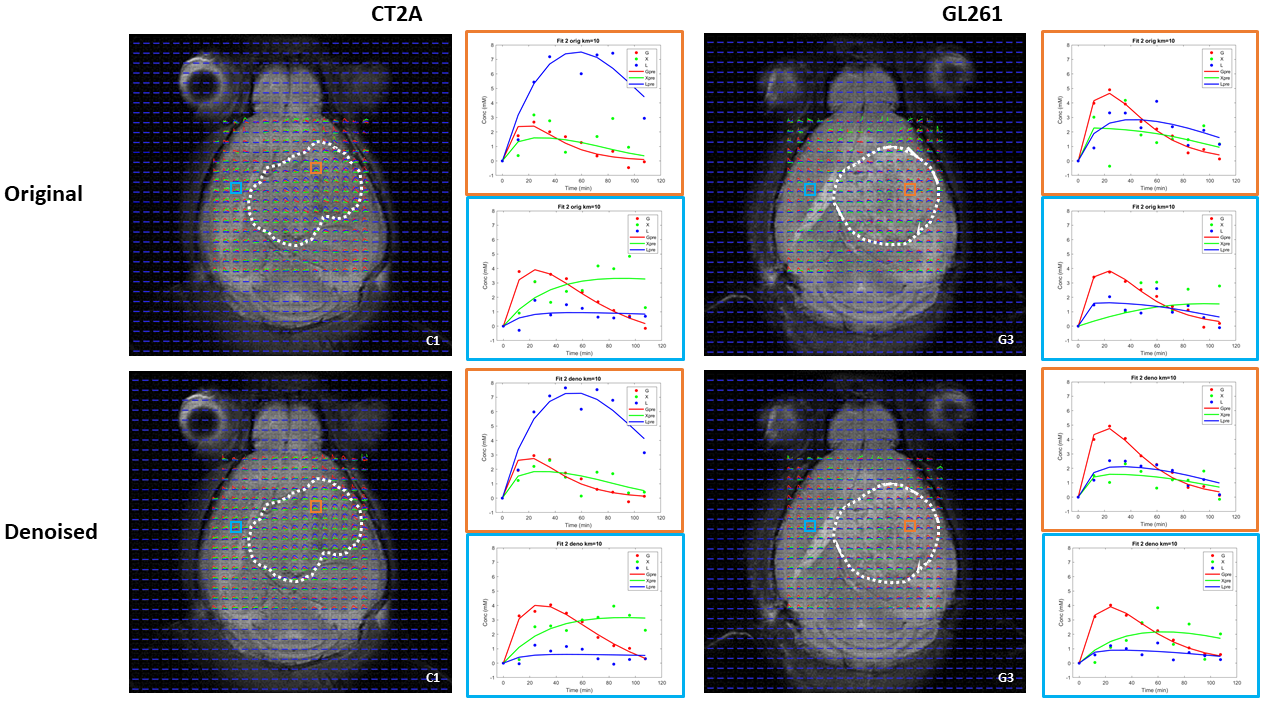
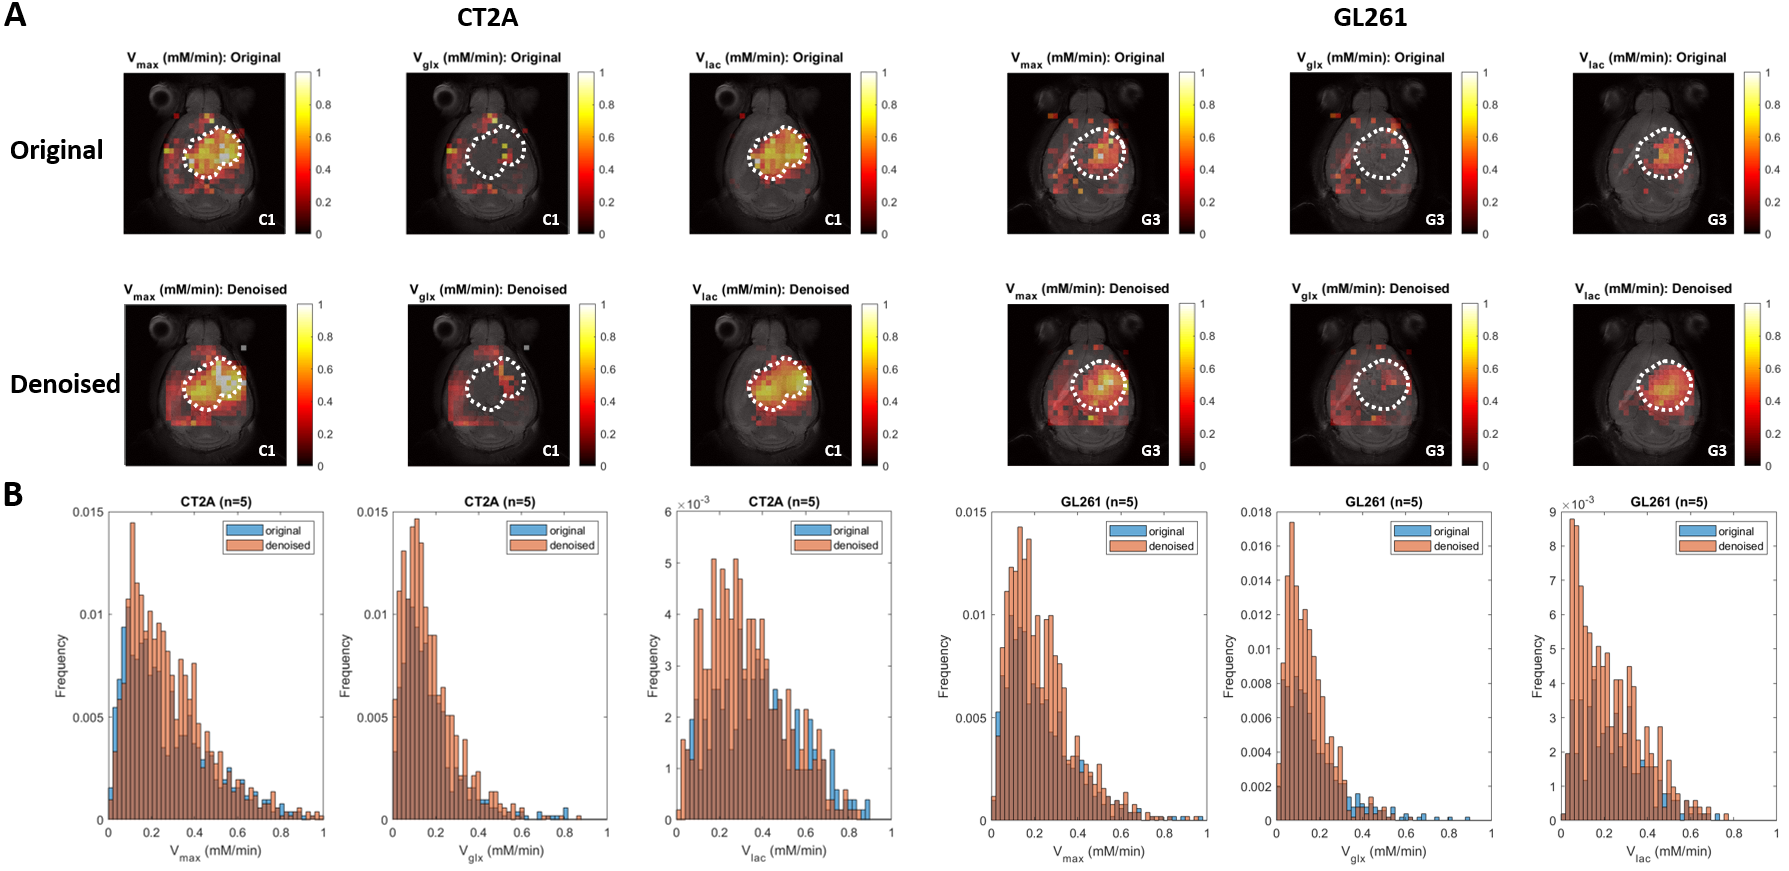
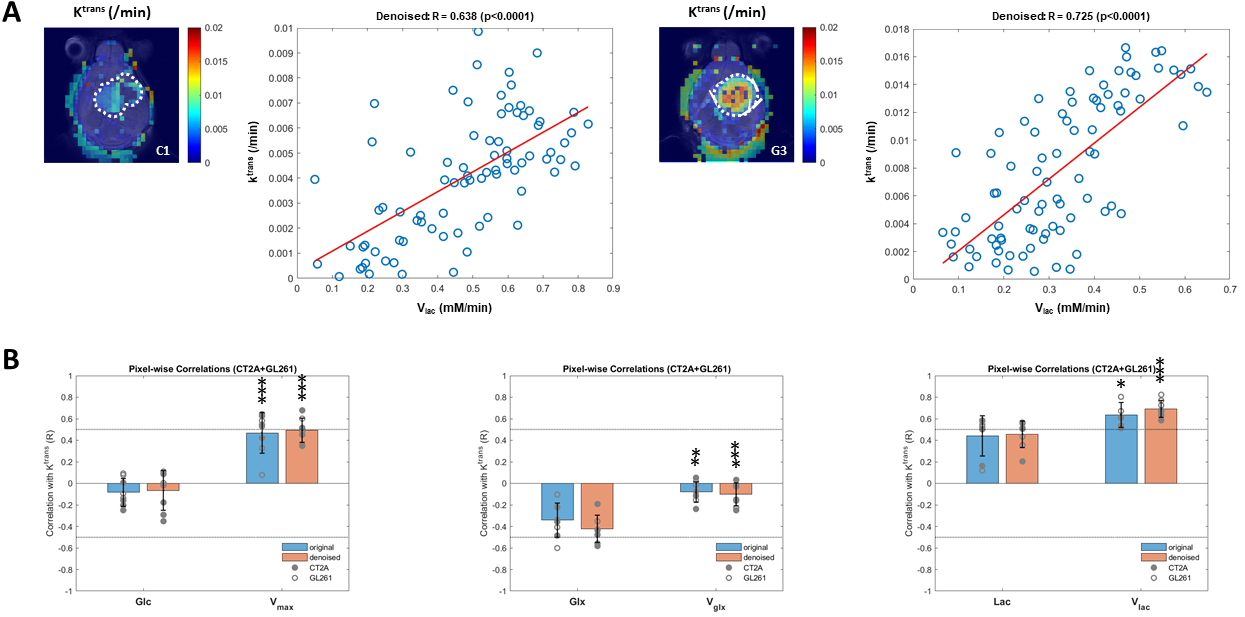
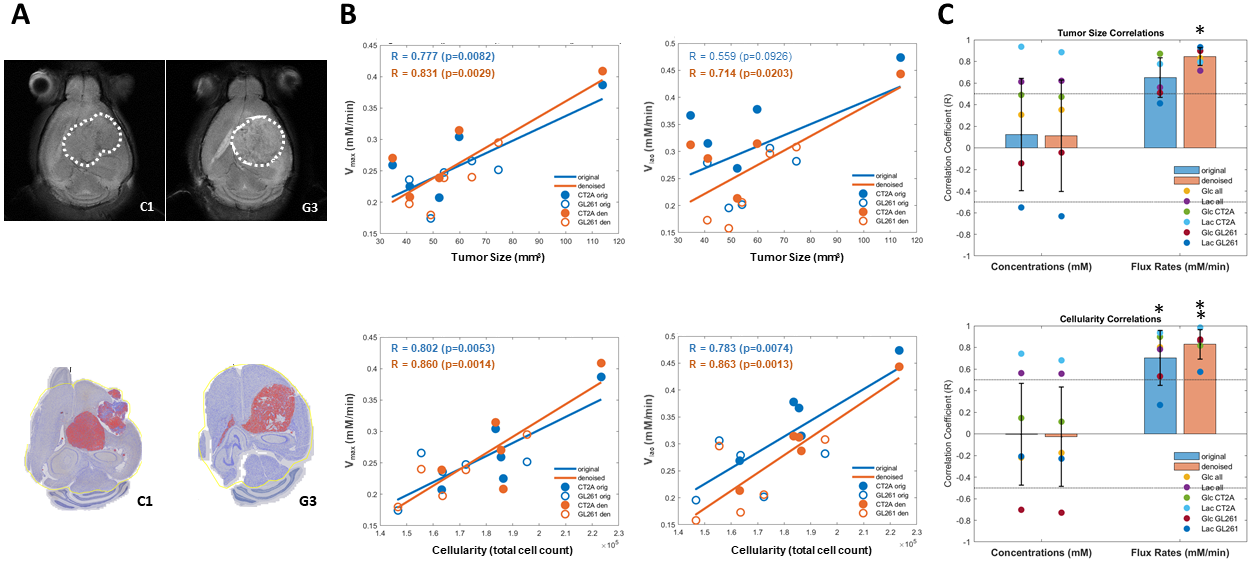
DGE-DMI achieved good spatio-temporal resolutions in CT2A and GL261 cohorts (~3 µL/voxel, 12 min/spectrum) and spectral SNRi was increased by 3-fold (p<0.001) after tMPPCA denoising (Fig. 1). This improved the overall quality of the estimated glucose flux maps (Fig. 2), based on pixel detectability: +38.3±9.7% and +62.2±19.2% (p<0.01), for CT2A and GL261, respectively (Fig. 3). Despite the histopathologic differences in cell morphology and stromal-vascular phenotypes verified between the two glioblastoma models, tissue perfusion correlated pixel-wise with glycolysis rate, within each subject (0.585 < R < 0.824) (Fig. 4); whereas tumor volume (58.5±7.2 mm3) and total tissue cellularity correlated strongly across subjects with glucose consumption and glycolysis rates, in each cohort and in pooled cohorts (0.574 < R < 0.984) (Fig. 5). These associations were overall weaker without tMPPCA denoising (0.512 < R < 0.804 and 0.267 < R < 0.935), respectively), and not consistent for glucose, lactate, and glutamine-glutamate concentration maps.DISCUSSION
DGE-DMI coupled with tMPPCA denoising generates glucose flux maps, which are associated with perfusion and histologic features of inter/intra-tumor heterogeneity in glioblastoma-bearing mouse brains. Importantly, such correlations were inconsistent for metabolite concentration maps (rather than pathway fluxes).CONCLUSION
By probing the glioma microenvironment and its surrounding tissues, these results complement our previous findings with localized deuterium spectroscopy exclusively in the tumor region [5]. Given the application of glucose-enhanced DMI to glioblastoma patients [10], and to healthy subjects at 9.4 Tesla [12], this methodology is clinically translatable holding strong potential for precision oncology.Acknowledgements
This work was supported by H2020-MSCA-IF-2018, ref. 844776 (RVS); and Champalimaud Foundation. The authors thank the Vivarium of the Champalimaud Centre for the Unknown, a research infrastructure of CONGENTO co-financed by Lisbon Regional Operational Programme (Lisboa2020), under the PORTUGAL 2020 Partnership Agreement, through the European Regional Development Fund (ERDF) and Fundação para a Ciência e Tecnologia (Portugal), under the project LISBOA-01-0145-FEDER-022170.References
1. Wen, P.Y. and S. Kesari, Malignant gliomas in adults. N Engl J Med, 2008. 359(5): p. 492-507.
2. Veraart, J., et al., Denoising of diffusion MRI using random matrix theory. Neuroimage, 2016. 142: p. 394-406.
3. Clarke, W.T. and M. Chiew, Uncertainty in denoising of MRSI using low-rank methods. Magn Reson Med, 2022. 87(2): p. 574-588.
4. Mosso, J., et al., MP-PCA denoising for diffusion MRS data: promises and pitfalls. Neuroimage, 2022. 263: p. 119634.
5. Simoes, R.V., et al., Glucose fluxes in glycolytic and oxidative pathways detected in vivo by deuterium magnetic resonance spectroscopy reflect proliferation in mouse glioblastoma. Neuroimage Clin, 2022. 33: p. 102932.
6. Kreis, F., et al., Measuring Tumor Glycolytic Flux in Vivo by Using Fast Deuterium MRI. Radiology, 2020. 294(2): p. 289-296.
7. Lu, M., et al., Quantitative assessment of brain glucose metabolic rates using in vivo deuterium magnetic resonance spectroscopy. J Cereb Blood Flow Metab, 2017. 37(11): p. 3518-3530.
8. Olesen, J.L., et al., Tensor denoising of multidimensional MRI data. Magn Reson Med, 2022.
9. Simões, R.V., et al., Perturbation of mouse glioma MRS pattern by induced acute hyperglycemia. NMR Biomed, 2008. 21(3): p. 251-64.
10. De Feyter, H.M., et al., Deuterium metabolic imaging (DMI) for MRI-based 3D mapping of metabolism in vivo. Sci Adv, 2018. 4(8): p. eaat7314.
11. Ortuno, J.E., et al., DCE@urLAB: a dynamic contrast-enhanced MRI pharmacokinetic analysis tool for preclinical data. BMC Bioinformatics, 2013. 14(1): p. 316.
12. Ruhm, L., et al., Deuterium metabolic imaging in the human brain at 9.4 Tesla with high spatial and temporal resolution. Neuroimage, 2021. 244: p. 118639.
Figures