0142
Imaging metabolism of deuterated glucose in patients with primary brain tumors1Department of Neurology, Yale University, New Haven, CT, United States, 2Department of Biomedical Engineering, Yale University, New Haven, CT, United States, 3Department of Radiology and Biomedical Imaging, Yale University, New Haven, CT, United States, 4Department of Neurosurgery, Yale University, New Haven, CT, United States
Synopsis
Keywords: Tumors, Metabolism, deuterium
Deuterium metabolic imaging (DMI), a combination of 2H MRSI with administration of a deuterated substrate, was used to map regional metabolism of [6,6’-2H2]-glucose in 24 patients with multiple types of brain tumors. DMI data were acquired 70-90 minutes after oral intake of the deuterated glucose and revealed strong tumor-to-brain image contrast in high-grade tumors. Our metric, based on the labeling of specific glucose metabolites, reflects the canonical glucose metabolism in aggressive tumors – the Warburg Effect. The Warburg Effect appears higher in high-grade tumors and showed potential as a biomarker of treatment effect.Introduction
Deuterium Metabolic Imaging (DMI) is a recently developed metabolic imaging method that combines 2H MRSI with the administration of 2H-labeled substrates 1. When DMI data are acquired in the brain following oral administration of [6,6’-2H2]-glucose, regional differences in glucose metabolism can be detected. This approach was used to investigate the potentially altered glucose metabolism in patients diagnosed with primary brain tumors. A range of tumor types, spanning different phases of disease presentation and treatment were studied to gather a first insight into the clinical potential of DMI to complement standard anatomical MRI.Methods
Patients (n=24) with a diagnosis of a primary brain tumor and without diabetes or contra-indications related to MRI scans were recruited from the Yale Neuro-Oncology service between December 2017 and October 2022. Two patients participated in two repeat DMI studies. DMI studies were performed on a 4T magnet interfaced to a Bruker Avance III HD spectrometer, using a proton TEM coil for MRI and shimming, and a four-element phased-array (8x10cm) for 2H RF reception, driven as a single RF coil during transmission. Subjects took an oral dose (0.75g/kg, capped at 60 grams) of [6,6’-2H2]-glucose (Cambridge Isotope Laboratories) dissolved in 200-250mL of water. After positioning the patient in the scanner, scout images, B0 mapping, shimming, and T2-weighted (T2W) multi-slice spin echo MR images were acquired. 2H MRSI signal acquisition was achieved either as a standalone (n=13) pulse-acquire sequence, extended with 3D phase-encoding gradients (TR: 333ms, averages: 8, total scan time: 29 mins) 1, or (n=13) in parallel with MRI pulse sequences by interleaving the 2H MRSI acquisition with FLAIR-, MP-RAGE-, T2W-, 2D SWI-DMI and 3D SWI-DMI2. In both scenarios spherical k-space encoding was used and the nominal spatial resolution was 20x20x20mm3 or 8mL, with the midpoint of acquisition between 80 and 100 min after glucose intake. In the interleaved acquisition scheme, a TR of 314 ms was used for 2H MRSI. For both direct and interleaved DMI, the total scan duration was between 45 and 60 minutes. 1H MRI and 2H DMI data were processed in NMRWizard, a home-written graphical user interface in Matlab (R2021a, Mathworks; https://medicine.yale.edu/lab/dmi/). DMI processing included linear prediction of missing time domain points due to the phase encoding gradients and 5Hz line broadening followed by a 4D Fourier transformation. To remove extracranial signal contribution, the SLIM algorithm was implemented in conjunction with the anatomical detail provided by anatomical MRI for brain/skull segmentation 3. The resulting 2H MR spectra from the brain were quantified with linear least-squares fitting, including a linear baseline and up to four Lorentzian lines for water, glucose, glutmate+glutamine (Glx), and lactate (Lac). To characterize the Warburg Effect, a preference for glycolytic over oxidative glucose metabolism often observed in tumors, a single metric was used calculated as Lac/(Lac+Glx) 4. This metric was displayed overlaid on anatomical MR images as amplitude color maps following spatial convolution with a Gaussian kernel.Results
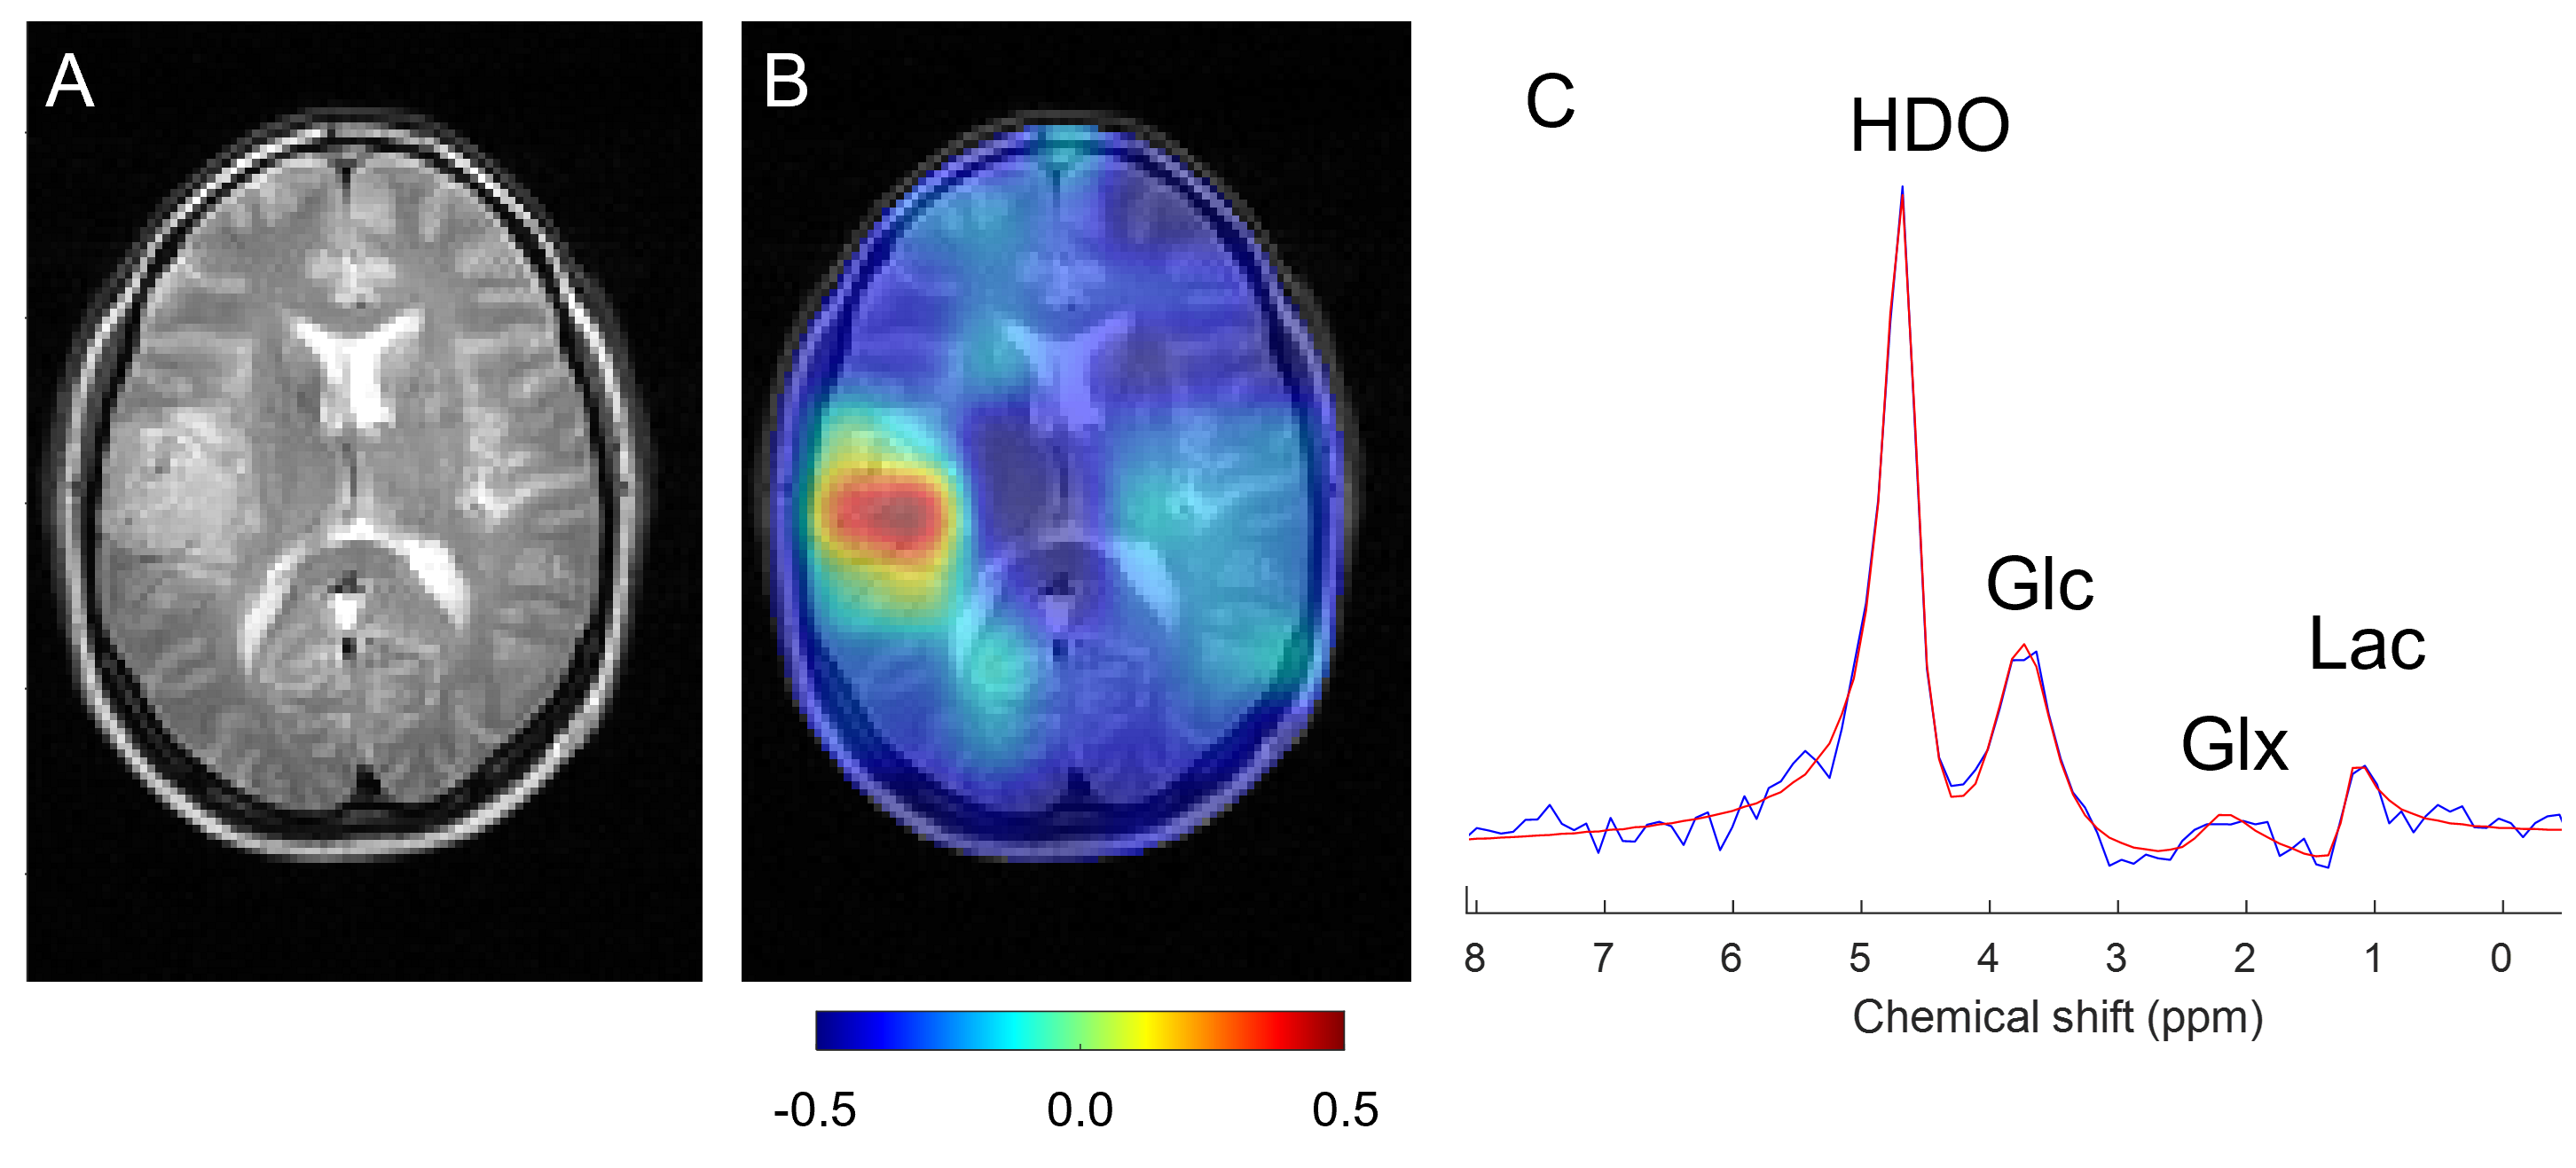
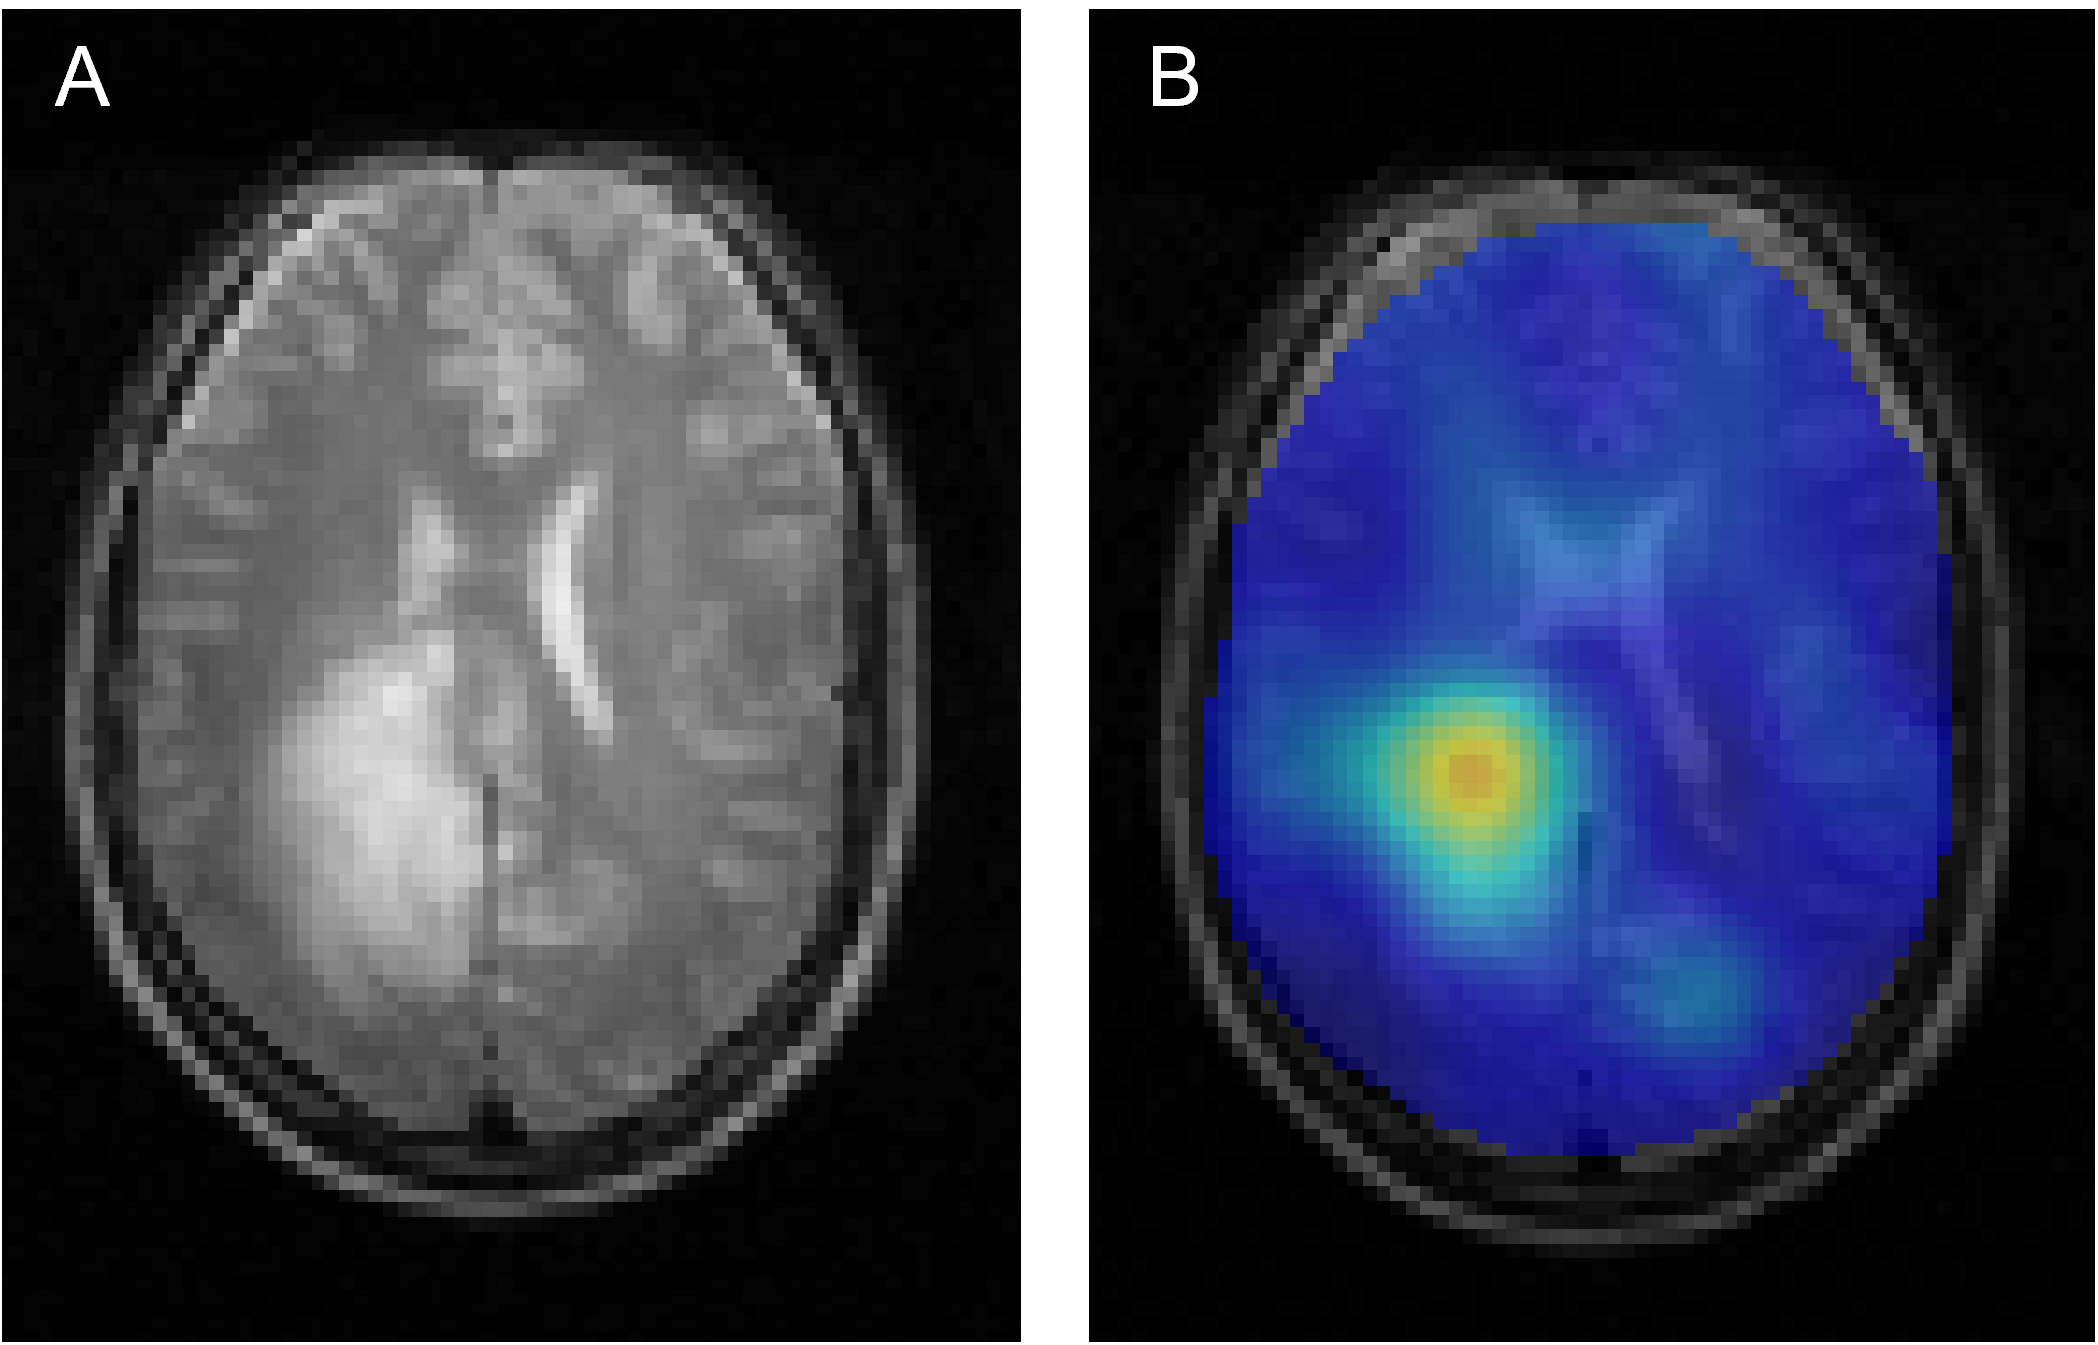
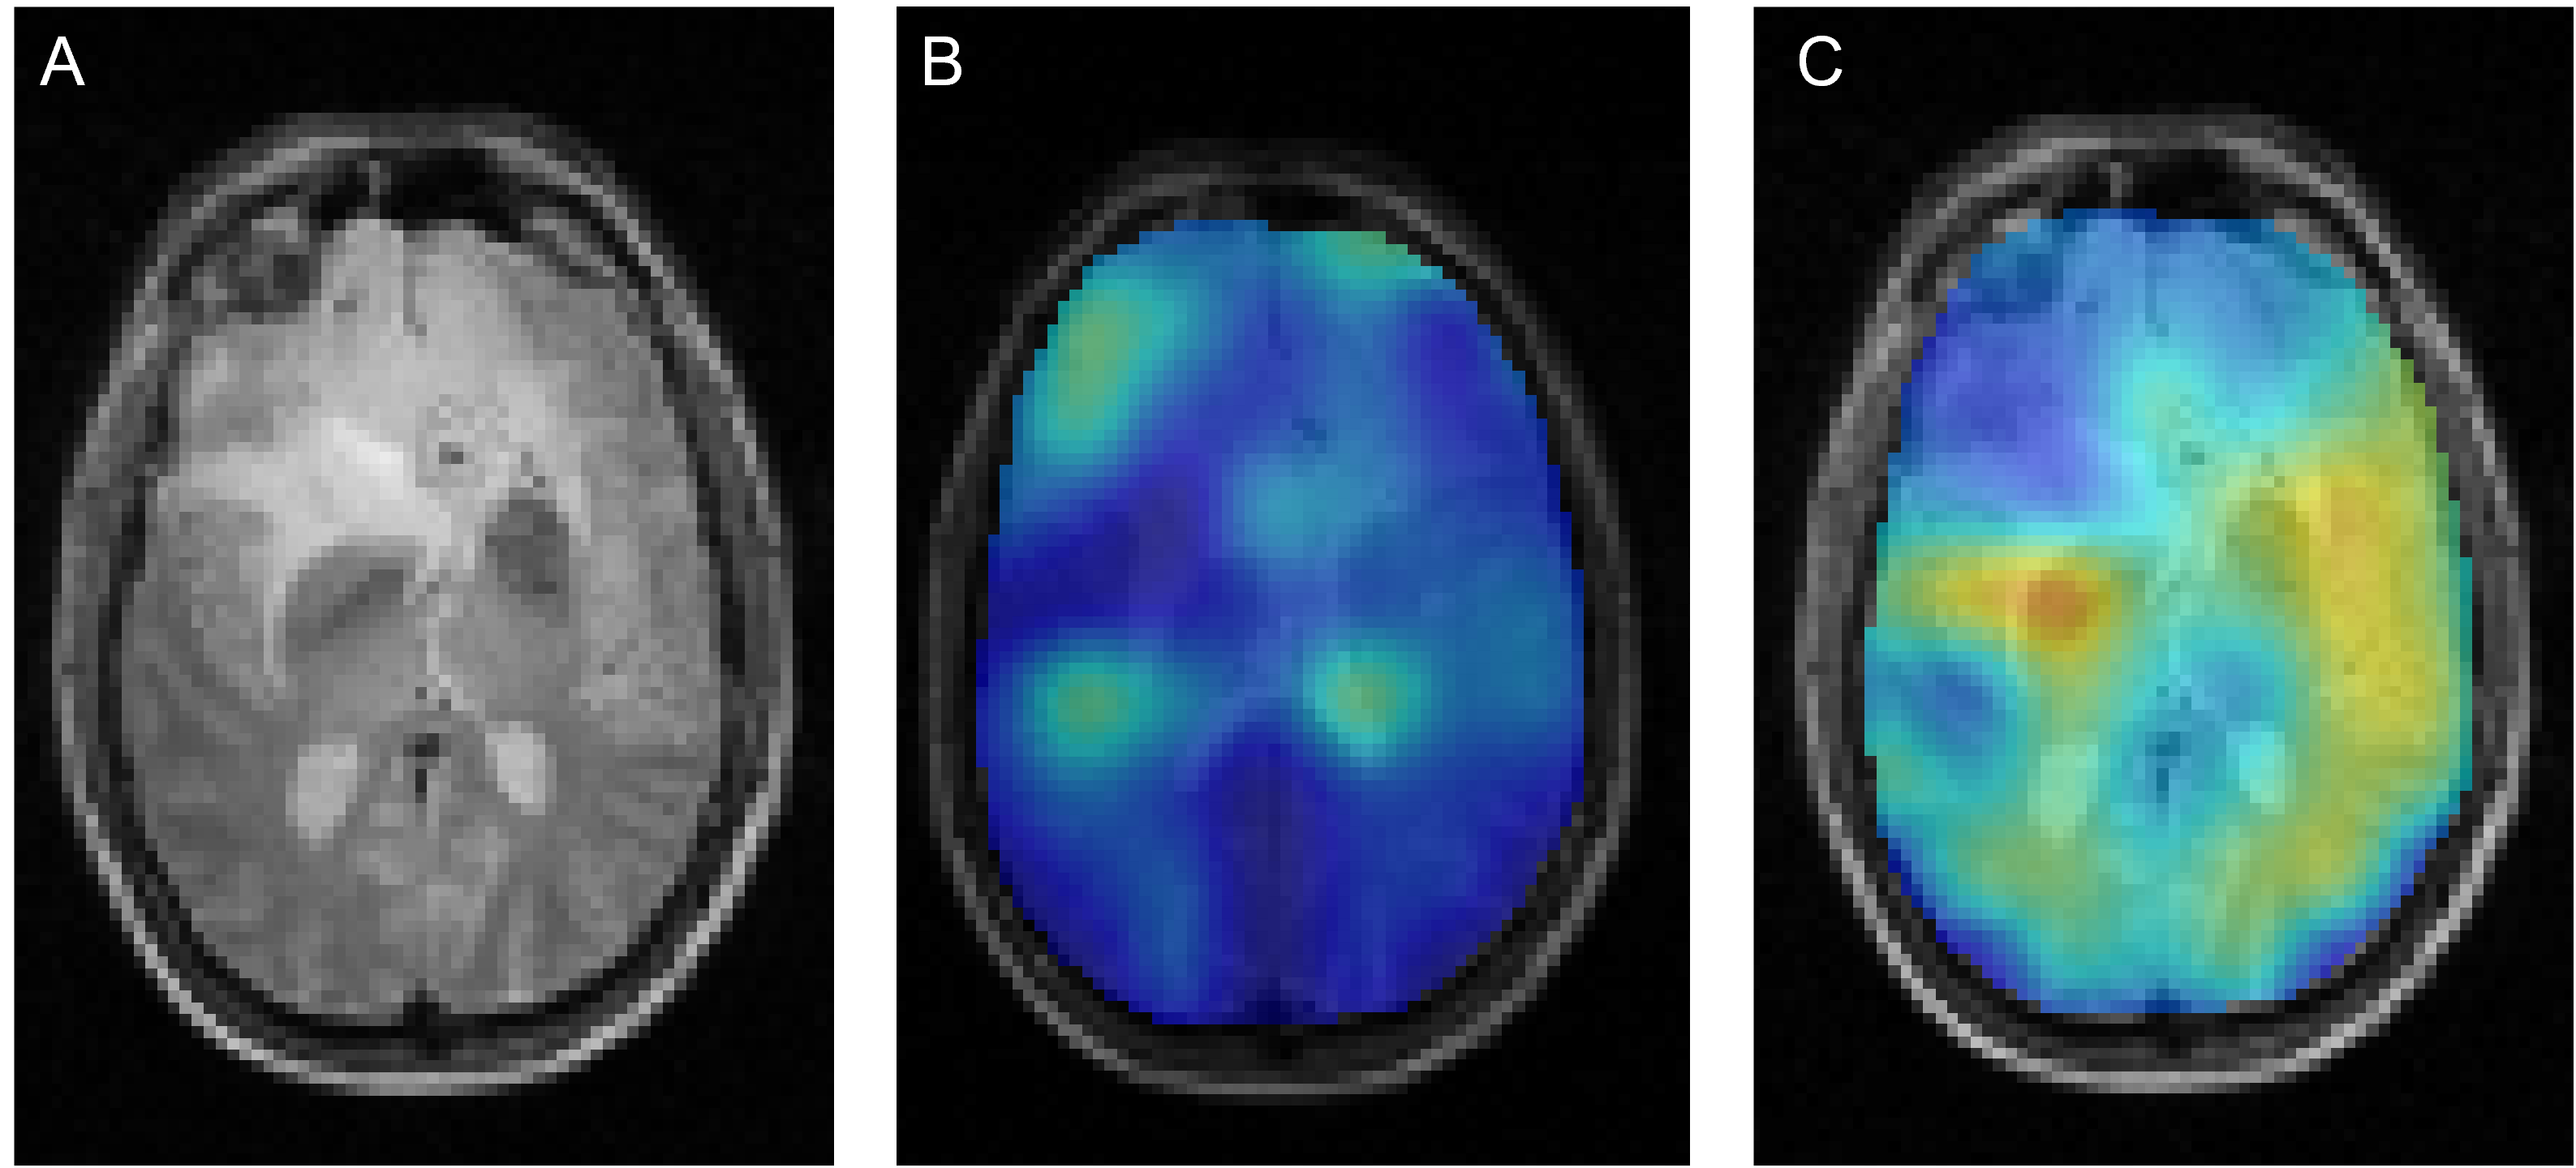
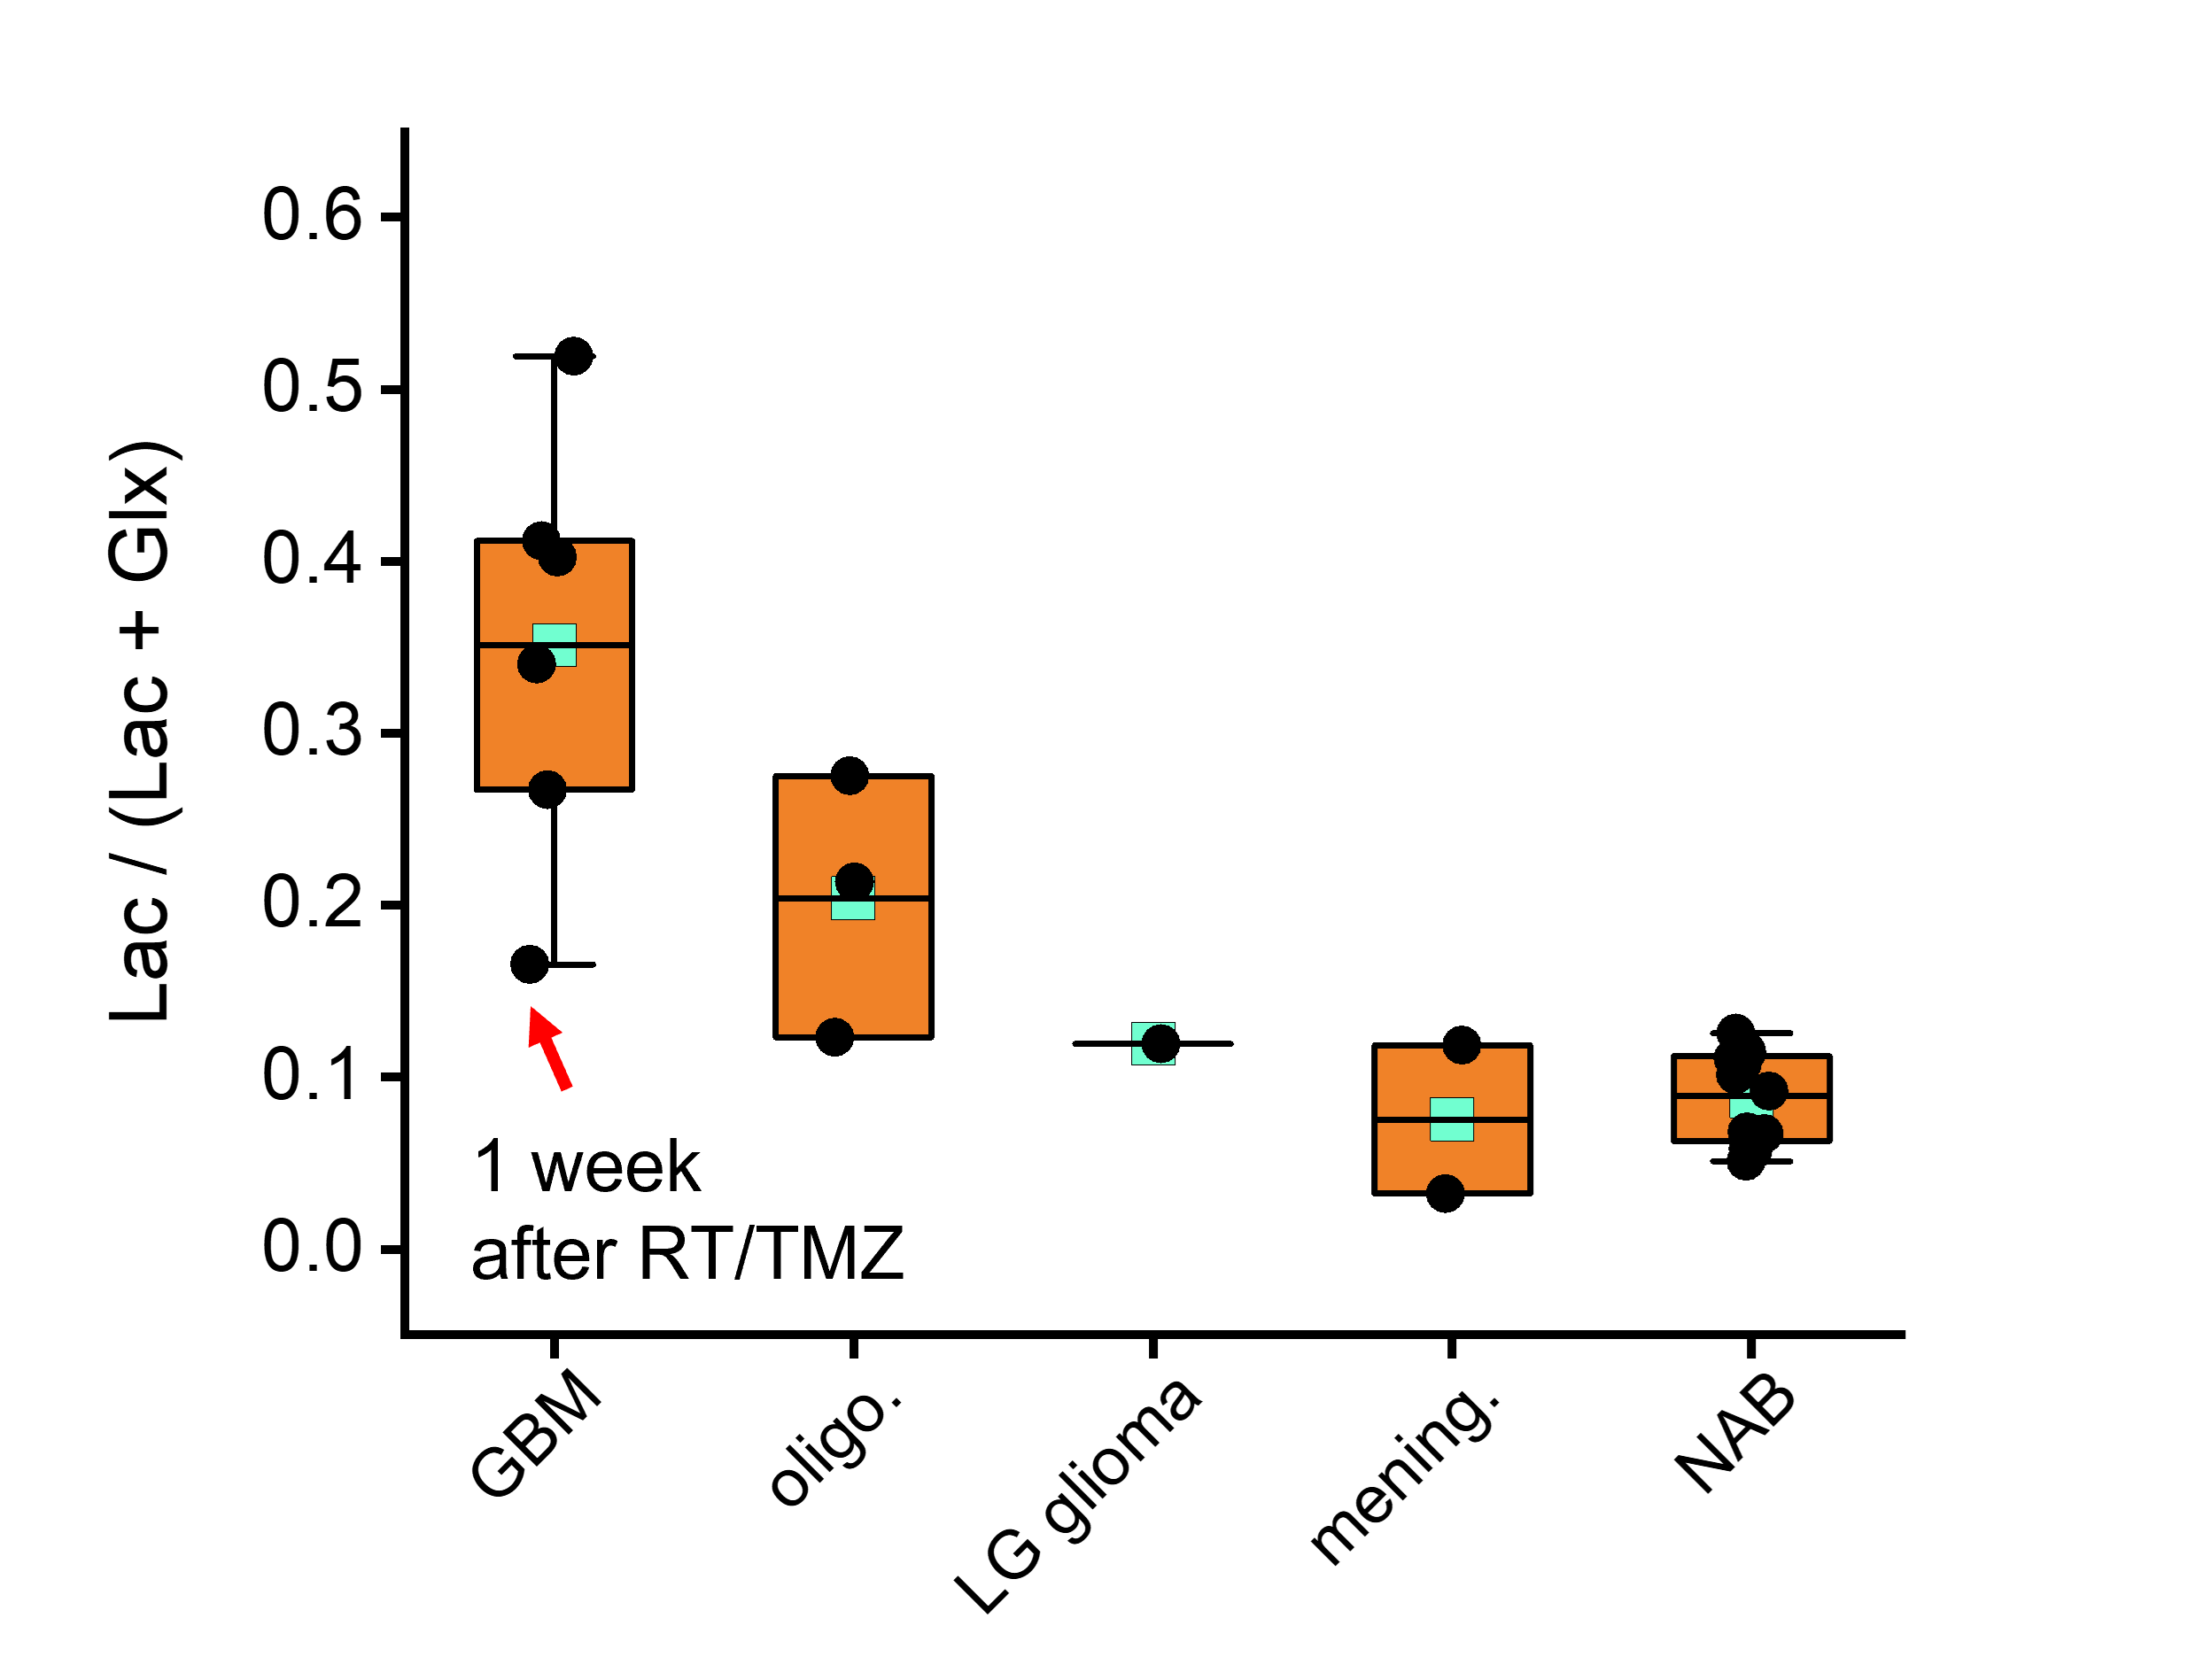
All DMI studies were technically successful. Here we report on the first 13 studies of the ongoing analysis. Examples of the Lac/(Lac+Glx) maps are shown in Figs 1 and 2. Figure 1 illustrates the glucose metabolism in a patient with glioblastoma (GBM), from DMI data acquired before tumor resection. A strong metabolism-based contrast with surrounding normal brain can be observed. Similarly, DMI data from a patient with an oligodendroglioma undergoing chemotherapy show an area with increased production of deuterated lactate in the area of the tumor lesion (Fig. 2). In contrast, in a patient with atypical meningioma, no obvious lactate production can be seen. In addition, an overall reduction of oxidative glucose metabolism appears to be present, indicated by the low levels of Glx labeling the in lesion (Fig. 3). Figure 4 summarizes the degree of the Warburg Effect captured by the Lac/(Lac+Glx) ratio for the different tumor types analyzed and for normal brain.Discussion
The use of Lac/(Lac+Glx) over the previously used Lac/Glx ratio as metric for abnormal glucose metabolism prevents high values that are driven merely by very low levels of Glx labeling 1. Where Lac/Glx represents a proxy for the balance between glycolytic and oxidative fluxes of glucose metabolism, the Lac/(Lac+Glx) can be interpreted as indicating the fraction of total glucose metabolism that is directed towards glycolysis. The mean Lac/(Lac+Glx) measured in the lesion of different tumor types shows that the highest mean values are observed in the most aggressive tumor type (GBM, WHO CNS grade 4), with lower values for oligodendroglioma, WHO CNS grade 3, and atypical meningiomas, which are WHO CNS grade 2. Note that the lowest value of Lac/(Lac+Glx) in GBM was observed in a patient one week after finishing chemoradiation as part of the standard of care, suggesting that DMI combined with deuterated glucose could potentially be useful to detect treatment effects in brain tumors.Conclusion
DMI of glucose metabolism is a robust method that can detect abnormal glucose metabolism in brain tumors. Our preliminary analysis indicates that the Lac/(Lac+Glx) metric could be a correlate for tumor grade, and potentially an indicator of treatment effect in aggressive tumors.Acknowledgements
This research was funded, in part, by NIH grant NIBIB R01-EB025840 and the American Brain Tumor Association (ABTA).References
1. De Feyter, H. M. et al. Deuterium metabolic imaging (DMI) for MRI-based 3D mapping of metabolism in vivo. Sci. Adv. 4, eaat7314 (2018).
2. Lu, Ming, Zhu, Xiao-Hong, Zhang, Yi, Mateescu, Gheorghe, & Chen, Wei. Quantitative assessment of brain glucose metabolic rates using in vivo deuterium magnetic resonance spectroscopy. J. Cereb. Blood Flow Metab. 37, 3518–3530 (2017).
3. Kaggie, J. D. et al. Deuterium metabolic imaging and hyperpolarized 13C-MRI of the normal human brain at clinical field strength reveals differential cerebral metabolism. NeuroImage 257, 119284 (2022).
4. Ruhm, L. et al. Deuterium metabolic imaging in the human brain at 9.4 Tesla with high spatial and temporal resolution. NeuroImage 244, 118639 (2021).
5. Roig, E. S. et al. Deuterium metabolic imaging of the human brain in vivo at 7 T. Magn. Reson. Med. 1–11, (2022).
6. Liu, Y. et al. Interleaved fluid-attenuated inversion recovery (FLAIR) MRI and deuterium metabolic imaging (DMI) on human brain in vivo. Magn. Reson. Med. 88, 28–37 (2022).
7. Hu, X., Levin, D. N., Lauterbur, P. C. & Spraggins, T. SLIM: Spectral localization by imaging. Magn. Reson. Med. 8, 314–322 (1988).
8. Warburg, O. On the Origin of Cancer
Cells. Science 123, 309–314 (1956).
Figures