0141
Non-invasive blood brain barrier integrity mapping in patients with high-grade glioma and metastasis by time-encoded arterial spin labelling
Gabriel Hoffmann1,2, Christine Preibisch1,2, Matthias Günther3,4,5, Amnah Mahroo3, Matthias JP van Osch6,7, Lena Václavů6, Lena Schmitzer1, Claus Zimmer1,2, Benedikt Wiestler1, and Stephan Kaczmarz1,2,8
1Department of Diagnostic and Interventional Neuroradiology, Klinikum rechts der Isar, Technical University of Munich, Munich, Germany, 2TUM-Neuroimaging Center, Klinikum rechts der Isar, Technical University of Munich, Munich, Germany, 3MR Physics, Fraunhofer Institute for Digital Medicine MEVIS, Bremen, Germany, 4MR-Imaging and Spectroscopy, University of Bremen, Bremen, Germany, 5mediri GmbH, Heidelberg, Germany, 6C.J. Gorter MRI Center, Department of Radiology, Leiden University Medical Center, Leiden, Netherlands, 7Leiden Institute of Brain and Cognition, Leiden University, Leiden, Netherlands, 8Philips GmbH Market DACH, Hamburg, Germany
1Department of Diagnostic and Interventional Neuroradiology, Klinikum rechts der Isar, Technical University of Munich, Munich, Germany, 2TUM-Neuroimaging Center, Klinikum rechts der Isar, Technical University of Munich, Munich, Germany, 3MR Physics, Fraunhofer Institute for Digital Medicine MEVIS, Bremen, Germany, 4MR-Imaging and Spectroscopy, University of Bremen, Bremen, Germany, 5mediri GmbH, Heidelberg, Germany, 6C.J. Gorter MRI Center, Department of Radiology, Leiden University Medical Center, Leiden, Netherlands, 7Leiden Institute of Brain and Cognition, Leiden University, Leiden, Netherlands, 8Philips GmbH Market DACH, Hamburg, Germany
Synopsis
Keywords: Tumors, Permeability, Blood Brain Barrier
High-grade glioma are known to cause blood brain barrier (BBB) disruption, facilitating molecular leakage from inside the vessels into tissue. Current methods to probe BBB integrity are either not quantitative or, by using Gadolinium, insensitive to subtle changes. Here, we present first data of arterial spin labelling (ASL)-based BBB mapping of water exchange time (Texch) in brain tumour patients. Results show faster exchange (shorter Texch) in tumorous and even normal-appearing tissue compared to healthy subjects. This highlights the potential of ASL-based water exchange mapping as a proxy measure for BBB integrity, and its potential sensitivity to even subtle impairments.
Introduction
The blood brain barrier (BBB) provides a robust physical and biochemical border for molecular exchange between intra- and extravascular compartments. BBB disruptions are well known in high-grade brain tumours. As a result, permeability of blood vessels in pathological tissue is increased, allowing blood constituents and other potentially harmful substances to leak from the vessels into brain tissue.1-3 In clinical routine, BBB disruptions are currently assessed by contrast-enhanced T1w-MRI. Better quantification of BBB integrity would be of high clinical interest, but available contrast agent (CA) based methods are limited. Dynamic contrast-enhanced (DCE) MRI, based on the T1 shortening effect of gadolinium (Gd), is limited to the detection of major BBB disruptions, due to the size and chemical structure of Gd-compounds.4 In addition, Gd is not applicable in patients with renal malfunctions. Previously proposed non-invasive alternatives lack quantitative measures of BBB integrity.5,6 In contrast, Mahroo et al. proposed non-invasive and quantitative BBB-mapping based on time-encoded arterial spin labelling (ASL) MRI,7 which uses blood water as an endogenous freely-diffusible tracer. Due to its small size, water is an ideal candidate for detecting even subtle changes in BBB permeability and has shown promising results.8-10 The proposed extended model7 is based on a two-compartment model of intra- and extravascular space.11 It accounts for inta-voxel transit by considering cerebral blood flow (CBF) and arterial transit time (ATT) and yields an estimate for the exchange time (Texch) for water across the BBB. Here we present first results of an ongoing clinical translation study of ASL-based BBB-mapping in patients with high-grade intra-axial glioma and metastases.We hypothesized, that ASL-based BBB mapping may be sensitive to impaired BBB-integrity. This may result in faster water exchange, which could be reflected by decrease in measured Texch.
Methods
Seventeen subjects underwent MRI on a 3T Ingenia Elition X (Philips, Best, Netherlands). Six patients with intra-axial, high-grade glioma and metastases (age (55.1±13.4)y, 3 female) were compared to eleven healthy controls (HC, age (25.25±2.7)y, 7 female). The imaging protocol included structural MRI (pre- and post-CA T1w-MPR, T2w-FLAIR), ASL-based BBB-mapping by combining two time-encoded Hadamard sequences,12 and PDw data for CBF quantification (Fig.1).Anatomical images were co-registered, skull-stripped and segmented into masks of tumorous tissue (CA-enhancing regions and edema) using an ensemble classifier (BraTS Toolkit).13 Based on T1w images, segments of normal-appearing (na) GM, WM, and CSF were calculated using ANTs Atropos,14 excluding tumorous areas. Moreover, na-whole brain regions were used to account for tumour locations at border-zones between tissues. Texch was calculated from the extended two-compartment model,7 as implemented in FSL’s fabber toolbox.15-17 Quantitative analyses used custom-built MATLAB (v2020a, TheMathWorksInc., Natick, USA) programs and SPM12,18 for segmenting HCs’ tissue maps and co-registration. Regional statistical analyses of Texch included tumour and normal-appearing tissues as well as group comparisons between patients and HCs. Finally, Texch in tumour vs. normal-appearing brain tissue was correlated.
Results
Exemplary data showed reduced Texch (Fig.2C,G) in CA-enhancing (Fig.2A,E) and FLAIR hyperintense (Fig.2B,F) tissue. In line, statistical analyses on group level yielded reduced group-average Texch in tumorous tissue compared to naGM (Texchtumour=(0.123±0.023)s vs. TexchGM=(0.153±0.042)s, Fig.3A). Similarly, there was a strong trend for lower Texch compared to na-whole brain (Fig.3B). Exchange times were lower in naWM, both for patients (Fig.3C) and HC (not shown). Compared to HCs, Texch was not only reduced in tumorous tissue but in all brain regions, with significant reductions in naGM and na-whole brain (Fig.4). In patients, a strong correlation was found between Texch in tumour regions and naGM (Fig.5A) as well as na-brain (Fig.5B). Interestingly, Texch maps of the metastasis patients (Fig.2C) did in naGM rather resemble HCs.Discussion
As hypothesized, water exchange times were decreased within brain tumours which accords with well-known BBB disruptions1 and increased volume transfer constants (Ktrans) from DCE studies.2,3,19-21 Moreover, our consistently lower Texch in naWM, both for patients and HCs, agrees well with increased WM-Ktrans as reported by DCE studies2 . Similarly, HCs’ Texch values agree well with the literature.7,8 However, future investigation is needed to disentangle effects in WM from regionally lowered SNR using ASL.22 Interestingly, Texch was not only reduced in tumorous tissue, but also in naGM and whole brain compared to HCs. This might be explained by subtle disease-related BBB impairments. However, previously reported age-related BBB-impairments23,24 may also contribute as our HCs were younger than the patients. Nevertheless, these findings may be interesting for chemotherapy planning.25,26 Correlation between Texch in tumorous tissue vs. naGM and na-whole brain, suggests reduced BBB integrity even in seemingly unaffected brain areas. This ongoing study finally aims to discern between glioma and metastases to better characterize different underlying patho-mechanisms resulting in BBB impairment.4Conclusion
We successfully demonstrated the sensitivity of ASL-based BBB mapping to patho-physiologically driven decreases of BBB-integrity. Texch may be a promising proxy for BBB impairments. Texch appeard to be sensitive to even subtle changes in normal appearing tissue, which may yield additional insights to brain tumour patho-physiology. In a broader context, clinical applications of ASL-based BBB mapping appear auspicious in numerous other pathologies with (subtle) BBB dysfunctions,10,27,28 such as Alzheimer’s and small vessel disease.Acknowledgements
We acknowledge the support by Ev. Studienwerk Villigst e.V (personal grant to GH) and the German research Foundation (DFG, grant PR 1039/6-3)References
1. Jain, R.K., Di Tomaso, E., Duda, D.G., Loeffler, J.S., Sorensen, A.G. & Batchelor, T.T. Angiogenesis in brain tumours. Nature Reviews Neuroscience 8, 610-622 (2007).2. Heye, A.K., Culling, R.D., Hernandez, M.D.V., Thrippleton, M.J. & Wardlaw, J.M. Assessment of blood-brain barrier disruption using dynamic contrast-enhanced MRI. A systematic review. Neuroimage-Clin 6, 262-274 (2014).
3. Keil, V.C., Gielen, G.H., Pintea, B., Baumgarten, P., Datsi, A., Hittatiya, K., Simon, M. & Hattingen, E. DCE-MRI in glioma, infiltration zone and healthy brain to assess angiogenesis: a biopsy study. Clinical neuroradiology 31, 1049-1058 (2021).
4. Elschot, E.P., Backes, W.H., Postma, A.A., van Oostenbrugge, R.J., Staals, J., Rouhl, R.P.W. & Jansen, J.F.A. A Comprehensive View on MRI Techniques for Imaging Blood-Brain Barrier Integrity. Invest Radiol 56, 10-19 (2021).
5. Lutz, K., Wiestler, B., Graf, M., Bäumer, P., Floca, R., Schlemmer, H.-P., Heiland, S., Wick, W., Bendszus, M. & Radbruch, A. Infiltrative patterns of glioblastoma: Identification of tumor progress using apparent diffusion coefficient histograms. Journal of Magnetic Resonance Imaging 39, 1096-1103 (2014).
6. Preibisch, C., Shi, K., Kluge, A., Lukas, M., Wiestler, B., Göttler, J., Gempt, J., Ringel, F., Al Jaberi, M. & Schlegel, J. Characterizing hypoxia in human glioma: A simultaneous multimodal MRI and PET study. NMR Biomed 30, e3775 (2017).
7. Mahroo, A., Buck, M.A., Huber, J., Breutigam, N.J., Mutsaerts, H., Craig, M., Chappell, M. & Gunther, M. Robust Multi-TE ASL-Based Blood-Brain Barrier Integrity Measurements. Front Neurosci 15, 719676 (2021).
8. Petitclerc, L., Schmid, S., Hirschler, L. & van Osch, M.J.P. Combining T2 measurements and crusher gradients into a single ASL sequence for comparison of the measurement of water transport across the blood–brain barrier. Magnetic Resonance in Medicine 85, 2649-2660 (2021).
9. Schmid, S., Teeuwisse, W.M., Lu, H. & van Osch, M.J. Time-efficient determination of spin compartments by time-encoded pCASL T2-relaxation-under-spin-tagging and its application in hemodynamic characterization of the cerebral border zones. Neuroimage 123, 72-79 (2015).
10. Dickie, B.R., Vandesquille, M., Ulloa, J., Boutin, H., Parkes, L.M. & Parker, G.J.M. Water-exchange MRI detects subtle blood-brain barrier breakdown in Alzheimer's disease rats. NeuroImage 184, 349-358 (2019).
11. Gregori, J., Schuff, N., Kern, R. & Gunther, M. T2-based arterial spin labeling measurements of blood to tissue water transfer in human brain. J Magn Reson Imaging 37, 332-342 (2013).
12. Günther, M. Highly efficient accelerated acquisition of perfusion inflow series by cycled arterial spin labeling. in Proceedings of the 15th Annual Meeting of ISMRM (Berlin, 2007).
13. Kofler, F., Berger, C., Waldmannstetter, D., Lipkova, J., Ezhov, I., Tetteh, G., Kirschke, J., Zimmer, C., Wiestler, B. & Menze, B.H. BraTS toolkit: translating BraTS brain tumor segmentation algorithms into clinical and scientific practice. Frontiers in neuroscience, 125 (2020).
14. Avants, B.B., Tustison, N.J., Wu, J., Cook, P.A. & Gee, J.C. An open source multivariate framework for n-tissue segmentation with evaluation on public data. Neuroinformatics 9, 381-400 (2011).
15. Chappell, M.A., Groves, A.R., Whitcher, B. & Woolrich, M.W. Variational Bayesian inference for a nonlinear forward model. IEEE Transactions on Signal Processing 57, 223-236 (2009).
16. Groves, A.R., Chappell, M.A. & Woolrich, M.W. Combined spatial and non-spatial prior for inference on MRI time-series. NeuroImage 45, 795-809 (2009).
17. Woolrich, M.W., Jbabdi, S., Patenaude, B., Chappell, M., Makni, S., Behrens, T., Beckmann, C., Jenkinson, M. & Smith, S.M. Bayesian analysis of neuroimaging data in FSL. Neuroimage 45, S173-S186 (2009).
18. Wellcome Centre for Human Neuroimaging. Statistical Parametric Mapping Software (SPM 12).
19. Ludemann, L., Warmuth, C., Plotkin, M., Forschler, A., Gutberlet, M., Wust, P. & Amthauer, H. Brain tumor perfusion: comparison of dynamic contrast enhanced magnetic resonance imaging using T1, T2, and T2* contrast, pulsed arterial spin labeling, and H2(15)O positron emission tomography. Eur J Radiol 70, 465-474 (2009).
20. Mills, S.J., Soh, C., O’connor, J.P., Rose, C.J., Buonaccorsi, G.A., Cheung, S., Zhao, S., Parker, G.J. & Jackson, A. Tumour enhancing fraction (EnF) in glioma: relationship to tumour grade. European radiology 19, 1489-1498 (2009).
21. Gao, X., Yue, Q., Liu, Y., Fan, D., Fan, K., Li, S., Qian, J., Han, L., Fang, F., Xu, F., Geng, D., Chen, L., Zhou, X., Mao, Y. & Li, C. Image-guided chemotherapy with specifically tuned blood brain barrier permeability in glioma margins. Theranostics 8, 3126-3137 (2018).
22. van Osch, M.J., Teeuwisse, W.M., van Walderveen, M.A., Hendrikse, J., Kies, D.A. & van Buchem, M.A. Can arterial spin labeling detect white matter perfusion signal? Magnetic Resonance in Medicine 62, 165-173 (2009).
23. Mahroo, A., Buck, M.A. & Günther, M. Increased Permeability of Blood-Brain Barrier in the Aging Human Brain – A Multi-TE ASL Study. ISMRM Perfusion Workshop - From Head to Toe, (Los Angeles, CA, United States, March 04-07, 2022).
24. Mooradian, A.D. Effect of aging on the blood-brain barrier. Neurobiology of Aging 9, 31-39 (1988).
25. Agarwal, S., Sane, R., Oberoi, R., Ohlfest, J.R. & Elmquist, W.F. Delivery of molecularly targeted therapy to malignant glioma, a disease of the whole brain. Expert reviews in molecular medicine 13(2011).
26. Sarkaria, J.N., Hu, L.S., Parney, I.F., Pafundi, D.H., Brinkmann, D.H., Laack, N.N., Giannini, C., Burns, T.C., Kizilbash, S.H. & Laramy, J.K. Is the blood–brain barrier really disrupted in all glioblastomas? A critical assessment of existing clinical data. Neuro-oncology 20, 184-191 (2018).
27. Starr, J.M., Farrall, A.J., Armitage, P., McGurn, B. & Wardlaw, J. Blood-brain barrier permeability in Alzheimer's disease: a case-control MRI study. Psychiatry Res 171, 232-241 (2009).
28. Thrippleton, M.J., Backes, W.H., Sourbron, S., Ingrisch, M., van Osch, M.J.P., Dichgans, M., Fazekas, F., Ropele, S., Frayne, R., van Oostenbrugge, R.J., Smith, E.E. & Wardlaw, J.M. Quantifying blood-brain barrier leakage in small vessel disease: Review and consensus recommendations. Alzheimers Dement 15, 840-858 (2019).
Figures
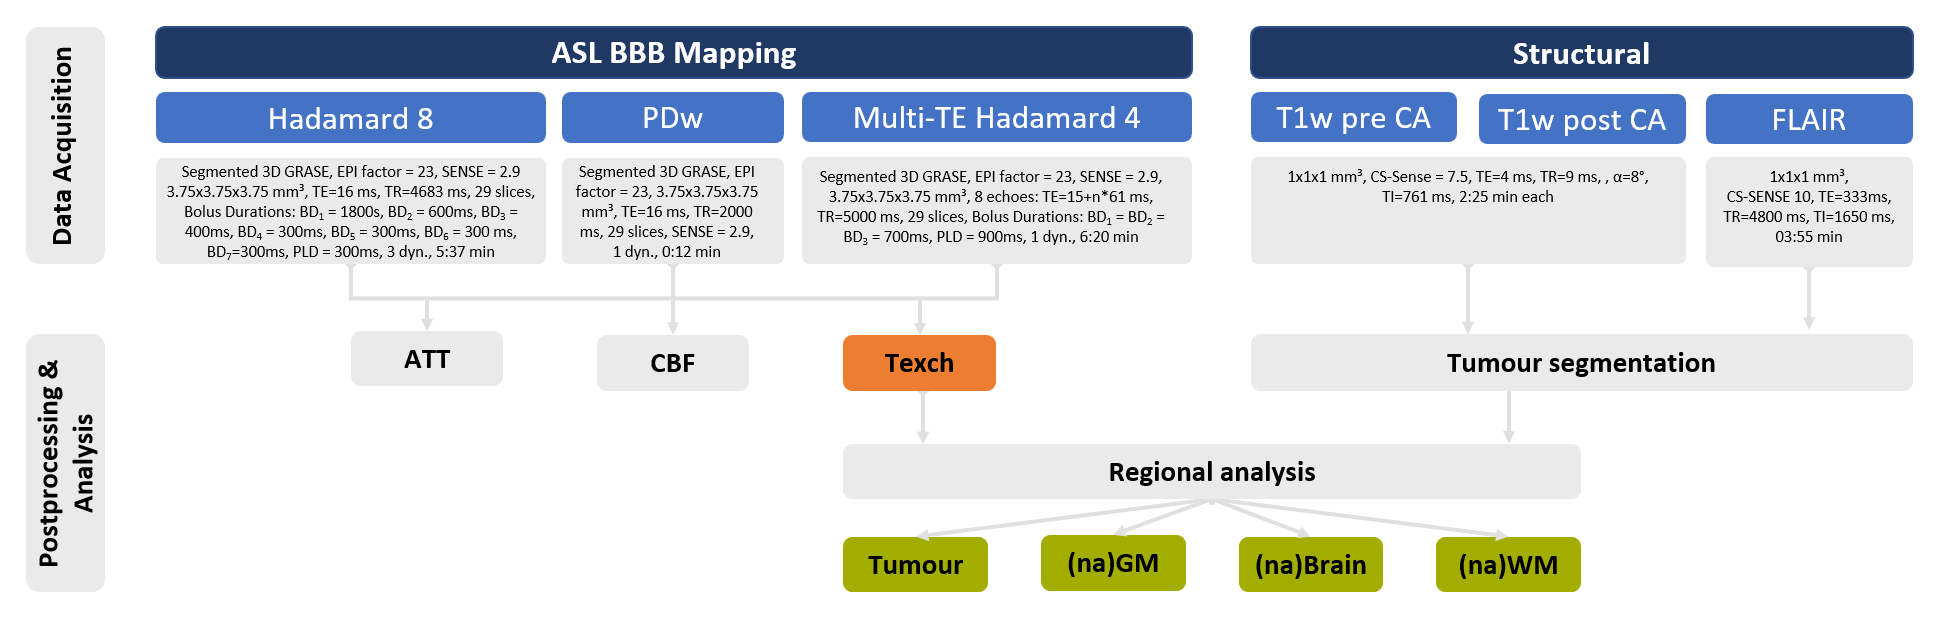
Figure 1: MRI
protocol & parameters. Arterial spin
labelling (ASL) based blood brain barrier (BBB) mapping used two
Hadamard-encoded sequences. Hadamard 4, encoded three equally-sized blocks,
with multi-echo readout (multi-TE), each, while Hadamard 8 encoded 7 blocks. After concatenating single & multi-TE data, arterial transit time
(ATT), cerebral blood flow (CBF) and water exchange time (Texch) were fitted.
As a proxy of BBB integrity, Texch was compared between brain regions. By
structural imaging, tumorous tissue, normal-appearing (na) GM, whole brain and
WM were derived.
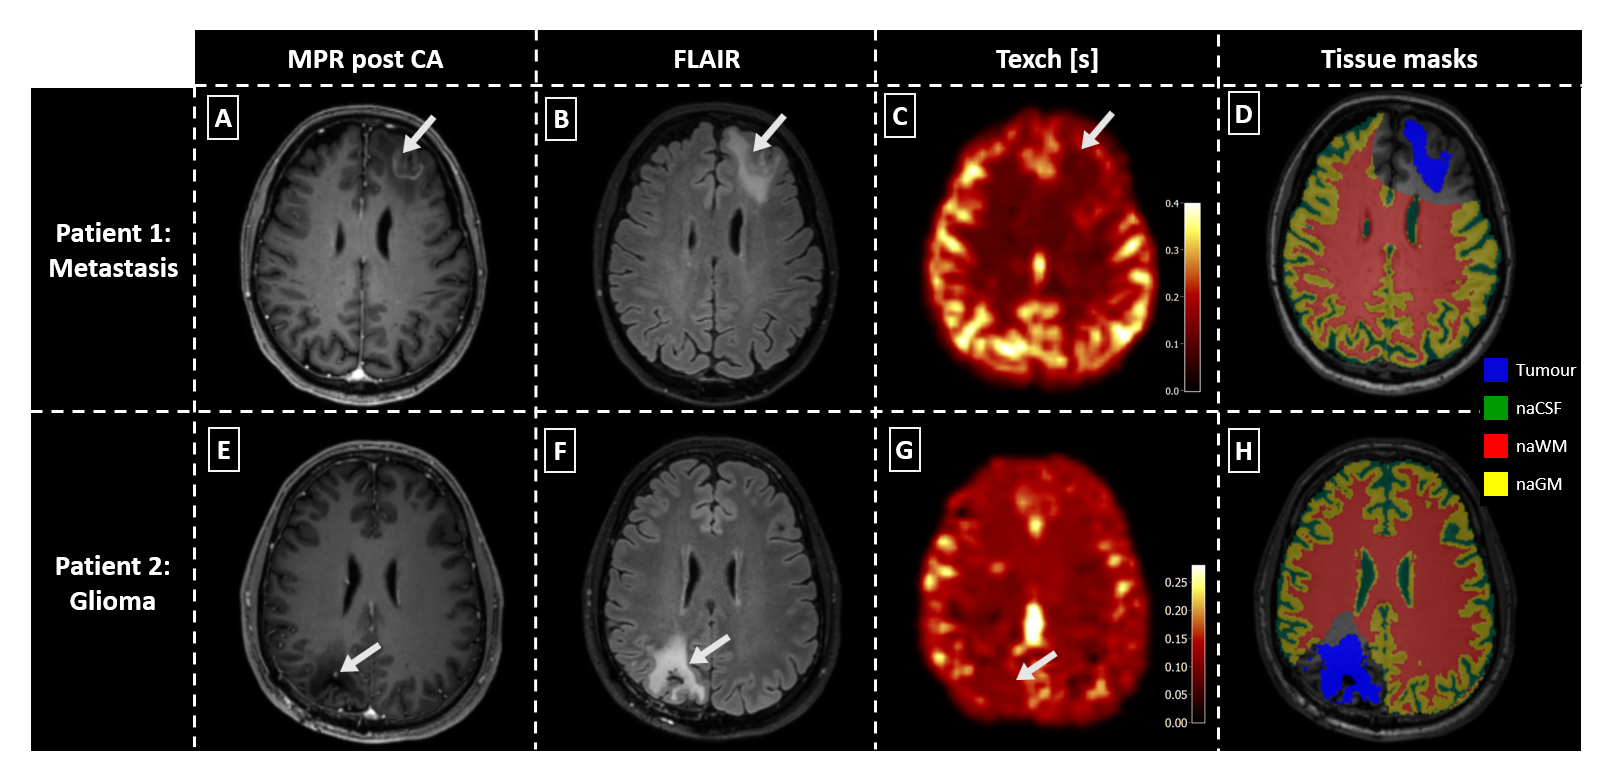
Figure 2: Exemplary
data of two patients. MPRAGE (MPR) post contrast agent (CA, see A,E), FLAIR (B,F), Texch (C,G) and
tissue masks (D,H) are shown. The metastases patient (A-D) shows a rim-like CA
uptake (A) and pronounced edema (B). Texch (C) is visibly reduced in the
tumorous region, especially in contrast to grey matter (GM). The glioma patient
(E-H) shows focal CA uptake (E) and pronounced edema in the border-region of WM
and GM (F). Exchange times are clearly reduced (G). Arrows indicate tumorous
regions.
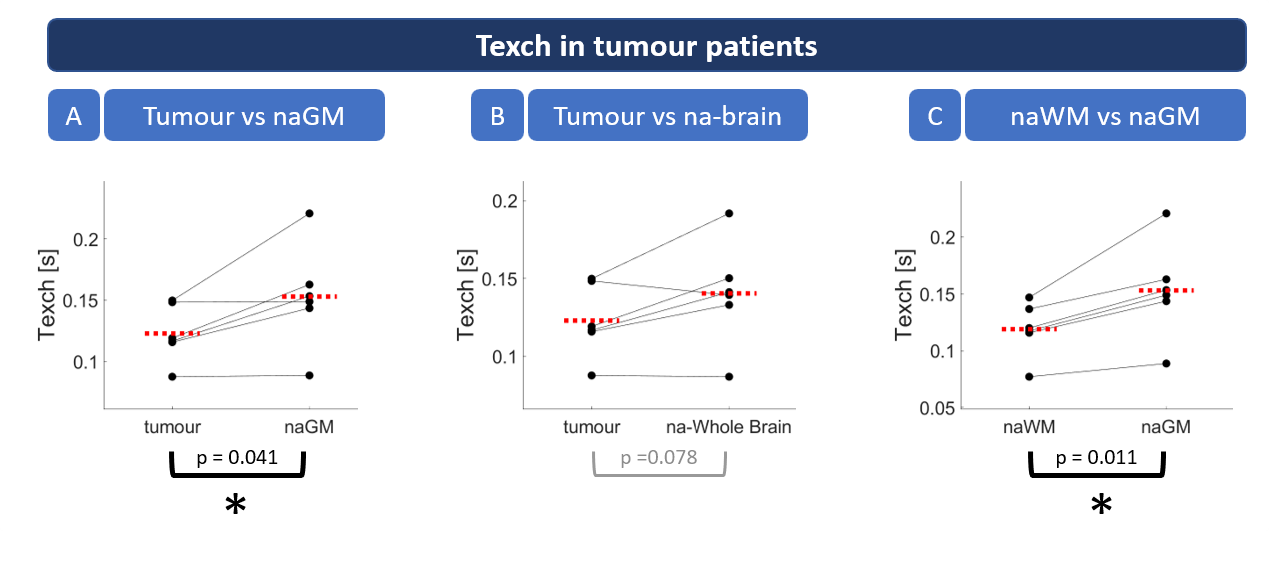
Figure 3: Scatterplots
of regional Texch differences in tumour patients. Dots
represent subject-wise mean values within individual tissue masks. Red dashed
lines indicate group means. Asterisks highlight statistically significant
differences (paired t-test, p<0.05). The
results showed significantly lower Texch
in tumorous tissue compared to normal appearing grey matter (naGM, see A).
Similarly, there was a trend for reduced Texch compared to na-brain tissue (B).
Texch in naWM was significantly lower than naGM, both, for patients (C) and HCs
(not shown).
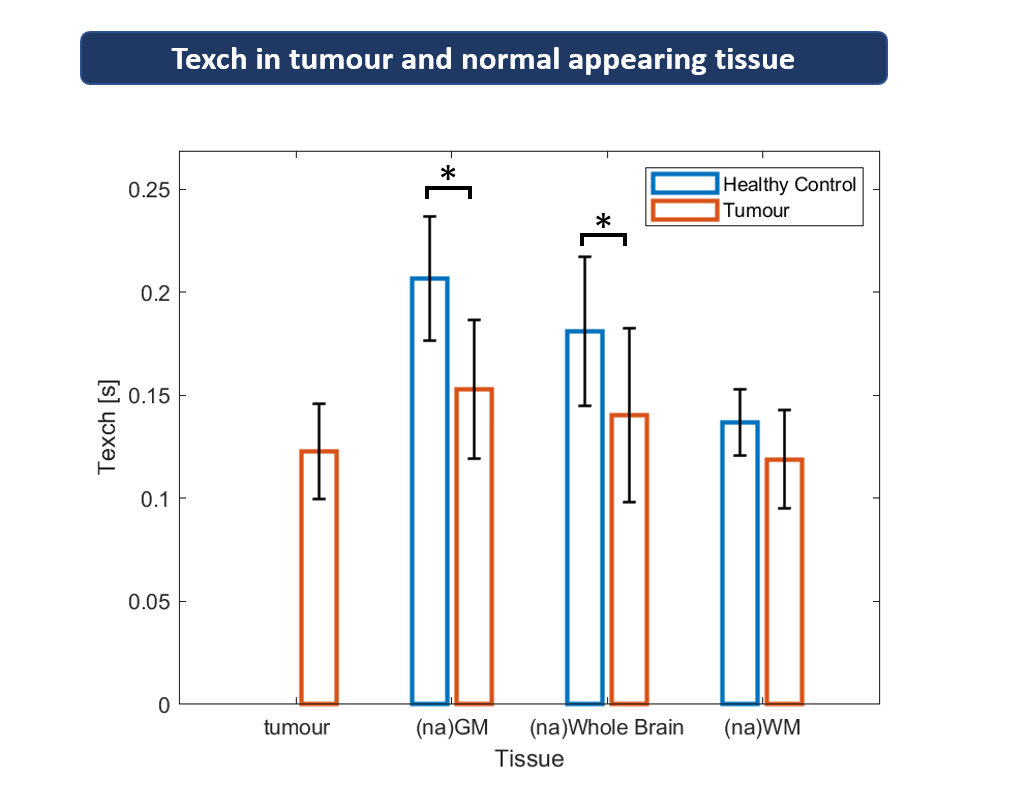
Figure
4: Regional group analyses of Texch comparing
healthy controls (HC) and patients. Exchange times (Texch)
are shown for tumorous tissue, GM, WM, and whole brain. The latter three
were compared between normal appearing (na) tissue in patients and HCs. Bars
show group mean values, error bars indicate standard deviations. Significant
differences between patients and HCs are marked by asterisks (unpaired t-test, p<0.05).
Texch was reduced in tumorous tissue, compared to naGM and whole brain.
Compared to HCs, patients’ Texch was significantly reduced in naGM and whole
brain.
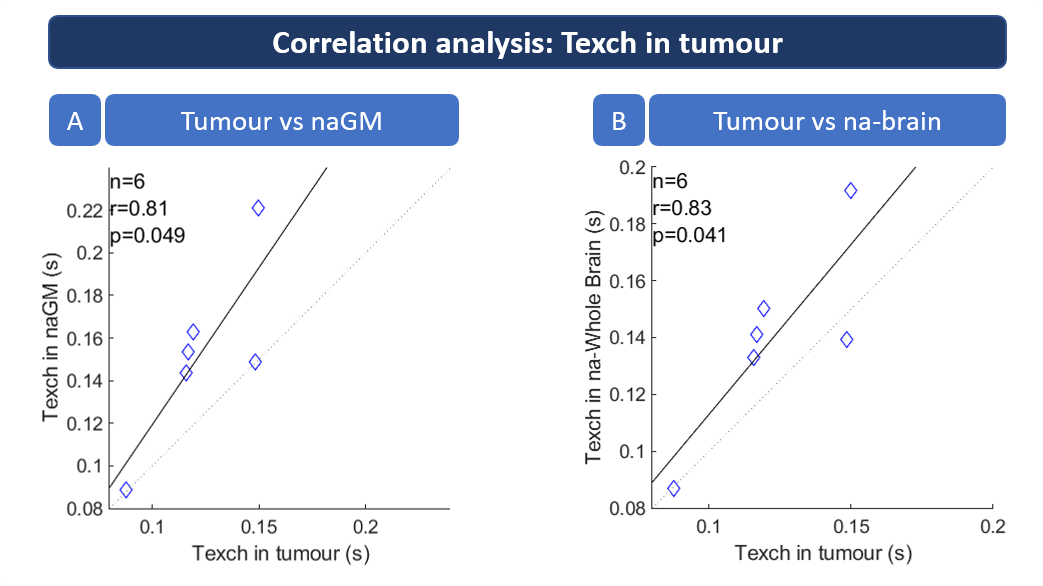
Figure
5: Regional correlation analyses of Texch in tumour patients. Texch values were
correlated between tumorous tissue vs. normal appearing (na) GM (A) and na-whole
brain regions (B). Pearson correlation coefficients r are printed in both
subfigures. The correlations analysis shows strong and significant correlation (p<0.05)
between Texch in tumorous tissue and both naGM (A) and na brain tissue (B).
DOI: https://doi.org/10.58530/2023/0141