0138
Detection and Assessment of Treatment Response in Multiple Myeloma using Whole-body DETECT: Quantitative Biomarkers of MRI and FDG-PET1Radiology, UT Southwestern Medical Center, Dallas, TX, United States, 2Advanced Imaging Research Center, UT Southwestern Medical Center, Dallas, TX, United States, 3Internal Medicine, UT Southwestern Medical Center, Dallas, TX, United States
Synopsis
Keywords: Cancer, Quantitative Imaging, Disease Biomarkers
WBMRI-DETECT has been previously shown to have improved lesion conspicuity and shorter scan times compared to WBMRI-STIR and WBMRI-DWIBS in multiple myeloma. In this work, we demonstrate that quantitative biomarkers measured through WBMRI, fat fraction (FF) and apparent diffusion coefficient (ADC), have weak correlation suggesting both biomarkers to provide complementary information. Additionally, both ADC and FF showed negative correlation with the semiquantitative SUVmax from FDG-PET, demonstrating potential use of quantitative MRI biomarkers for the assessment of therapy response.Introduction
Multiple myeloma (MM) is the second most common hematological malignancy and characterized by significant morbidity that lowers the patient’s quality of life. Almost all MM patients develop bone lesions which lead to unremitting pain, hypercalcemia, and increased incidence of fractures.1 Whole-body [18F] fluorodeoxyglucose positron emission tomography (FDG-PET) is often used for MM assessment,2 but the International Myeloma Working Group (IMWG) currently recommends whole-body MRI (WBMRI) as the preferred imaging modality for pretreatment assessment of MM.3 Current sequences used for WBMRI include Short Tau Inversion Recovery (STIR) and Diffusion Weighted Imaging with Background Suppression (DWIBS). DWIBS demonstrates high lesion contrast and treatment response assessment in MM,2 however, it suffers from geometric distortions that inhibit localization of lesions and prolonged acquisition times. To address these shortcomings, we previously developed a novel dual-echo T2-weighted acquisition for enhanced conspicuity of tumors (DETECT) that suppresses confounding signal from fat and fluid while providing higher signal to noise ratio (SNR), faster scan times, and improved lesion conspicuity compared to WBMRI-DWI without geometric distortions.4 From this ongoing research study, we present our findings on the use of DETECT along with WBMRI-DWI and STIR compared to FDG-PET, especially on quantitative biomarker measurements for MM. Here, we will focus on apparent diffusion coefficient (ADC), fat fraction (FF), and maximum standard uptake values (SUVmax) from FDG-PET, all of which have been shown to predict treatment response in MM.5,6Theory
DETECT utilizes a T2-weighted single-shot turbo spin echo (SShTSE) acquisition with a 2-point Dixon reconstruction4 at two echo times (TE). The Dixon reconstruction provides fat-suppressed water-only images and enables FF quantification. The two TEs allow for fluid suppression using the difference in T2 signal decay between fluid and tissue signal.4Methods
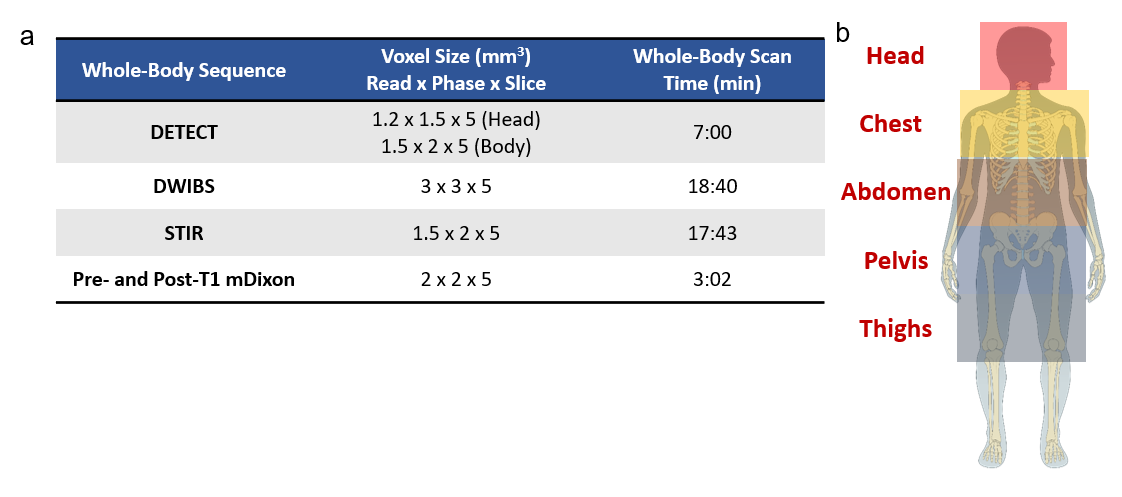
Patients: We recruited adult patients with diagnosed MM and confirmed bone lesions. Patients were imaged using WBMRI sequences (Fig. 1a) and FDG-PET/CT.Imaging Sessions: We performed WBMRI on a 3T Ingenia MR scanner (Philips Healthcare). Each WBMRI session was scanned at five anatomical stations (Fig. 1b) using the following sequences (Fig. 1a): STIR, DWIBS, DETECT, along with pre- and post-contrast 3D T1-mDixon. Approximate imaging parameters are as follows: DETECT - TR/TE1/TE2: 1200/80/340 ms, ΔTE=1.1 ms, FOV = 300x300x245 mm3 (Head), 350x400x245 mm3 (Body), acquired resolution = 1.5x2x5 mm3, total whole body acquisition time = 7:00 min; STIR - TR/TI/TE: 5000/230/40 ms, similar FOV as DETECT, acquired resolution = 1.5x2.2x5 mm3, total whole body acquisition time = 17:43 min; DWIBS: TR/TI/TE: 5000/220/70 ms, similar FOV as DETECT, b = 0/800 s/mm², acquired resolution = 3x3x5 mm3, total whole body acquisition time = 18:40 min; pre- and post-contrast T1 3D FFE mDixon; TR/TE1/TE2: 3.8/1.6/2.6 ms, similar FOV and number of slices to other sequences, acquired resolution = 2x2x5 mm3, total whole body acquisition time = 1:05 min. FDG-PET/CT imaging was performed either on a Discovery MI (GE Healthcare) or Biograph mCT (Siemens Healthineers) within 1 week of WBMRI sessions.
Image Analysis: A radiologist (A.D.) with 11 years of experience identified lesions for the first four subjects. Another radiologist (O.O.) with 31 years of experience identified lesions for five other subjects. FF maps were calculated using the 3D T1-mDixon fat/water separated images due to artifacts from a software update present on DETECT images, which has since been resolved. ADC maps were calculated using b = 0 s/mm² and b = 800 s/mm² images from DWIBS. SUVmax values were calculated using subject dose information with a 3rd party DICOM reader (Medixant). Correlations were performed using simple linear regression between the following pairs: FF and ADC; FF and SUVmax; ADC and SUVmax in lesions identified at baseline.
Results
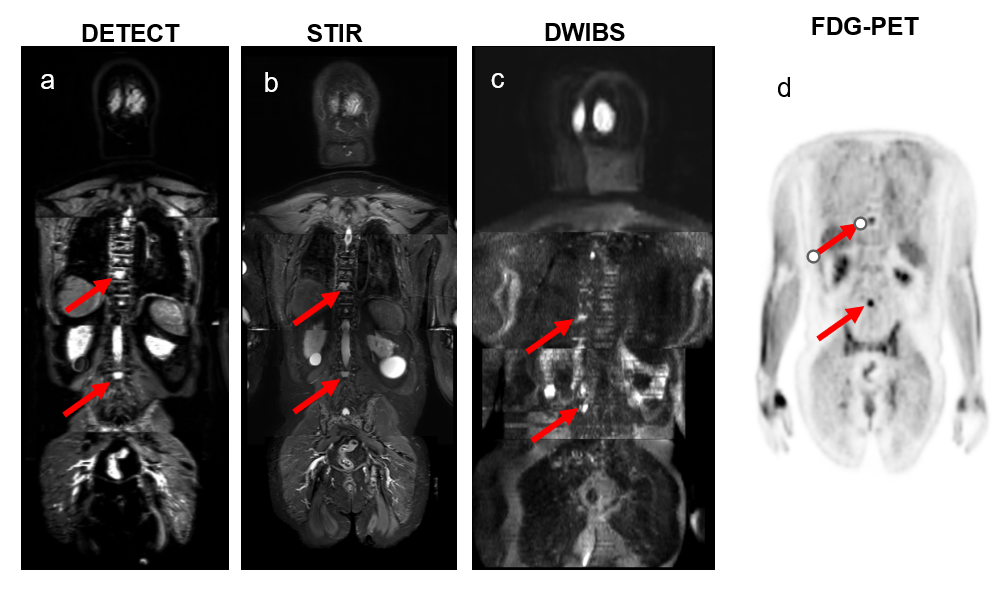
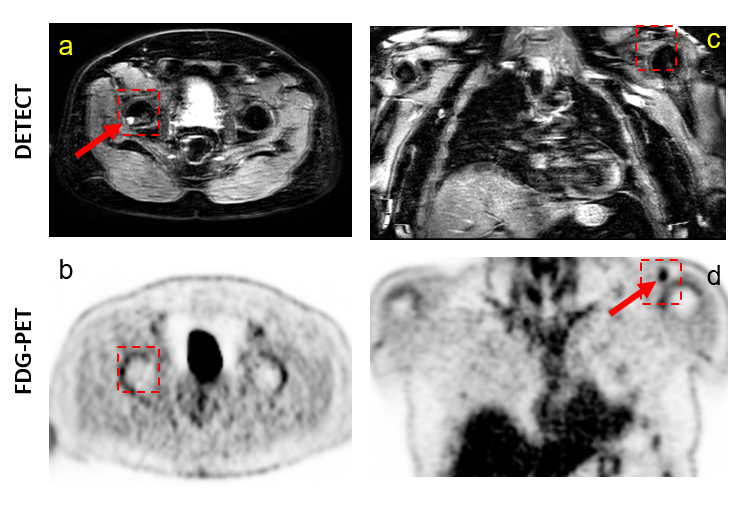
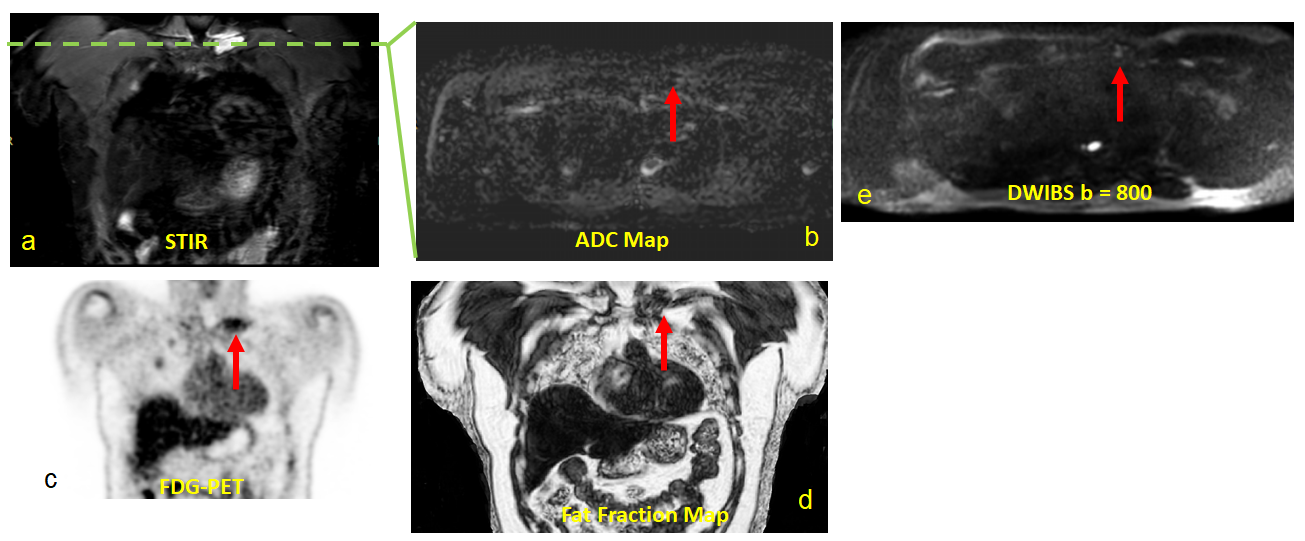
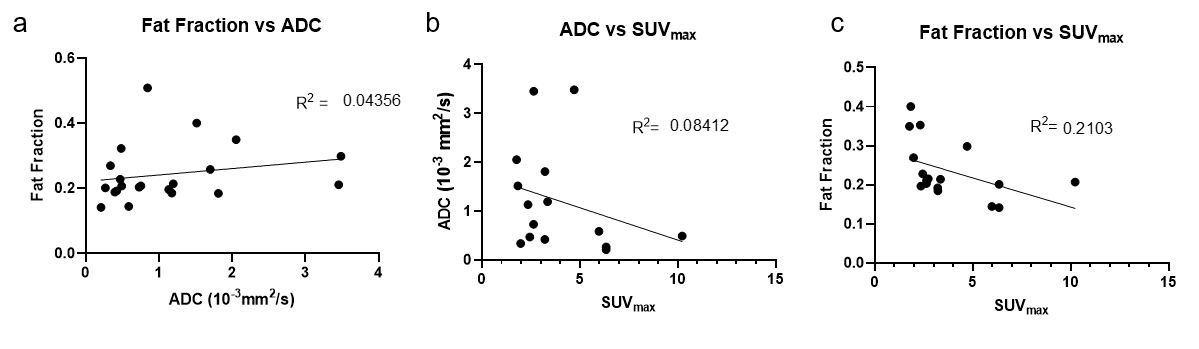
Eleven MM patients have been imaged for this study, with lesions clinically identified on eight subjects. WBMRI-DETECT has better lesion conspicuity than STIR and DWIBS and significantly less geometric distortions than DWIBS (Fig. 2), while also requiring shorter scan times. Approximately 40 lesions were identified across the eight subjects. Examples of lesions found in WBMRI or FDG-PET are shown in Fig. 3, with WBMRI having identified more lesions than FDG-PET in situations where both modalities have been clinically evaluated. Biomarker maps of ADC, FF, and SUVmax (Fig. 4) show examples of an identified lesion. Linear regression of ADC and SUVmax in 21 lesions shows a slight negative correlation (Fig. 5b), while the correlation between FF and SUVmax in 23 lesions shows a stronger negative correlation (Fig. 5c).Discussion and Conclusion
Our results from this ongoing study have shown that WBMRI-DETECT provides higher SNR, improved lesion conspicuity in shorter scan times compared to WBMRI-STIR and WBMRI-DWIBS, and minimal geometric distortions compared to WBMRI-DWIBS. More lesions were uniquely identified in WBMRI when directly compared to FDG-PET in the same subjects. In addition, quantitative FF measurements from WBMRI have been shown to have a weak correlation with ADC, which suggests both biomarkers provide complementary information on MM lesions. Both ADC and FF showed negative correlation with the semiquantitative SUVmax values, demonstrating potential use of quantitative MRI biomarkers for the assessment of therapy response. WBMRI-DETECT can provide FF biomarkers along with substantially improved image quality, and shows promise as a robust and efficient WBMRI sequence for comprehensive treatment planning and assessment of therapy response in MM.Acknowledgements
This work was partly supported by Cancer Prevention and Research Institute of Texas (CPRIT) grant RP190049. The authors thank all patients and volunteers who participated in this study.References
1. Rajkumar, S. V. & Kumar, S. Multiple Myeloma: Diagnosis and Treatment. Mayo Clin Proc 91, 101-119, doi:10.1016/j.mayocp.2015.11.007 (2016).
2. Cavo, M. et al. Role of (18)F-FDG PET/CT in the diagnosis and management of multiple myeloma and other plasma cell disorders: a consensus statement by the International Myeloma Working Group. Lancet Oncol 18, e206-e217, doi:10.1016/S1470-2045(17)30189-4 (2017).
3. Rajkumar, S. V. et al. International Myeloma Working Group updated criteria for the diagnosis of multiple myeloma. Lancet Oncol 15, e538-548, doi:10.1016/S1470-2045(14)70442-5 (2014).
4. Wang, X. et al. Whole-body MRI for metastatic cancer detection using T2 -weighted imaging with fat and fluid suppression. Magn Reson Med 80, 1402-1415, doi:10.1002/mrm.27117 (2018).
5. Jamet, B. et al. Interest of Pet Imaging in Multiple Myeloma. Front Med (Lausanne) 6, 69, doi:10.3389/fmed.2019.00069 (2019).
6. Dong, H. et al. Prediction of Early Treatment Response in Multiple Myeloma Using MY-RADS Total Burden Score, ADC, and Fat Fraction From Whole-Body MRI: Impact of Anemia on Predictive Performance. AJR Am J Roentgenol 218, 310-319, doi:10.2214/AJR.21.26534 (2022).
Figures