0136
Effect of chemoradiation on high-grade gliomas can be forecasted by mid-treatment images via image-driven mathematical modeling
David A Hormuth II1,2, Maguy Farhat3, Julianna Bronk3, Holly Langshaw3, Thomas E Yankeelov1,2,4,5,6,7, and Caroline Chung3
1Oden Institute for Computational Engineering and Sciences, The University of Texas at Austin, Austin, TX, United States, 2Livestrong Cancer Institutes, The University of Texas at Austin, Austin, TX, United States, 3Radiation Oncology, The University of Texas MD Anderson Cancer Center, Houston, TX, United States, 4Biomedical Engineering, The University of Texas at Austin, Austin, TX, United States, 5Oncology, The University of Texas at Austin, Austin, TX, United States, 6Diagnostic Medicine, The University of Texas at Austin, Austin, TX, United States, 7Imaging Physics, The University of Texas MD Anderson Cancer Center, Houston, TX, United States
1Oden Institute for Computational Engineering and Sciences, The University of Texas at Austin, Austin, TX, United States, 2Livestrong Cancer Institutes, The University of Texas at Austin, Austin, TX, United States, 3Radiation Oncology, The University of Texas MD Anderson Cancer Center, Houston, TX, United States, 4Biomedical Engineering, The University of Texas at Austin, Austin, TX, United States, 5Oncology, The University of Texas at Austin, Austin, TX, United States, 6Diagnostic Medicine, The University of Texas at Austin, Austin, TX, United States, 7Imaging Physics, The University of Texas MD Anderson Cancer Center, Houston, TX, United States
Synopsis
Keywords: Tumors, Radiotherapy
Technical advances in imaging and radiotherapy in the last decade have motivated the development of patient-specific treatment plans accounting for the underlying tumor biology that ultimately informs treatment efficacy. A fundamental challenge is how to leverage imaging data to optimize patient response to radiotherapy. Towards this end, we have developed an approach to forecast tumor response prior to the conclusion of therapy to enable a spatially-resolved map of response to chemoradiation. Our forecasting approach can accurately identify statistically significant changes in cell density that could potentially inform treatment adaptations.Introduction
With the advent of MRI guided radiotherapy (RT) a central question is how to leverage multi-parametric MRI (mpMRI) data to improve patient outcomes. mpMRI provides a rich series of noninvasive measurements reporting on (for example) tumor burden, cellularity, tissue structure, blood flow, and blood volume that may be collected before, during, and after treatment. The combination of these measures can characterize the local tumor environment which fundamentally influences the efficacy of both RT and systemic chemotherapies. However, mpMRI data alone can only assess the current tumor state and cannot predict treatment outcomes or predict how the local tumor environment will evolve in response to treatment. Combining mpMRI data with a biologically-based mathematical model1-2 may enable a computational forecasting approach to spatially map anticipated changes prior to the conclusion of therapy. Furthermore, if personalized prior to the conclusion of RT this computational forecasting approach could facilitate anticipatory treatment adaptation. Towards this goal, we have applied our computational forecast approach to the setting of high-grade glioma patients receiving chemoradiation to evaluate the predictive accuracy of maps of eventual treatment response made after only three weeks of RT.Methods
Experimental details: Longitudinal mpMRI data was collected in thirteen patients with high-grade gliomas as part of a prospective radiotherapy trial at the M.D. Anderson Cancer Center. Patients were imaged prior to RT, weekly during RT, and then at one to three month intervals following RT. The mpMRI protocol consisted of T2-fluid attenuated inversion recovery (FLAIR), T1-weighted with or without contrast, and diffusion imaging. Contrast-enhanced T1-weighted images were collected at the pre-RT, mid-RT (week 3), and at follow-up visits. All images were registered to the pre-RT visit, and the enhancing and non-enhancing tumor burden were segmented using the contrast-enhanced T1-weighted (when available) and T2-FLAIR images, respectively. Additionally, the apparent diffusion coefficient (ADC) obtained from diffusion imaging was used to estimate tumor cell count within the enhancing tumor region.Computational forecasting approach: To enable forecasts of chemoradiation response, patient-specific data consisting of the 3D tumor cell counts before and up to mid-RT were used to individually calibrate a biologically-based mathematical model of tumor growth and response to RT. This approach consists of two coupled 3D partial differential equations (one each for the enhancing and non-enhancing regions of the tumor) with model parameters characterizing tumor cell mobility (or invasion), proliferation, death due to radiation therapy, and death due to chemotherapy1. Using the patient-calibrated model parameters and the mid-RT image, we then predict response for each individual patient at the end of RT as well as at the 1-month follow-up visit. The mathematical model is solved using the finite difference method and implemented in MATLAB (R2021a, Nattick MA).
Validation of forecasted response: To assess the effects of chemoradiation, the observed and predicted ADC at the end of RT and at the 1-month follow-up visit were analyzed to yield functional diffusion maps (fDMs)3 indicating voxels whose ADC value significantly increased, significantly decreased, or experienced no significant change. A threshold of significant change was assigned from the literature4 as +/- 0.40 mm2/ms from the initial ADC value. Sensitivity and specificity analysis was used to evaluate the ability of the computational forecasting approach to accurately predict the observed fDM map by defining a positive result as a decrease in ADC (i.e., an increase in cellularity) and a negative result as an increase in ADC (i.e., a decrease in cellularity). Additionally, the fraction of the tumor with significant increases and decreases was compared between the observation and the forecasted fDMs and compared by calculating the Pearson correlation coefficient (PCC) and concordance correlation coefficients (CCC).
Results
Figure 1 shows the observed and forecasted tumor distribution and fDM analysis for one patient at 1-month post-RT demonstrating strong spatial agreement (Dice value of 0.76 for the decreasing ADC region) between the predicted and observed fDM results. Histograms of fDM analysis also revealed (Figure 2) distinct responses for two cases at the end of RT. Case 1 predominately displayed increases in ADC, whereas Case 2 predominately displayed decreases in ADC. Additionally, a high level of correlation (PCCs > 0.79) and agreement (CCCs > 0.67) were observed between the observed and forecasted tumor volume fractions of fDM status (Figure 3) at the end of RT. Decreased correlation was observed at the 1-month visit (PCCs > 0.63 and CCCs > 0.56). A high level of sensitivity and accuracy (lower quartile, LQ > 0.95) was observed at the end of RT (Figure 4), whereas the LQ for specificity was 0.87. At the 1-month post-RT visit, LQs for sensitivity, specificity, and accuracy were all greater than 0.76.Discussion & Conclusion
In this initial study, we have leveraged patient-specific mpMRI and our biologically-based mathematical model framework to enable a computational forecasting approach to map tumor cell density response at up to 1-month post-radiotherapy. fDM, a biomarker of survival4 was applied to both the observed and forecasted ADC maps and we observed a high level of agreement between the measured and predicted changes. Future studies will explore extending this framework beyond the 1-month visit and to incorporate a larger patient cohort.Acknowledgements
NCI R01CA235800, U24CA226110, U01CA174706, CPRIT RR160005 and CPRIT RP220225. Caroline Chung is supported by the Andrew Sabin Family Foundation Fellowship, MD Anderson Cancer Center Institutional Research Grant and CCSG Radiation Oncology and Cancer Imaging Program, and the Marnie Rose Foundation. T.E.Y. is a CPRIT Scholar in Cancer Research.References
1. Hormuth II DA, Feghali KAA, Elliott AM, Yankeelov T, Chung C. Image‑based personalization of computational models for predicting response of high‑grade glioma to chemoradiation. Scientific Reports. 2021;11:1-14. doi:10.1038/s41598-021-87887-42. Hormuth DA, Farhat M, Christenson C, et al. Opportunities for improving brain cancer treatment outcomes through imaging-based mathematical modeling of the delivery of radiotherapy and immunotherapy. Advanced Drug Delivery Reviews. 2022;187:114367. doi:10.1016/j.addr.2022.114367
3. Moffat BA, Chenevert TL, Lawrence TS, et al. Functional diffusion map: A noninvasive MRI biomarker for early stratification of clinical brain tumor response. Proceedings of the National Academy of Sciences of the United States of America. 2005;102(15):5524-5529. doi:10.1073/pnas.0501532102
4. Ellingson BM, Cloughesy TF, Zaw T, et al. Functional diffusion maps (fDMs) evaluated before and after radiochemotherapy predict progression-free and overall survival in newly diagnosed glioblastoma. Neuro-Oncology. 2012;14(3):333-343. doi:10.1093/neuonc/nor220
Figures
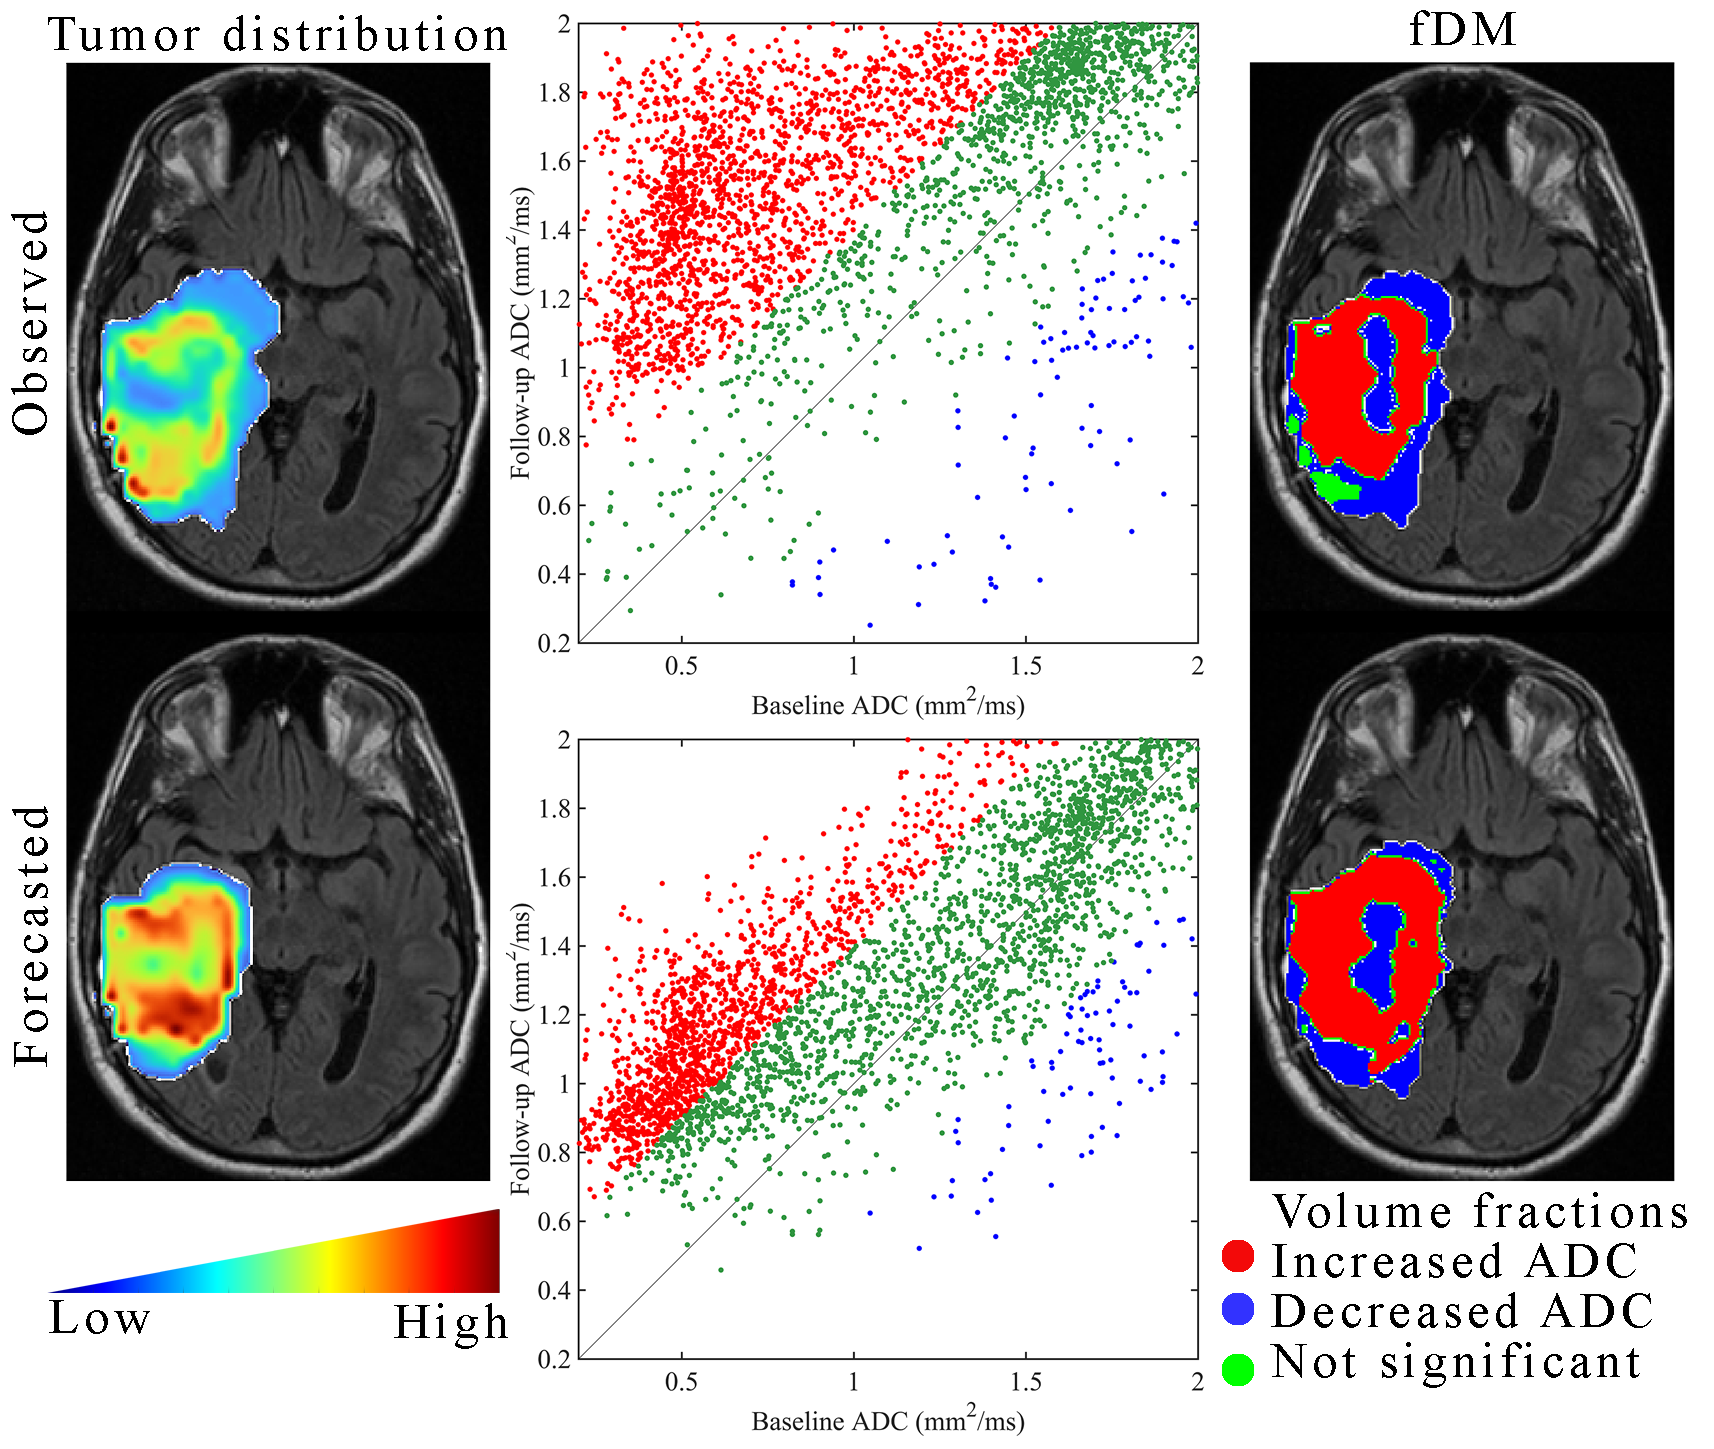
Observed versus forecasted fDMs at 1-month post-radiotherapy. The left column shows the observed (top row) and model forecasted (bottom row) tumor distribution at 1-month post-RT. In the middle column, the corresponding cell density maps are then converted back into ADC to perform the fDM analysis. In the right column, fDM maps are overlayed on the baseline anatomical image to spatially indicate voxels with significantly increased (red), significantly decreased (blue), or no significant change (green) ADCs from baseline to 1-month.
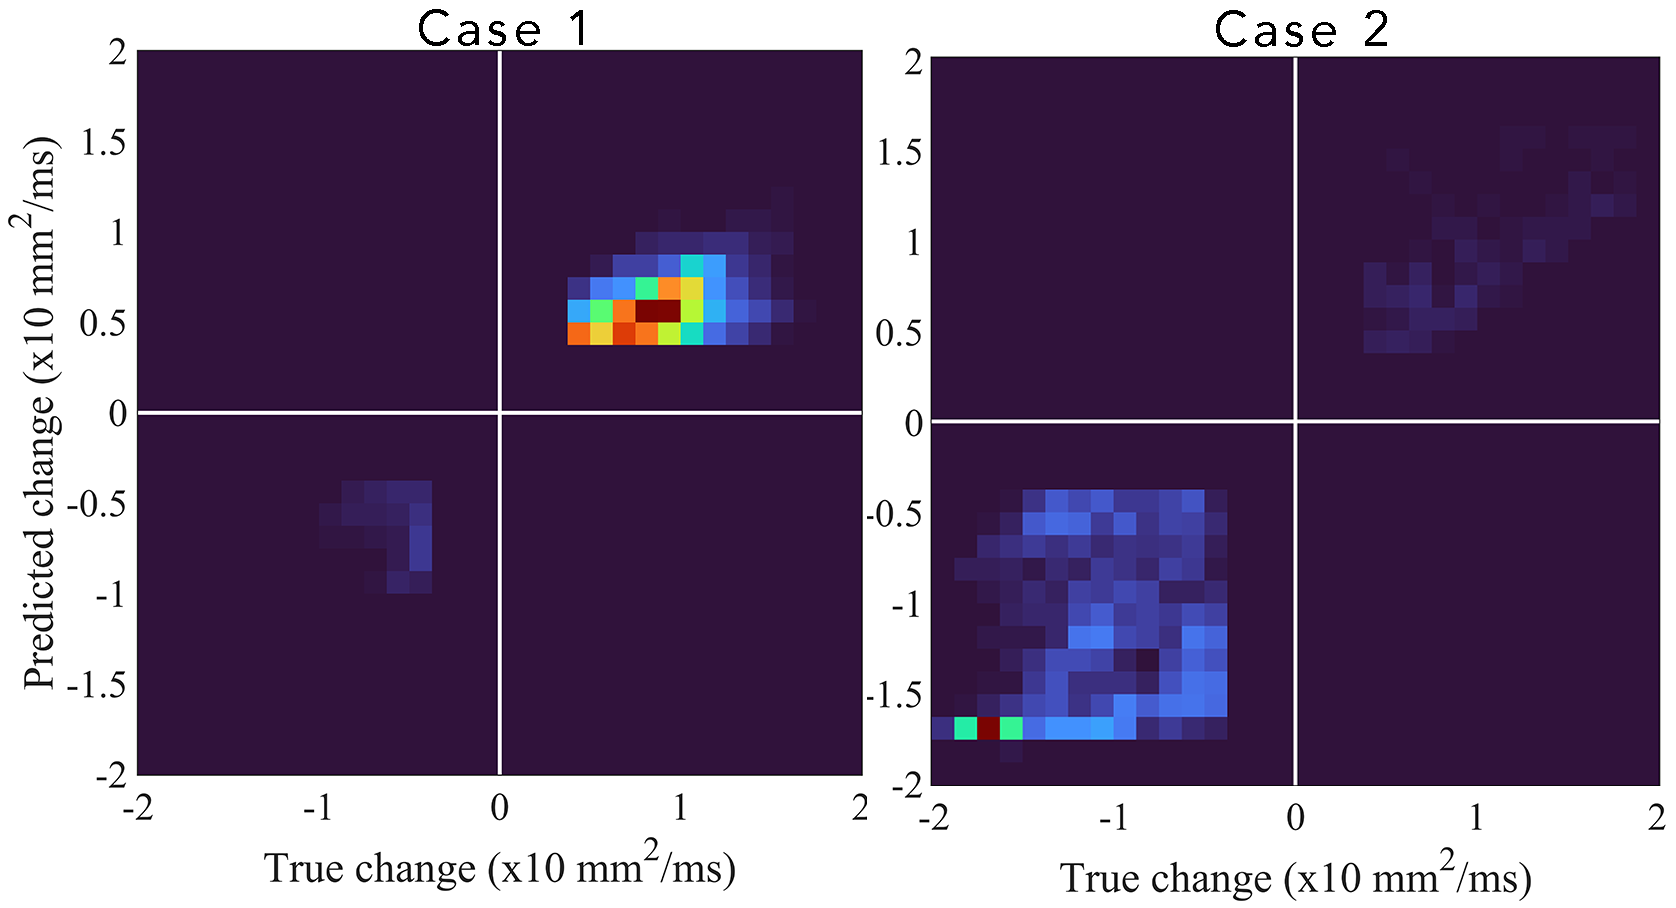
Two dimensional histograms of the predicted versus true (or observed) change in ADC from baseline to end of RT for two cases. Case 1’s histogram was heavily weighted towards an increase in ADC from baseline to post-RT (most weight is in the upper right quadrant) indicating a decrease in tumor cellularity following treatment. Case 2’s histogram, however, was heavily weighted towards a decrease in ADC (most weight is in the bottom left quadrant), indicating an increase in tumor cellularity following treatment.
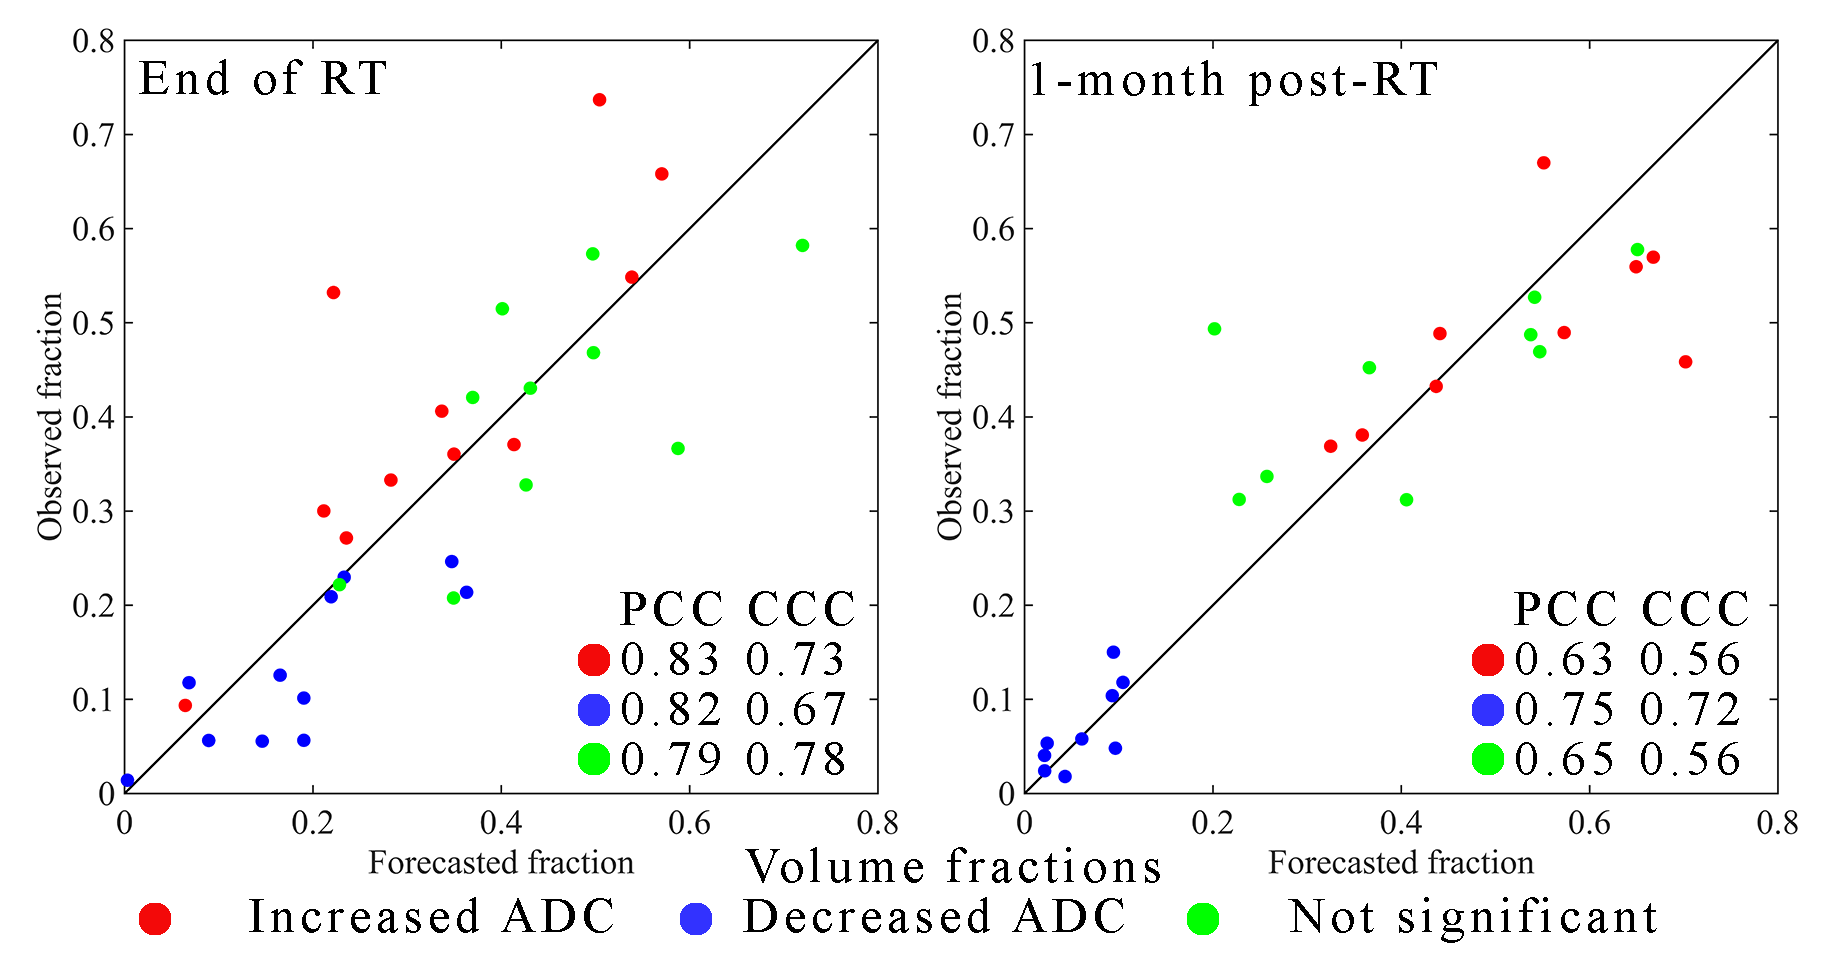
Scatter plots of the observed versus forecasted tumor volume fractions with increased ADC (red), decreased ADC (blue), and no significant change (green) at the end of RT (left plot) and at 1-month post-RT (right plot). The forecasted volume fractions fall close to the line of unity as indicated by CCC values > 0.67. At the 1-month visit, the most accurate volume fraction (PCC and CCC > 0.72) was for the voxels with a decrease in ADC from baseline to post-treatment.
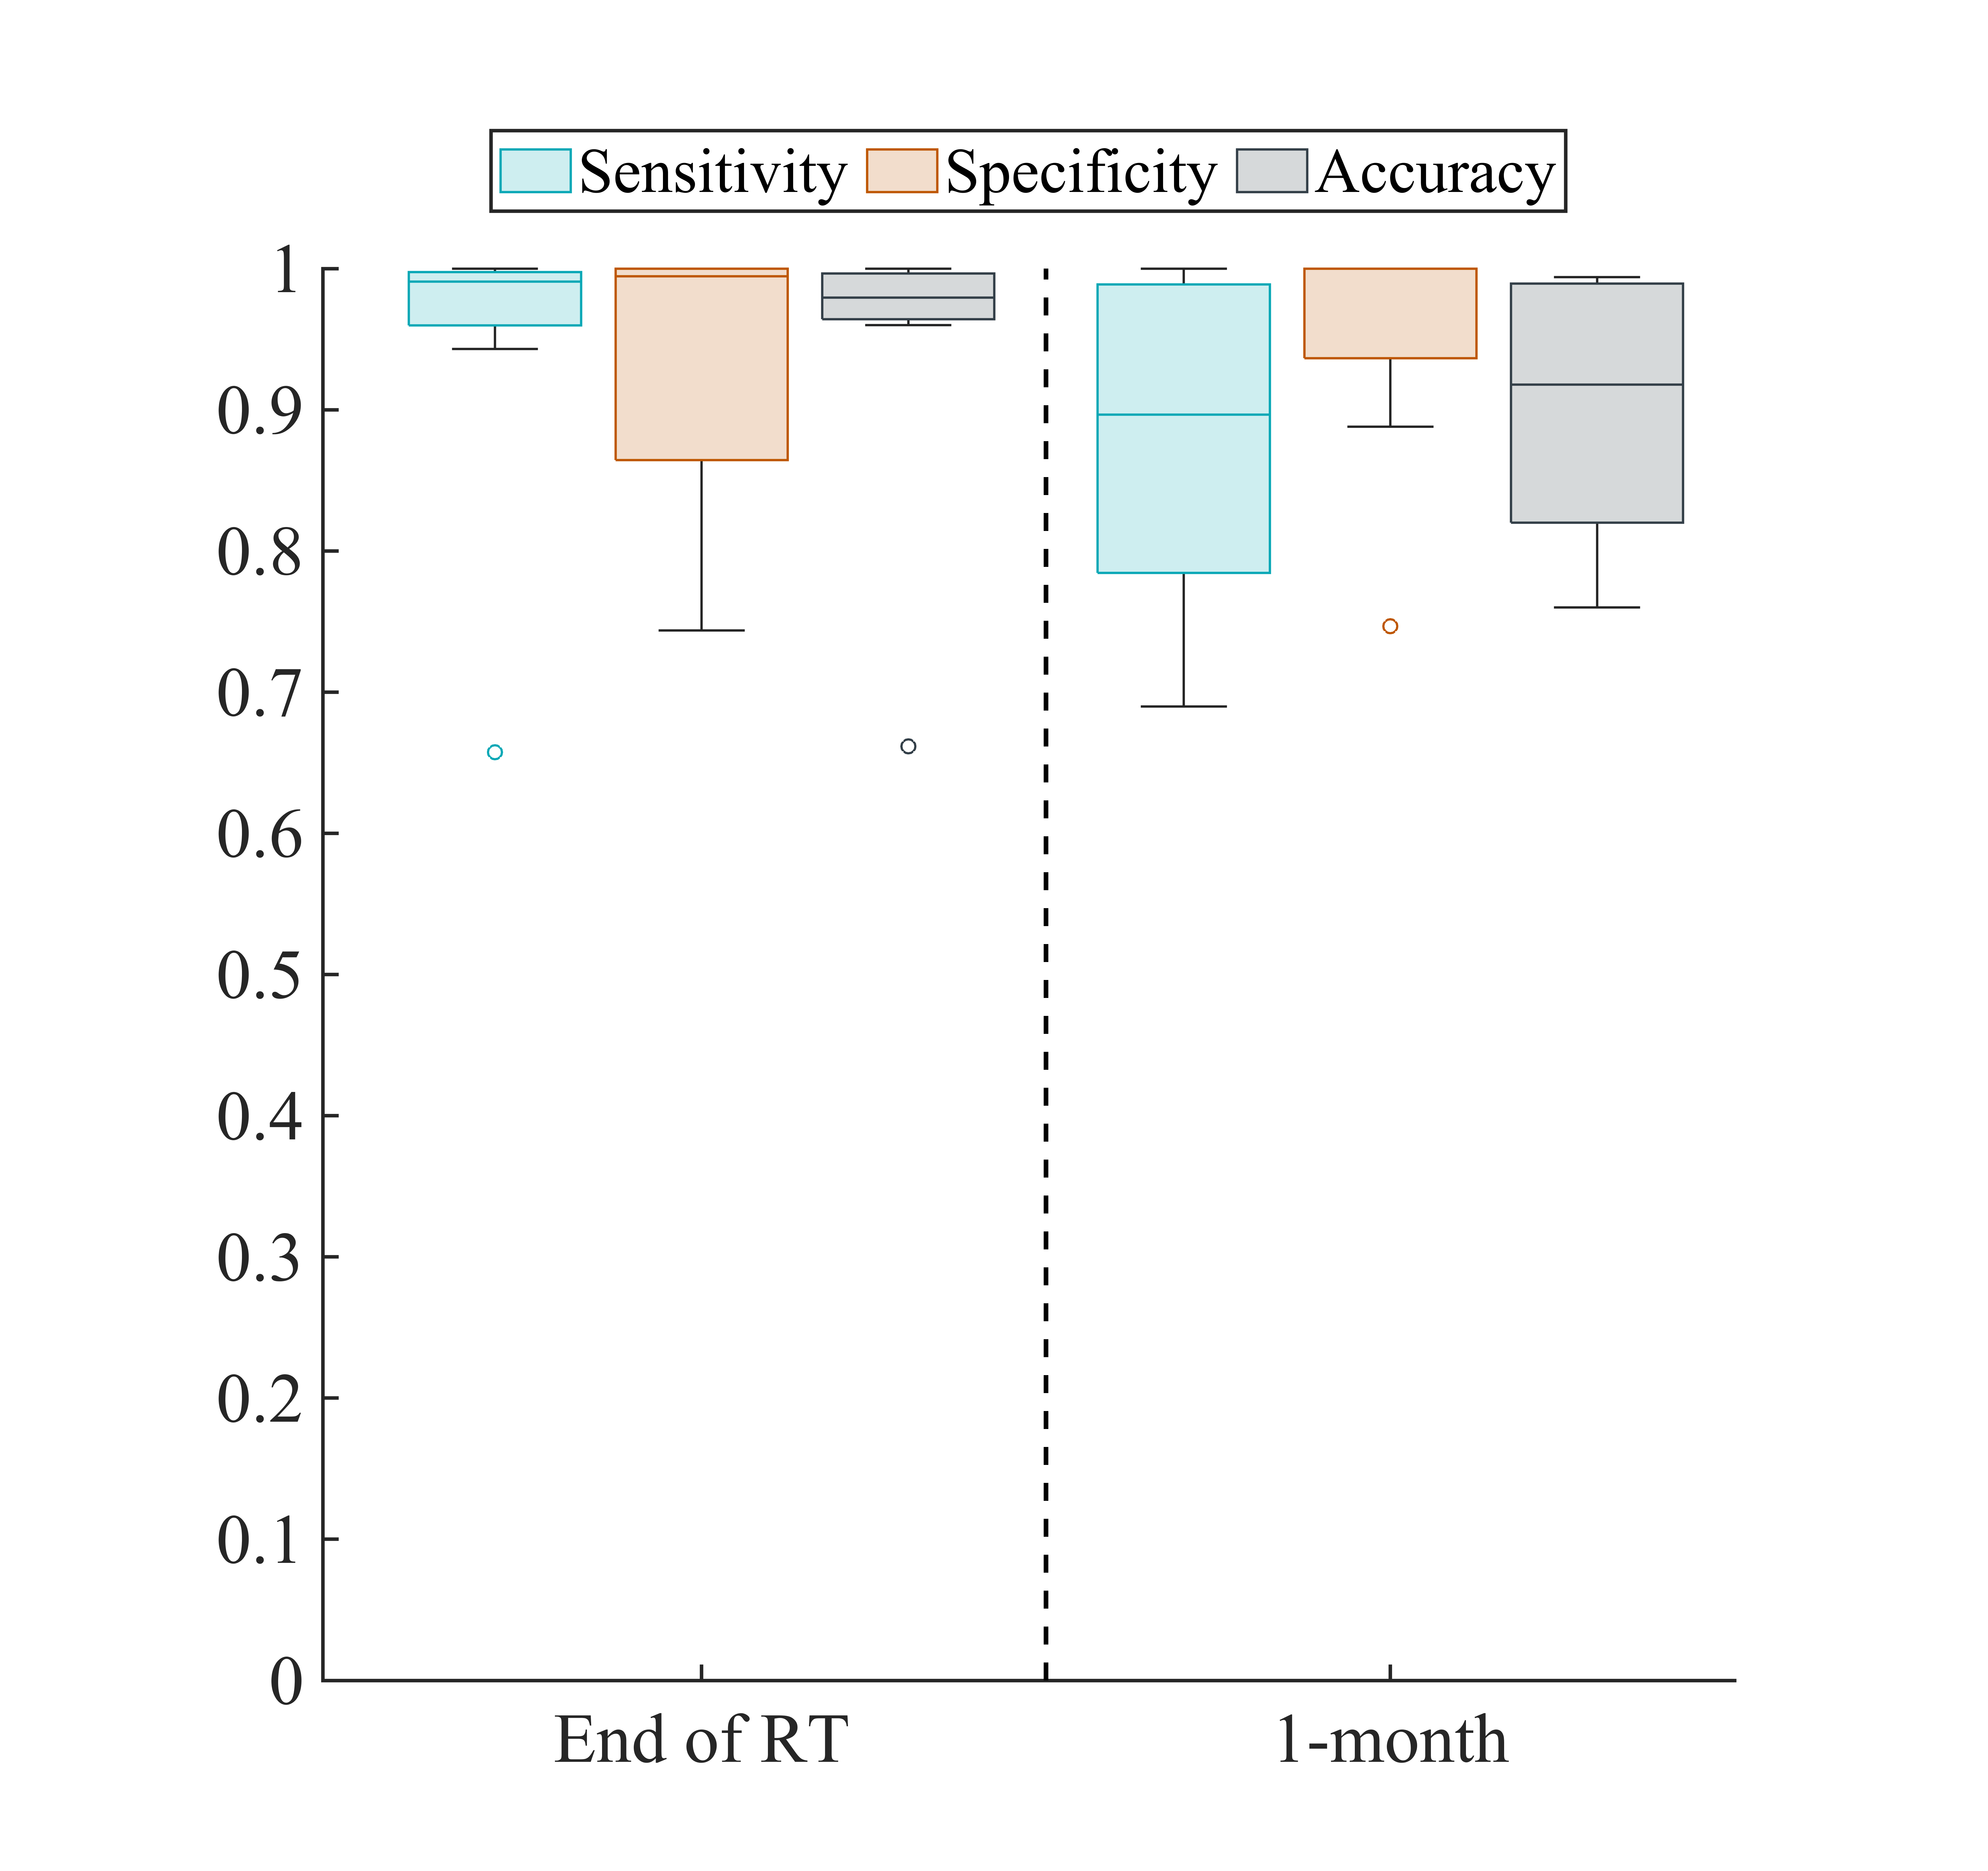
The sensitivity, specificity, and accuracy calculated for forecasted maps of response to chemoradiation as assessed via fDM. The lower quartile (LQ) for all metrics exceeded 0.75. At the end of RT we observed high sensitivity and accuracy, while we had a decreased LQ for specificity (indicating a higher number of false negatives). At the 1-month post-RT visit we observed a reduced LQ for sensitivity and accuracy (indicating a higher number of false positives).
DOI: https://doi.org/10.58530/2023/0136