0135
T2* assessment of neoadjuvant radiation therapy combined with pharmacological ascorbate in extremity soft-tissue sarcomas: a pilot study1Department of Radiology, The University of Iowa, Iowa City, IA, United States, 2Department of Radiation Oncology, Free Radical and Radiation Biology Program, The University of Iowa, Iowa City, IA, United States, 3Department of Internal Medicine, The University of Iowa, Iowa City, IA, United States, 4Department of Orthopedics and Rehabilitation, The University of Iowa, Iowa City, IA, United States
Synopsis
Keywords: Muscle, Tumor, Soft-tissue sarcomas; Treatment assessment; Relaxometry
Soft-tissue sarcomas is commonly treated by neoadjuvant radiation therapy followed by surgical resection. Current assessment of neoadjuvant therapy relies on pathological examinations after surgery. Nonetheless, noninvasive imaging assessment can be performed before and during the treatment, offering the opportunity for predicting and early assessing treatment response. This pilot study applied T2* mapping to evaluate neoadjuvant therapy in seven patients with soft-tissue sarcomas before, during the treatment, and before surgery. The results showed strong or moderate correlations between T2* measurements and percent necrosis from pathological examinations, suggesting the potential for using T2* mapping to predict and early assess treatment response.INTRODUCTION
Soft-tissue sarcomas are a rare and heterogeneous group of malignant tumors of mesenchymal origin that predominately arise in the extremities or retroperitoneal regions. A common treatment regimen is neoadjuvant radiation therapy (RT) followed by surgical resection. Despite a high risk of acute wound complications, neoadjuvant RT potentially reduces tumor burden, improves limb-sparing resection rates, and leads to a better functional outcome1,6. RT response is typically assessed by pathological examination of tumor necrosis after surgical resection. Noninvasive imaging assessment of neoadjuvant therapy has focused on tumor volume, vascularity, and cellularity using structural images, dynamic contrast-enhanced MRI and diffusion-weighted MRI2-13. However, little is known about the utility of the MR relaxation time T2* in predicting and assessing RT response in soft-tissue sarcomas14. Therefore, this pilot study aims to investigate the feasibility of using T2* mapping to assess neoadjuvant RT combined with pharmacologic ascorbate (P-AscH-) in 7 patients with extremity soft-tissue sarcomas.METHODS
PatientsSeven patients with extremity soft-tissue sarcomas were prospectively enrolled from January, 2020 to December, 2022. All subjects underwent five-week RT (50 Gy/ 25fx) combined with P-AscH- infusions (75 g/infusion three times per week). Surgical resection was scheduled two to four weeks following the completion of RT. Gross estimation of percent necrosis was recorded.
MRI
The imaging protocol consisted of five MRI scans (Fig. 1). One baseline MRI scan was collected two weeks prior to the start of RT. Three on-treatment MRI scans were collected on the same day two weeks after the start of RT combined with P-AscH-. One pre-surgery MRI scan was collected two to four weeks after the completion of RT and one day before surgical resection. Among the seven patients, five patients completed all five MRI scans. Two patients completed only a subset of the five MRI scans (four and three of the five MRI scans).
MRI scans were performed on a 3 Tesla MRI scanner (Siemens TIM TRIO, Erlangen, Germany). The MRI protocol included 3D multi-echo GRE images for T2* measurements. The baseline MRI scan also included post-contrast T1-weighted and T2-weigthed images. The parameters for the 3D multi-echo GRE sequence were: voxel size of 1.2 × 1.2 × 3 mm3, pixel bandwidth of 260 Hz, flip angle of 17°, TR of 80 ms, 8 TEs of 7-56 ms in increments of 7 ms, number of averages: 1.
Analysis
Fitting: T2* maps were generated by fitting a mono-exponential decay to the signals of the multi-echo GRE images using Matlab (Mathworks, Inc.).
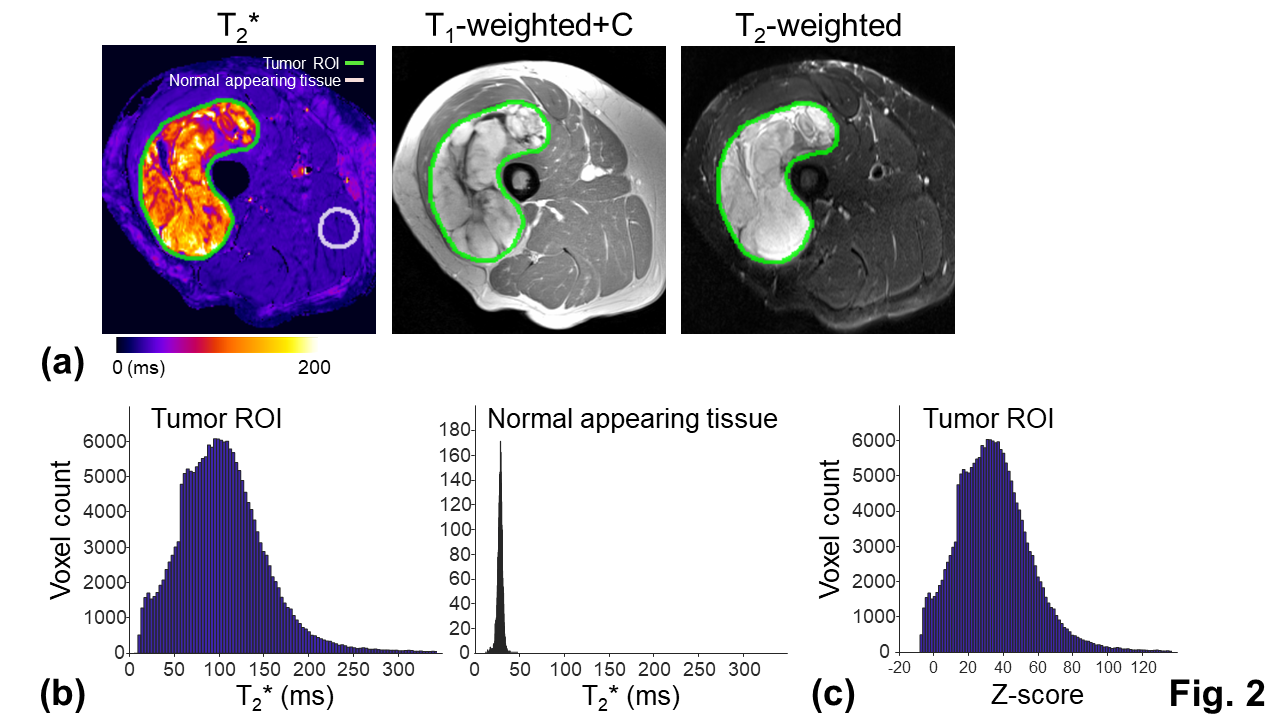
ROI: The tumor ROI was defined as gross regions with abnormal T2* values on the T2* map (Fig. 2a). To account for tumor heterogeneity and minimize inter-subject variability, T2* values within the tumor ROI were normalized to the T2* values within the normal appearing tissue ROI using standardized z-scores15,16 (Figs. 2b and 2c). The normal appearing tissue ROI was selected on a spherical region (15 mm radius) with normal T2* values, avoiding regions treated with RT.
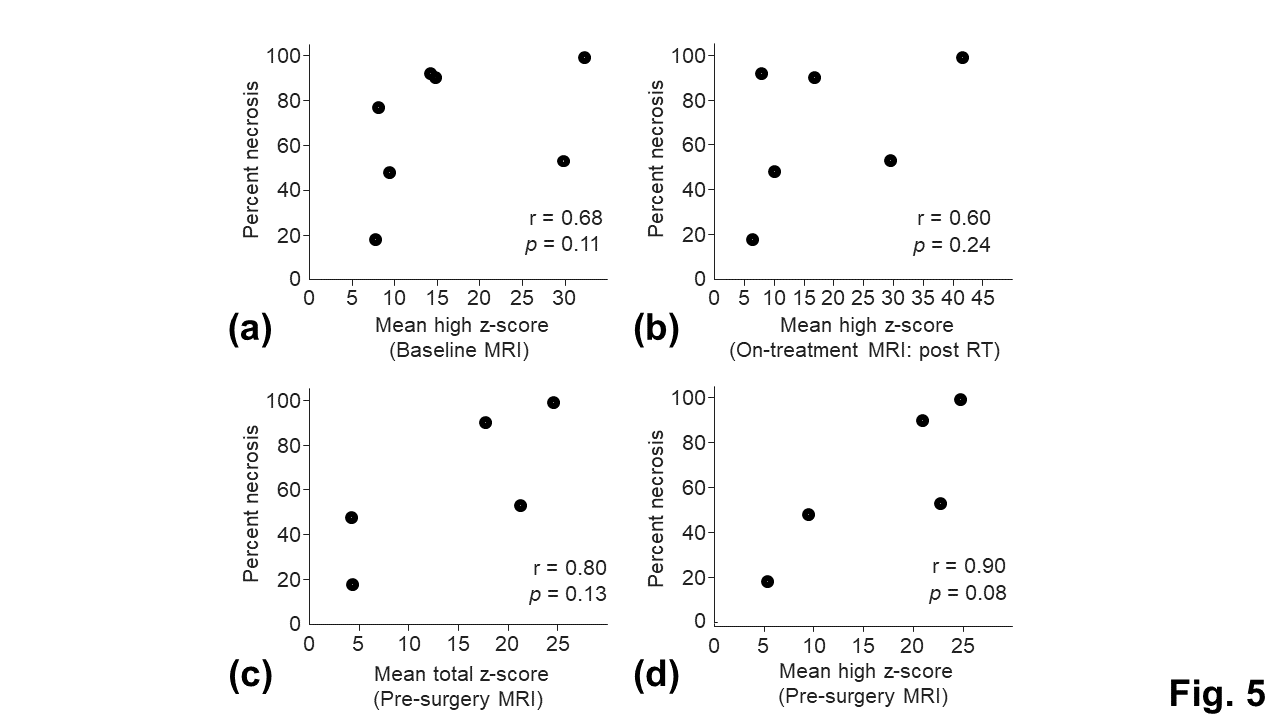
Correlation: The mean z-scores and the means of the significantly high (z-score > 1.96) and significantly low z-scores (z-score < -1.96) within the tumor ROI were correlated with percent necrosis from pathological examinations. The tumor volume and MRI-based percent necrosis, defined on high signals on the T2-weighted images without enhancement, were also correlated with percent necrosis. Correlations were evaluated using the Spearman's rank correlation coefficient r. A correlation was considered as moderate or strong when r is larger than 0.6 and 0.8, respectively17-19.
RESULTS
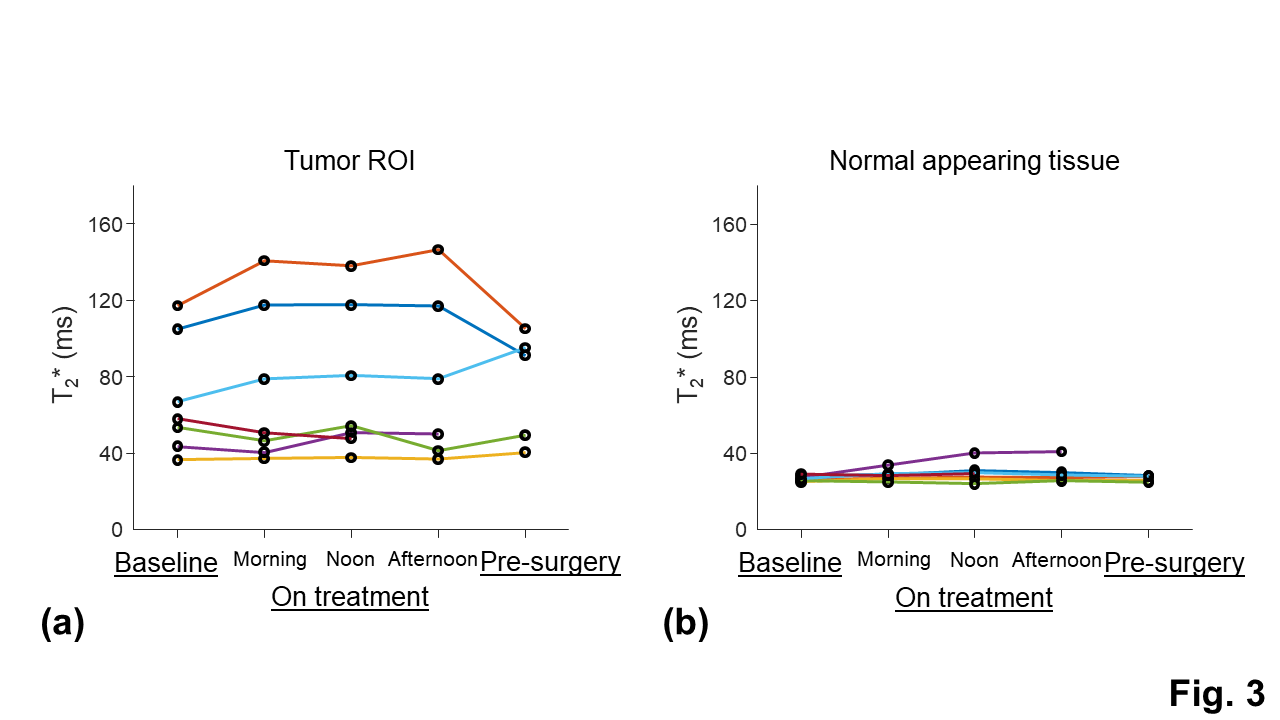
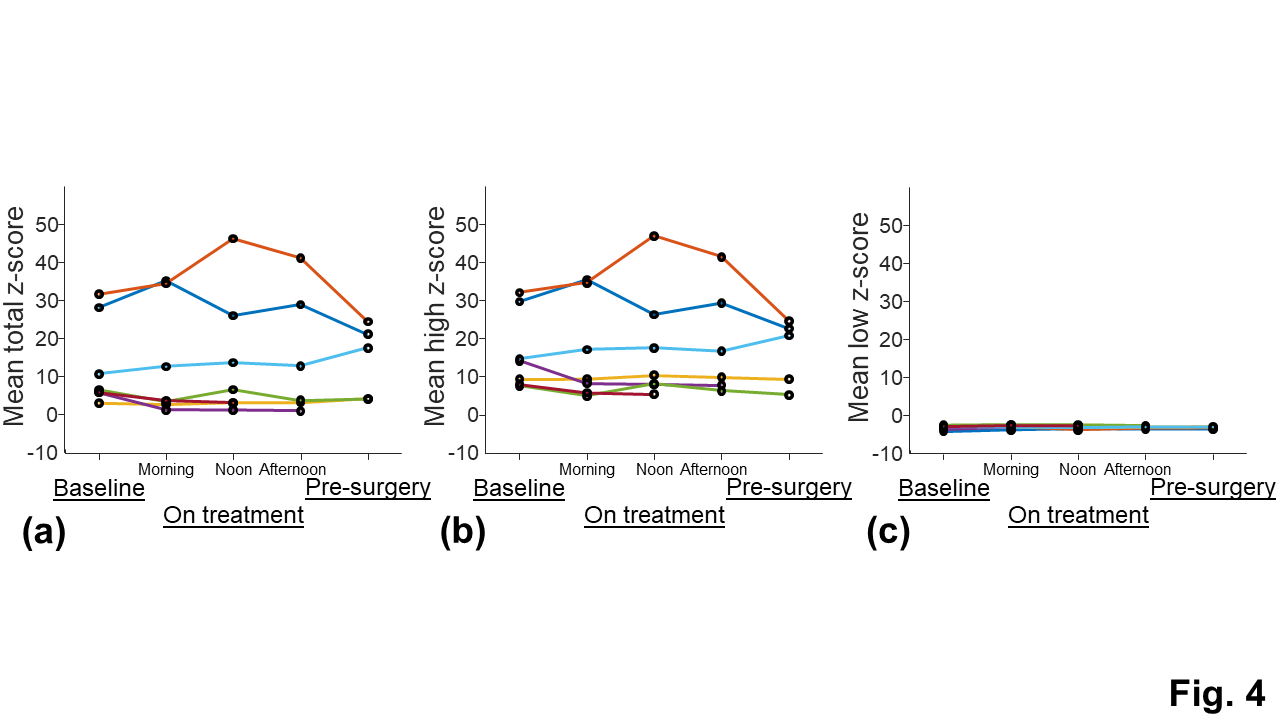
The tumor ROI showed larger inter-subject variation and temporal change of the T2* measurements than the normal appearing tissue ROI, indicating the presence of tumor heterogeneity and treatment-induced tissue changes (Fig. 3). The inter-subject variation and temporal change of the z-scores were mainly contributed by the changes of the significantly high z-scores (Fig. 4). The means of the total and significantly high z-scores of the pre-surgery T2* measurement showed a strong positive correlation with percent necrosis from pathological examinations (Fig. 5c and 5d). The means of the significantly high z-scores of the baseline and on-treatment T2* measurements also showed moderate correlations with percent necrosis (Fig. 5a and 5b). Other parameters, including tumor volume and MRI-based percent necrosis, only showed fair or weak correlations.DISCUSSION
Pathological evaluation of the sarcomas following surgical resection remains the gold standard for assessing the response to neoadjuvant therapy. Alternatively, imaging assessment can be performed before and during the neoadjuvant therapy, providing the opportunity for predicting and early assessing treatment response. This pilot study demonstrated a strong positive correlation between pre-surgery T2* measurements and percent necrosis. Moderates positive correlations were also observed between baseline and on-treatment T2* measurements. These findings are consistent with previously reported long T2 relaxation times and high diffusivity in tumor necrosis11-13, suggesting the presence of freely moving water molecules. Importantly, these findings support the promise of using T2* mapping to predict response to neoadjuvant RT. In addition, early assessment of treatment response may aid in identifying patients to receive alternative therapy and may ultimately help improve the overall survival.CONCLUSION
This pilot study demonstrates that T2* may be useful in predicting and early assessing response to neoadjuvant RT combined with P-AscH- in patients with extremity soft-tissue sarcomas.Acknowledgements
We acknowledge the University of Iowa Holden Comprehensive Cancer Center Sarcoma MOG and NIH (NCI) P01CA217797 for providing funding for this study.References
[1]. Spałek MJ, Kozak K, Czarnecka AM, Bartnik E, Borkowska A, Rutkowski P. Neoadjuvant Treatment Options in Soft Tissue Sarcomas. Cancers (Basel). 2020 Jul 26;12(8):2061.
[2]. Einarsdottir H, Wejde J, Bauer HC. Pre-operative radiotherapy in soft tissue tumors. Assessment of response by static post-contrast MR imaging compared to histopathology. Acta Radiol. 2001 Jan;42(1):1-5.
[3]. Roberge D, Skamene T, Nahal A, Turcotte RE, Powell T, Freeman C. Radiological and pathological response following pre-operative radiotherapy for soft-tissue sarcoma. Radiother Oncol. 2010 Dec;97(3):404-7.
[4]. Miki Y, Ngan S, Clark JC, Akiyama T, Choong PF. The significance of size change of soft tissue sarcoma during preoperative radiotherapy. Eur J Surg Oncol. 2010 Jul;36(7):678-83.
[5]. Delisca GO, Alamanda VK, Archer KR, Song Y, Schwartz HS, Holt GE. Tumor size increase following preoperative radiation of soft tissue sarcomas does not affect prognosis. J Surg Oncol. 2013 Jun;107(7):723-7.
[6]. Tsagozis P, Brosjö O, Skorpil M. Preoperative radiotherapy of soft-tissue sarcomas: surgical and radiologic parameters associated with local control and survival. Clin Sarcoma Res. 2018 Oct 5;8:19.
[7]. Gennaro N, Reijers S, Bruining A, Messiou C, Haas R, Colombo P, Bodalal Z, Beets-Tan R, van Houdt W, van der Graaf WTA. Imaging response evaluation after neoadjuvant treatment in soft tissue sarcomas: Where do we stand? Crit Rev Oncol Hematol. 2021 Apr;160:103309.
[8]. Crombé A, Le Loarer F, Cornelis F, Stoeckle E, Buy X, Cousin S, Italiano A, Kind M. High-grade soft-tissue sarcoma: optimizing injection improves MRI evaluation of tumor response. Eur Radiol. 2019 Feb;29(2):545-555.
[9]. Soldatos T, Ahlawat S, Montgomery E, Chalian M, Jacobs MA, Fayad LM. Multiparametric Assessment of Treatment Response in High-Grade Soft-Tissue Sarcomas with Anatomic and Functional MR Imaging Sequences. Radiology. 2016 Mar;278(3):831-40.
[10]. Messiou C, Bonvalot S, Gronchi A, et. al. Evaluation of response after pre-operative radiotherapy in soft tissue sarcomas; the European Organisation for Research and Treatment of Cancer-Soft Tissue and Bone Sarcoma Group (EORTC-STBSG) and Imaging Group recommendations for radiological examination and reporting with an emphasis on magnetic resonance imaging. Eur J Cancer. 2016 Mar;56:37-44.
[11]. Costa FM, Martins PH, Canella C, Lopes FPPL. Multiparametric MR Imaging of Soft Tissue Tumors and Pseudotumors. Magn Reson Imaging Clin N Am. 2018 Nov;26(4):543-558.
[12]. Dudeck O, Zeile M, Pink D, Pech M, Tunn PU, Reichardt P, Ludwig WD, Hamm B. Diffusion-weighted magnetic resonance imaging allows monitoring of anticancer treatment effects in patients with soft-tissue sarcomas. J Magn Reson Imaging. 2008 May;27(5):1109-13.
[13]. Crombé A, Marcellin PJ, Buy X, Stoeckle E, Brouste V, Italiano A, Le Loarer F, Kind M. Soft-Tissue Sarcomas: Assessment of MRI Features Correlating with Histologic Grade and Patient Outcome. Radiology. 2019 Jun;291(3):710-721.
[14]. Rodrigues LM, Howe FA, Griffiths JR, Robinson SP. Tumor R2* is a prognostic indicator of acute radiotherapeutic response in rodent tumors. J Magn Reson Imaging. 2004 Apr;19(4):482-8.
[15]. McDonald CR, Delfanti RL, Krishnan AP, Leyden KM, Hattangadi-Gluth JA, Seibert TM, Karunamuni R, Elbe P, Kuperman JM, Bartsch H, Piccioni DE, White NS, Dale AM, Farid N. Restriction spectrum imaging predicts response to bevacizumab in patients with high-grade glioma. Neuro Oncol. 2016 Nov;18(11):1579-1590.
[16]. Kothari P, White NS, Farid N, Chung R, Kuperman JM, Girard HM, Shankaranarayanan A, Kesari S, McDonald CR, Dale AM. Longitudinal restriction spectrum imaging is resistant to pseudoresponse in patients with high-grade gliomas treated with bevacizumab. AJNR Am J Neuroradiol. 2013 Sep;34(9):1752-1757.
[17]. Chan YH. Biostatistics 104: correlational analysis. Singapore Med J. 2003 Dec;44(12):614-9.
[18]. Schober P, Boer C, Schwarte LA. Correlation Coefficients: Appropriate Use and Interpretation. Anesth Analg. 2018 May;126(5):1763-1768.
[19]. Akoglu H. User's guide to correlation coefficients. Turk J Emerg Med. 2018 Aug 7;18(3):91-93.
Figures
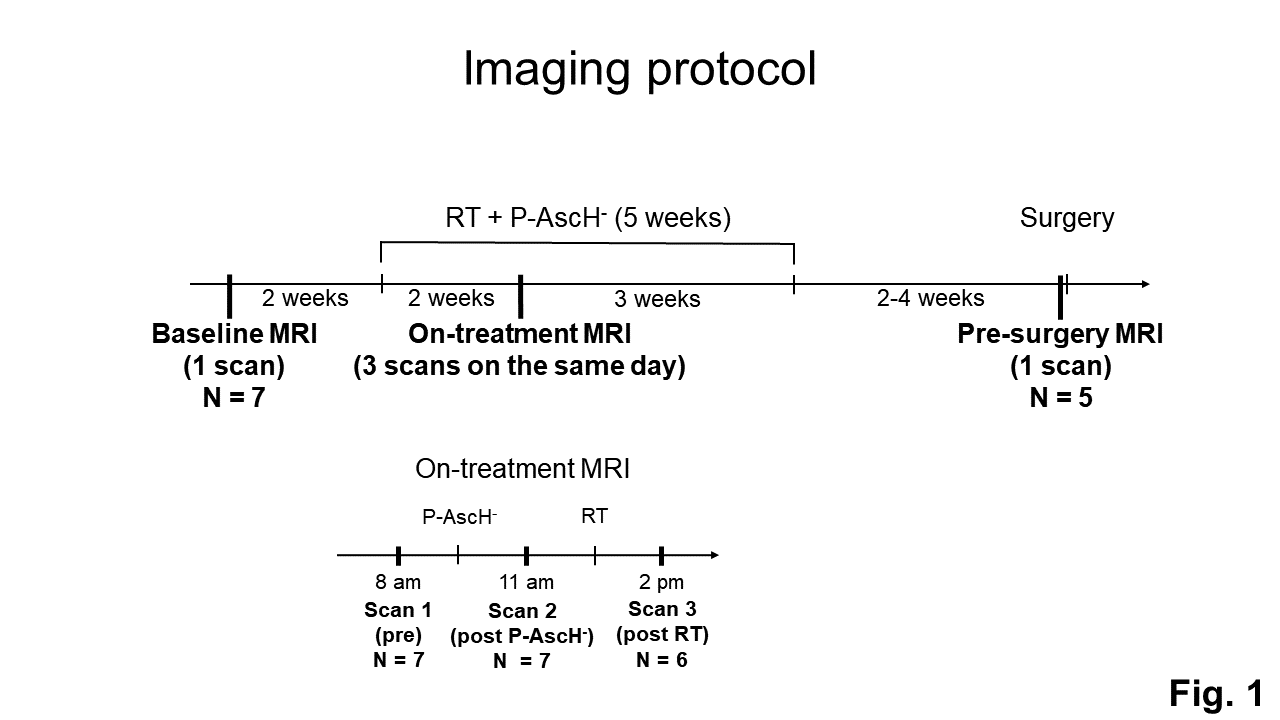
Fig. 1: The imaging protocol consisted of five MRI scans. One MRI scan was collected before treatment (baseline MRI). Three MRI scans were collected two weeks after the start of five-week RT+P-AscH- treatment (on-treatment MRI); one before the daily therapy (pre), one after P-AscH- treatment (post P-AscH-), and one after RT (post RT). One MRI scan was collected two to four weeks after the completion of RT and one day before surgical resection (pre-surgery MRI).