0134
Non-invasive characterization of response of breast cancer to paclitaxel chemotherapy using MR cell size imaging
xiaoyu jiang1, Jingping Xie2, John Gore2, and Junzhong Xu3
1Radiology, Vanderbilt University Medical Center, nashville, TN, United States, 2Vanderbilt University Medical Center, nashville, TN, United States, 3Vanderbilt University Medical Center, Brentwood, TN, United States
1Radiology, Vanderbilt University Medical Center, nashville, TN, United States, 2Vanderbilt University Medical Center, nashville, TN, United States, 3Vanderbilt University Medical Center, Brentwood, TN, United States
Synopsis
Keywords: Quantitative Imaging, Cancer, microstructure; diffusion; apoptosis
Reliable and sensitive methods for assessing the response of breast cancer to treatment are critical for timely adjustments of therapies for individual patients, and development of novel therapies. Different from the conventional tumor-volume-based criteria, we hypothesize that more specific microstructural information on the cellular level in tumors, such as changes in cell size, may provide more accurate characterization of therapeutic response. Using both in vitro cell experiments and in vivo xenograft experiments, we demonstrated that temporal changes in MR-derived cell sizes in triple-negative MDA-MB-231 tumors treated with either drug vehicle or paclitaxel provide a new means to assess treatment response.Introduction
Reliable and sensitive methods for assessing the response of breast cancer to treatment are critical for timely adjustments of the most appropriate therapy for individual patients, and the development of novel therapies. However, conventional MRI methods such as diffusion MRI (particularly ADC: apparent diffusion coefficient) are usually sensitive to various concurrent microstructural changes that may provide misleading or contradictory information. It is of great interest to increase the specificity of imaging methods to key microstructural features reflecting tumor status more accurately. We propose to use change in cell size, a hallmark of apoptosis, as a new imaging biomarker to assess chemotherapy response in breast cancer. Paclitaxel, one of the most successful microtubule-targeted chemotherapeutic drugs, has been reported to slow or block mitosis at the metaphase-anaphase transition and induce apoptosis, which leads to cell shrinkage. We hypothesize that a diffusion MRI-based cell size imaging technique (IMPULSED, Imaging Microstructural Parameters Using Limited Spectrally Edited Diffusion) 1-3 that extracts microstructural parameters, including mean cell size (d) from the diffusion time dependency of hindered/restricted diffusions in tumor tissues, can quantify changes in cell sizes associated with chemotherapy response. This study represents an initial validation of this concept using both in vitro and in vivo models of breast cancer.Theory
IMPULSED is a multi-compartment diffusion-based method within the framework of temporal diffusion spectroscopy (TDS). The imaging protocol includes a combination of acquisitions using gradients with different waveforms (OGSE (oscillating gradient spin echo) for short tdiff (e.g., ≤ 5 ms) and bipolar gradients as in PGSE (pulsed gradient spin echo) or STEAM (stimulated echo acquisition mode) for relatively long tdiff (e.g., ≥ 30 ms)) which provide sufficient coverage of different diffusion times for characterizations of tumor microstructure. Data fittings were performed using an in-house developed software package (https://github.com/jzxu0622/mati.git).Methods
In vitro experiment: We compared MR-derived parameters between drug-vehicle-treated and paclitaxel-treated triple-negative breast cancer cell line MDA-MB-231 with different durations (24, 48, and 96 hours).In vivo experiment: MDA-MB-231 tumors were formed in the right hind limb of mice. After tumor volumes reached ~ 50-100 mm3, twenty-nine mice were treated with either paclitaxel (n=16) or DMSO (drug vehicle, n=13) twice weekly at 20 mg/kg for three weeks. We performed MR cell size imaging weekly on all the mice using a 4.7 T MRI scanner. 9 (5 paclitaxel-treated and 4 DMSO-treated), 6 (4 paclitaxel-treated and 2 DMSO-treated), and 14 (7 paclitaxel-treated and 7 DMSO-treated) mice were sacrificed for histological examinations after MRI sessions at weeks 1, 2, and 3, respectively.
Results
For the in vitro cell experiment, the percentages of G2/M cells increased from 17.2% for DMSO-treated cells to 70.1% for 24-hr-paclitaxel-treated cells, and then decreased to 62.3% and 37% with longer treatment periods (48 and 96 hours). The percentages of sub G0 MDA-MB-231 cells (usually associated with apoptotic cells) increased with increasing treatment periods. The mean cell size of paclitaxel-treated MDA-MB-231 cells, as measured by both light microscope and MRI, increased after 24-hr treatment and then decreased with longer treatment periods (Figure 1). For the in vivo experiment, the paclitaxel-treated tumors showed a small, insignificant increase in cell sizes at week 1 but demonstrated significant decreases in cell size at later weeks, suggesting more apoptosis occurs at later time points (Figure 2). This is consistent with changes in histology-derived cell sizes shown in Figure 3. IMPULSED-derived cell sizes were strongly correlated (the Pearson correlation coefficient = 0.78, p<0.0001) with histology-derived cell sizes. In Figure 4, Caspase-3 staining confirmed the presence of tumor cell apoptosis in paclitaxel-treated tumors and its absence in the DMSO-treated tumor. PH3 staining showed an increase of cells in late G2 and mitosis in paclitaxel-treated tumors. Confluent areas of necrosis can be found within the 3-week paclitaxel-treated tumor with significant loss of nuclei. Na/K-ATPase staining demonstrated different cell sizes between paclitaxel-treated and DMSO-treated tumors. Levels of both apoptosis and mitotic arrest were higher for paclitaxel-treated tumors at week #1, 2, and 3 than those for DMSO-treated tumors (Figure 5).Discussion and Conclusion
We hypothesized that the size of a paclitaxel-treated cell first increases and then decreases, corresponding to mitotic arrest followed by apoptosis. This hypothesis was well-demonstrated by flow cytometry, microscopy and MR results of our in vitro cell experiments. In our in vivo animal experiments, the paclitaxel-treated tumors showed insignificant changes in cell sizes at week 1 but significant decreases in cell size at later weeks. Changes in the mean cell sizes in response to paclitaxel are affected by two competing factors, including the number of cells that are arrested in G2/M phase with cell swelling and cells that undergo apoptosis with cell shrinkage. An explanation for no observed increased cell size at early time points in vivo could be due to the higher heterogeneity of cell cycle activity than in vitro cell culture in which cells are more synchronized. At late time points, apoptosis dominates and significant decreases in cell size were observed. We have described the value of using diffusion MR-derived parameters for the detection of treatment response in a preclinical breast cancer model. Data presented in this study provide compelling evidence to justify the further evaluation of TDS in clinical applications.Acknowledgements
No acknowledgement found.References
1 Jiang, X. et al. Quantification of cell size using temporal diffusion spectroscopy. Magnetic resonance in medicine 75, 1076-1085, doi:10.1002/mrm.25684 (2016).
2 Jiang, X. et al. In vivo imaging of cancer cell size and cellularity using temporal diffusion spectroscopy. Magnetic resonance in medicine 78, 156-164, doi:10.1002/mrm.26356 (2017).
3 Xu, J. et al. Magnetic resonance imaging of mean cell size in human breast tumors. Magnetic resonance in medicine 83, 2002-2014, doi:10.1002/mrm.28056 (2020).
Figures
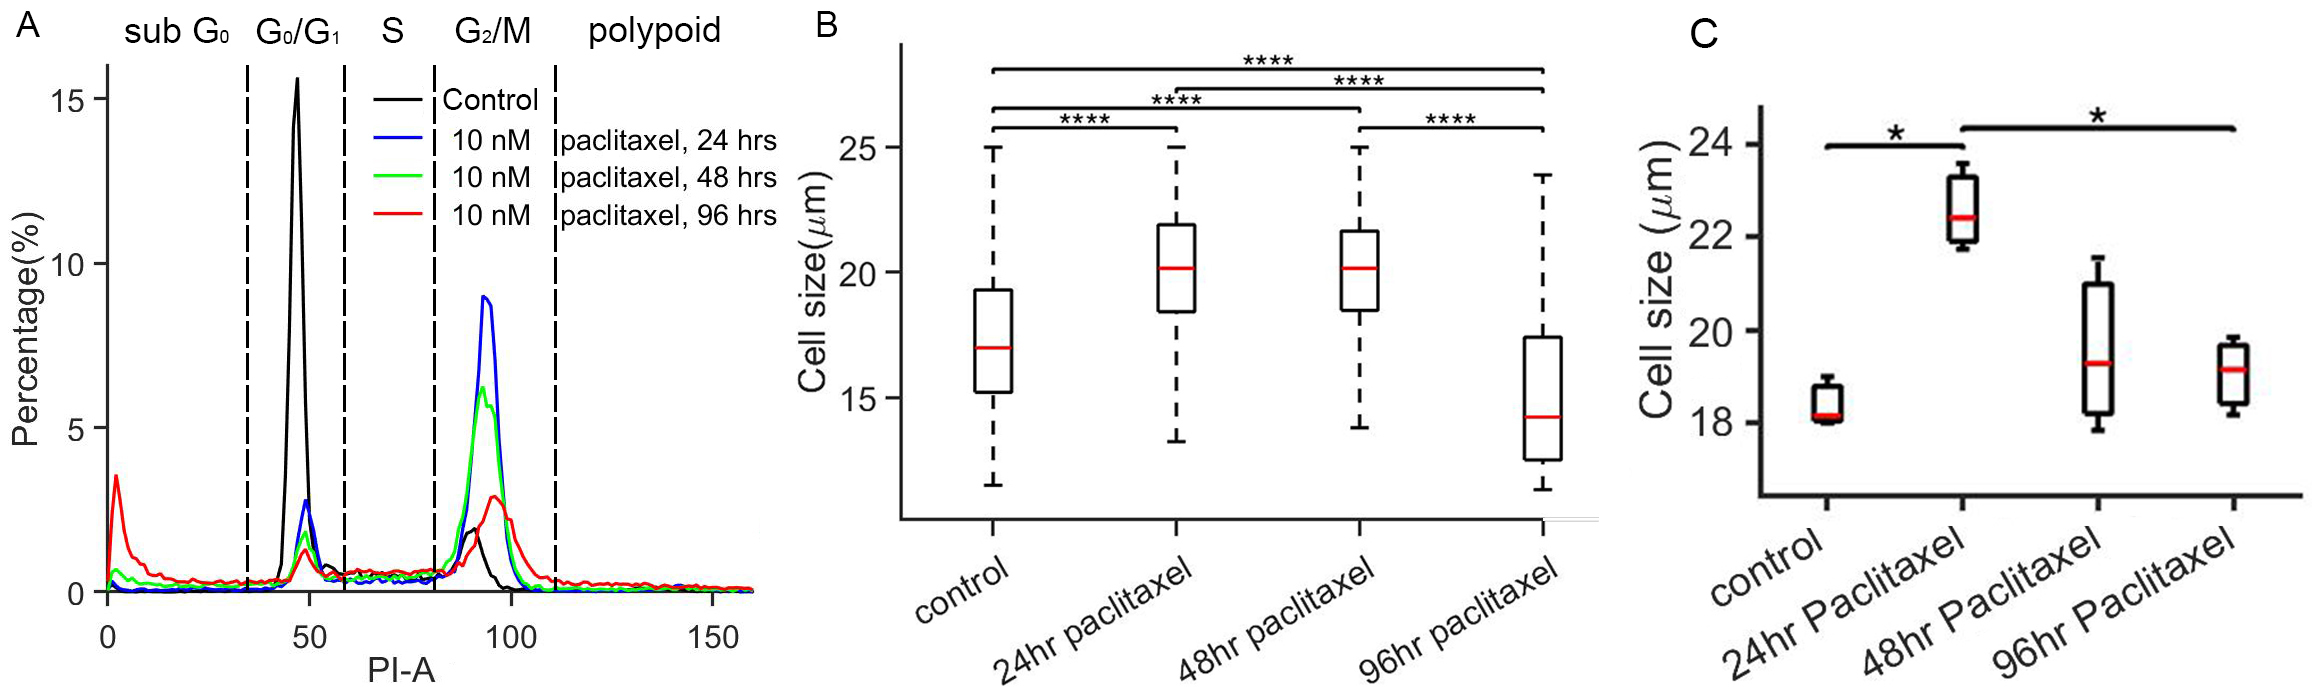
A. Histograms of the
emission light intensity of propidium iodide (PI) labelled non-treated and 10
nM paclitaxel treated MDA-MB-231. B. Box-and-whisker plots of the cell size
measured by light microscopy for non-treated and 10 nM paclitaxel treated
MDA-MB-231. C. The MR-derived cell sizes for non-treated and 10 nM
paclitaxel-treated MDA-MB-231 cell pellets. The sample size of each cohort is
3. ****P<0.0001 as measured by
one-way ANOVA with an FDR (False Discovery Rate) posttest.
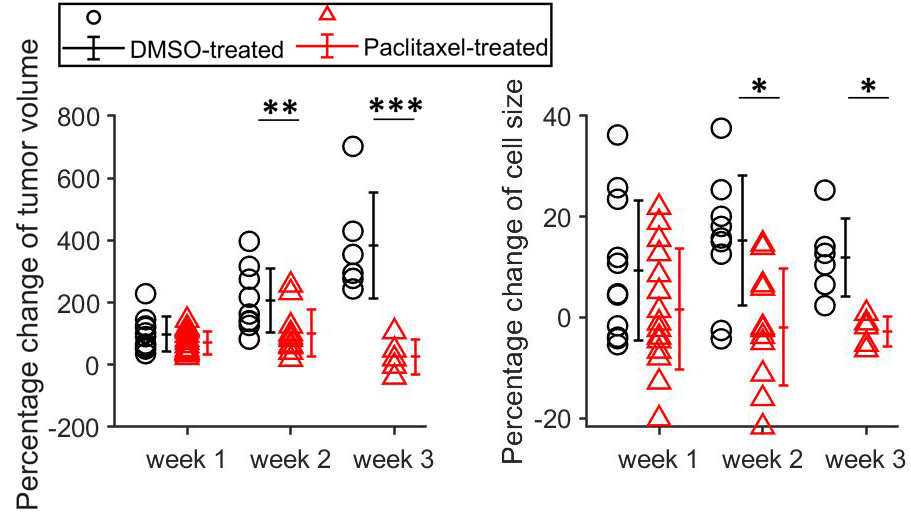
Percentage changes in tumor
volumes and MR-derived cell sizes for DMSO- and paclitaxel-treated tumors at
week 1, 2, and 3. Group means were compared using repeated measures 2-way
analysis of variance with Bonferroni posttests. All the p values were False
Discovery Rate (FDR) adjusted.
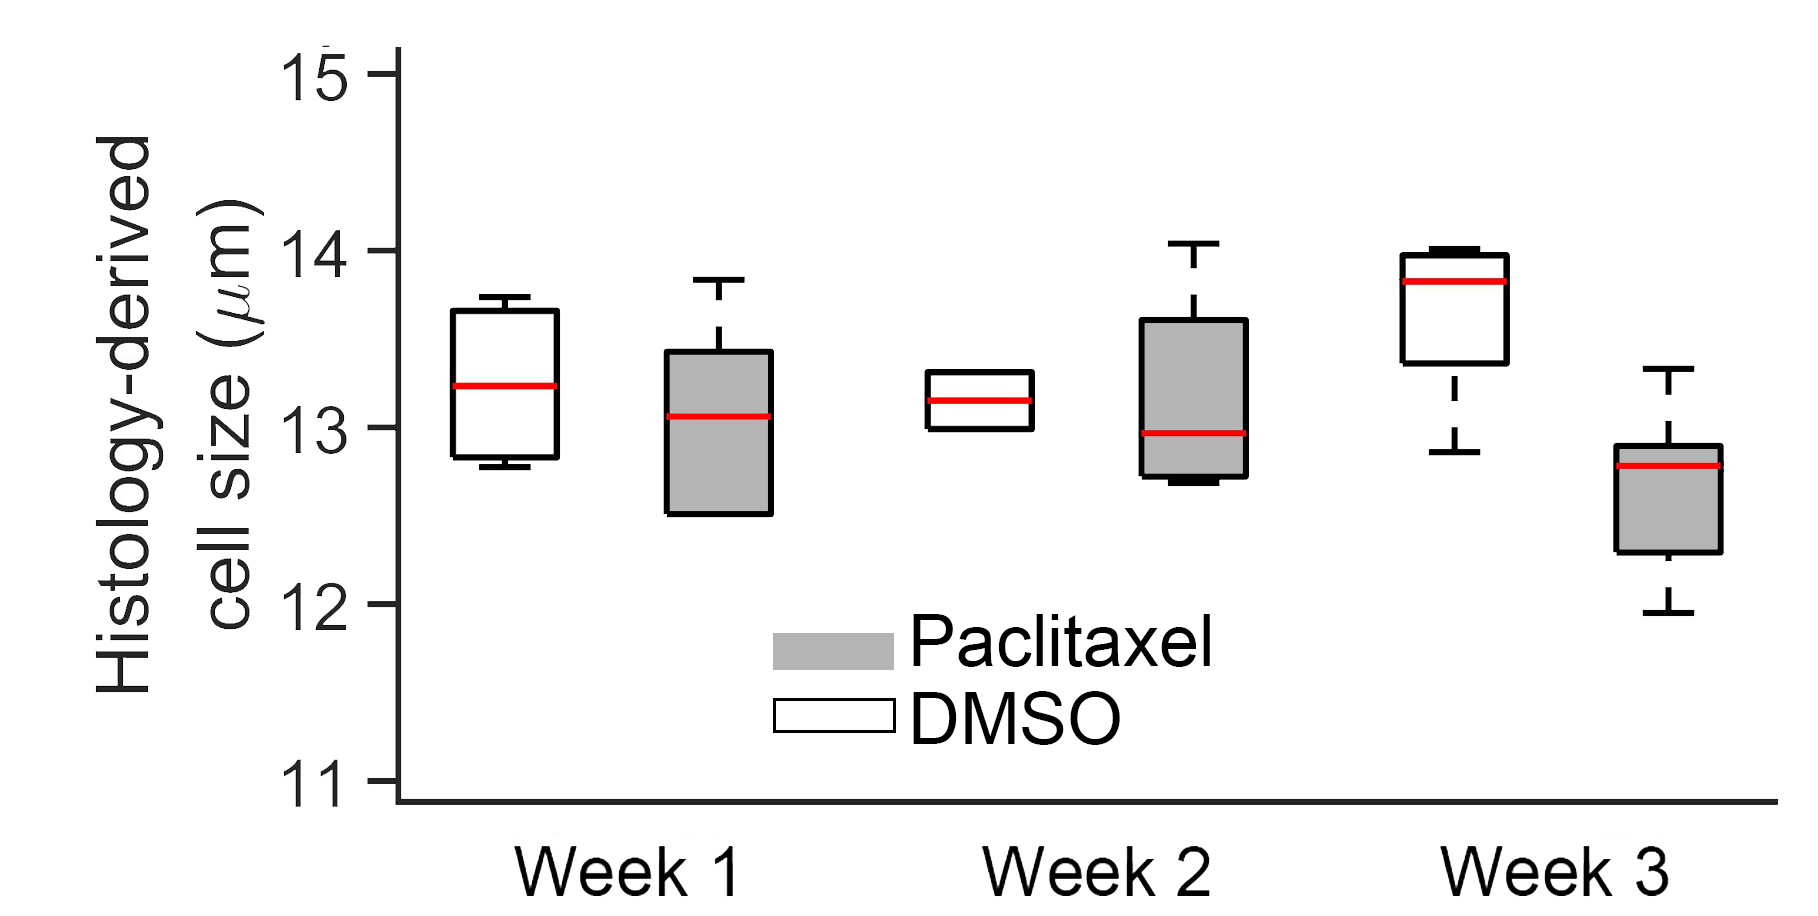
Changes in histology-derived cell sizes for DMSO-treated and
paclitaxel-treated tumors at weeks 1, 2, and 3.
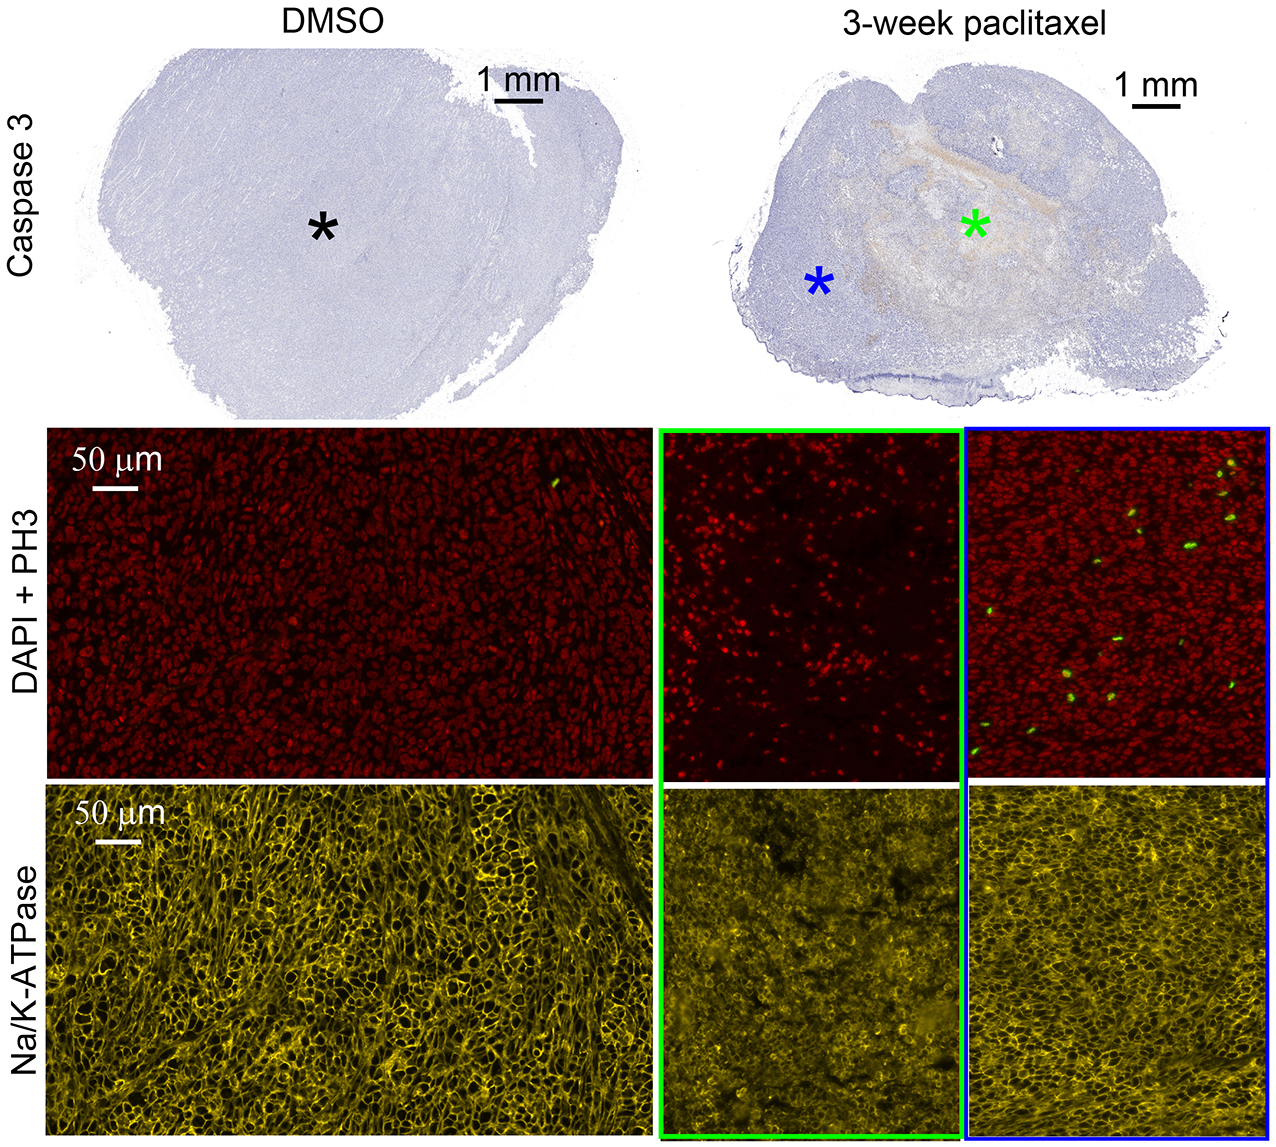
Demonstration of tumor cell
mitosis, apoptosis, and necrosis in vivo. Macroscopic examination and high
power magnification of DAPI, phosphohistone H3 (PH3), and Na/K-ATPase stained
sections of a DMSO-treated tumor, 1-week paclitaxel-treated tumor, and a 3-week
paclitaxel-treated tumor.
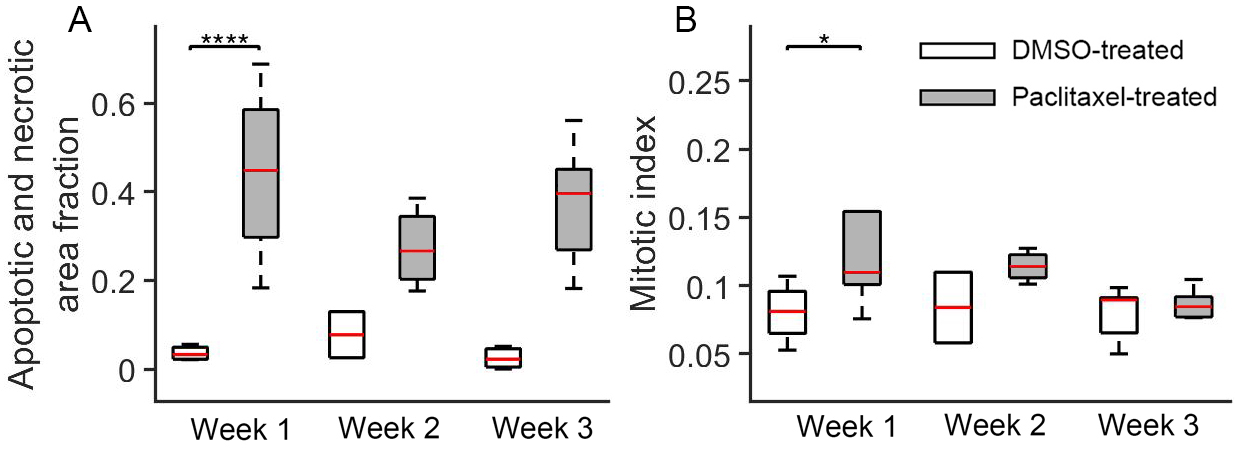
Histology-derived apoptotic
and necrotic area fractions (A) and mitotic cell fractions (B) for DMSO-treated
and paclitaxel-treated tumors at week 1, 2, and 3. Group means were compared
using repeated measures 2-way analysis of variance with Bonferroni posttests.
All the p values were False Discovery Rate (FDR) adjusted.
DOI: https://doi.org/10.58530/2023/0134