0132
Self-supervised pretraining and network ensembling for spatial mapping of treatment-effect in recurrent GBM with physiologic MRI1Radiology and Biomedical Imaging, UCSF, San Francisco, CA, United States, 2Center for Intelligent Imaging, UCSF, San Francisco, CA, United States, 3Graduate Group in Bioengineering, UCSF - UC Berkeley, San Francisco, CA, United States, 4Pathology, UCSF, San Fransisco, CA, United States, 5Neurological Surgery, UCSF, San Francisco, CA, United States
Synopsis
Keywords: Machine Learning/Artificial Intelligence, Modelling
Prior characterization of treatment-effect and tumor recurrence using deep learning approaches have not optimized for spatial classification within a single lesion, which could improve surgical planning and treatment. 10mm patches of pre-surgical anatomical and physiological images surrounding the locations of histopathologically-confirmed tissue samples were used to train our models. Including physiological images, pretraining on unlabeled data in an autoencoding task, and training with an alternative cross-validation approach that enabled many networks to be ensembled, we achieved an ensembled test AUROC of 0.814 and generated spatial maps of tumor probability and model uncertainty. Performance decreased when removing any of these components.Introduction
Non-invasively distinguishing between treatment-induced effects (TxE) resulting from chemo- and radiotherapy and true tumor recurrence (rGBM) for patients with glioblastoma is an ongoing challenge [1,2]. Although deep- and machine-learning models have been previously applied to classify TxE from rGBM on a patient, image, or lesion-level basis [3,4,5], this granularity of classification studies are not optimized to account for within-lesion heterogeneity or spatially highlight regions at higher risk of tumor. Using image-guided tissue samples with known spatial coordinates on pre-operative imaging and deep learning (DL), the goal of this study was to evaluate the benefit of incorporating: 1) physiologic MRI; 2) self-supervised transfer learning (TL); and 3) an alternative splitting and ensembling approach in spatially distinguishing regions of recurrent tumor from treatment-effect and mapping areas of model uncertainty.Methods
Data Acquisition: Multi-parametric MR images (mpMRI) from anatomical, diffusion-weighted, and perfusion-weighted imaging from 103 patients with suspected recurrent glioblastoma were collected on a 3T scanner (GE Healthcare) with 8-channel headcoil at the time of recurrence prior to surgery. Pre- and post-contrast 3D T1-weighted, T2 FLAIR, diffusion-weighted (6 or 24 directions, b=2000 or 1000s/mm2, 1.2mm3 isotropic resolution), and Dynamic Susceptibility Contrast perfusion-weighted (DSC;TR/TE/flip-angle=1250-1500/35-54 ms/30°-35°) images were acquired prior to surgery. 197 tissue samples with recorded spatial coordinates on imaging were collected from these patients and evaluated histopathologically for the presence of rGBM (143 samples) or TxE (54 samples).Image Processing: Each imaging modality (T1c, T2-FLAIR, ADC, FA, DSC peak-height, and %Recovery) were aligned and interpolated to 1mm isotropic resolution then independently standardized to the mode of normal-appearing brain. 10mm volumetric patches surrounding the center of the tissue sample coordinates were used as input to the DL models.
Model Pre-Training: An autoencoder trained on patches surrounding the T2 lesion without known pathology was used in a self-supervised pretraining step to initialize the encoder of the classification model (Figure 1). Initial DL classifier architecture and hyperparameters were tuned on a single 80/20 split of the training data while the autoencoder was optimized on a further 80/20 split of the training data yielding 9.7k training patches and 3k validation patches. TxE samples are oversampled to equal proportions as rGBM via augmentation for classifier training (Figure 2).
Data Splitting & Model Training: The patches of mpMRI images centered at the tissue sample locations were split according to Figure 2. A novel Repeated Constrained k-fold Cross Validation (RC-CV) strategy was used to train and tune models as follows: training data was split by patient into K=4 splits where the proportion of patients containing TxE to rGBM is constrained between roughly 30 and 60% in each split. This process was repeated N=5 times to yield 20 unique networks. By imposing a loose constraint on the proportion of TxE to rGBM, the number of models that are trained on unique subsets of the data with varied class proportions can increase beyond what can be obtained with stratified splitting. Additionally, each sample is validated exactly N times, allowing an estimate of ensemble performance when the validation predictions are averaged. This strategy also permits training on a large validation set in each fold to achieve more stable validation metrics that can be used for early stopping without limiting the total number of models that are generated. To compare the RC-CV strategy to more commonly used techniques, classic stratified 4-fold and 5-fold CV were also performed. The DL models are each compared on the test set independently and used in an ensemble.
Model Evaluation: DL models were compared with and without pretraining or physiological imaging contrasts for each splitting strategy. Classification performance was measured by the area under the receiver operating characteristic curves (AUROC). The best convolutional-neural-network (CNN) was used in an end-to-end inference mechanism that generated ensembled average predictions in a sliding window approach to generate spatial maps of rGBM and TxE as well as maps of model uncertainty (ensemble variance) surrounding the T2-lesion.
Results and Discussion
ROC curves comparing the use of physiological imaging, TL, and RC-CV are shown in Figure 3, with CV and test AUROC values summarized in Figure 4 The self-supervised pretrained (TL) CNN had the best performance (AUROC=0.814). Excluding physiological imaging contrasts and autoencoder pretraining decreased model performance, by 21.7% and 9.7% for 4-fold CV and 37.7% and 5.3% for RC-CV. While models trained on anatomical images alone achieved relatively high CV performance across all training strategies (AUROC=0.760,0.773,0.752), they failed to generalize to the test set (AUROC=0.545,0.612,0.480). Performance of the TL model improved by 5.3% with RC-CV compared to its counterpart trained with stratified 4-fold CV. Figure 5 illustrates example spatial maps of the likelihood of TxE and rGBM, confirming suspicious areas determined by pathology. Uncertainty maps highlight areas of high confidence in predicted regions both pathologically confirmed as TxE and rGBM, demonstrating reliability and flexibility of use for surgical planning.Conclusion
The AUROC of 0.814 demonstrates the feasibility of distinguishing between rGBM and TxE within a single lesion using physiological MRI and DL. Removing physiological imaging drastically decreases generalization ability and removing TL decreases performance. RC-CV provided performance gains compared to conventional stratified k-fold CV and facilitated the ensemble approach to generating spatial TxE probability and model uncertainty maps.Acknowledgements
NIH P01CA118816References
[1] Abbasi AW et. al. “Incidence of Tumour Progression and Pseudoprogression in High-Grade Gliomas: A Systematic Review and Meta-Analysis.” Clinical Neuroradiology, U.S. National Library of Medicine, Sept. 2018.
[2] EM, Delgado-López PD, Riñones-Mena E, Corrales-García. “Treatment-Related Changes in Glioblastoma: A Review on the Controversies in Response Assessment Criteria and the Concepts of True Progression, Pseudoprogression, Pseudoresponse and Radionecrosis.” Clinical & Translational Oncology : Official Publication of the Federation of Spanish Oncology Societies and of the National Cancer Institute of Mexico, U.S. National Library of Medicine, Aug. 2018.
[3] Lee, Joonsang, et al. “Discriminating Pseudoprogression and True Progression in Diffuse Infiltrating Glioma Using Multi-Parametric MRI Data Through Deep Learning.” Nature News, Nature Publishing Group, 23 Nov. 2020.
[4] Akbari H;Rathore S;Bakas S;Nasrallah MP;Shukla G;Mamourian E;Rozycki M;Bagley SJ;Rudie JD;Flanders AE;Dicker AP;Desai AS;O'Rourke DM;Brem S;Lustig R;Mohan S;Wolf RL;Bilello M;Martinez-Lage M;Davatzikos C; “Histopathology-Validated Machine Learning Radiographic Biomarker for Noninvasive Discrimination between True Progression and Pseudo-Progression in Glioblastoma.” Cancer, U.S. National Library of Medicine, June 2020.
[5] Gao, Yang, et al. “Deep Learning Methodology for Differentiating Glioma Recurrence from Radiation Necrosis Using Multimodal Magnetic Resonance Imaging: Algorithm Development and Validation.” JMIR Medical Informatics, JMIR Publications, 17 Nov. 2020.
Figures
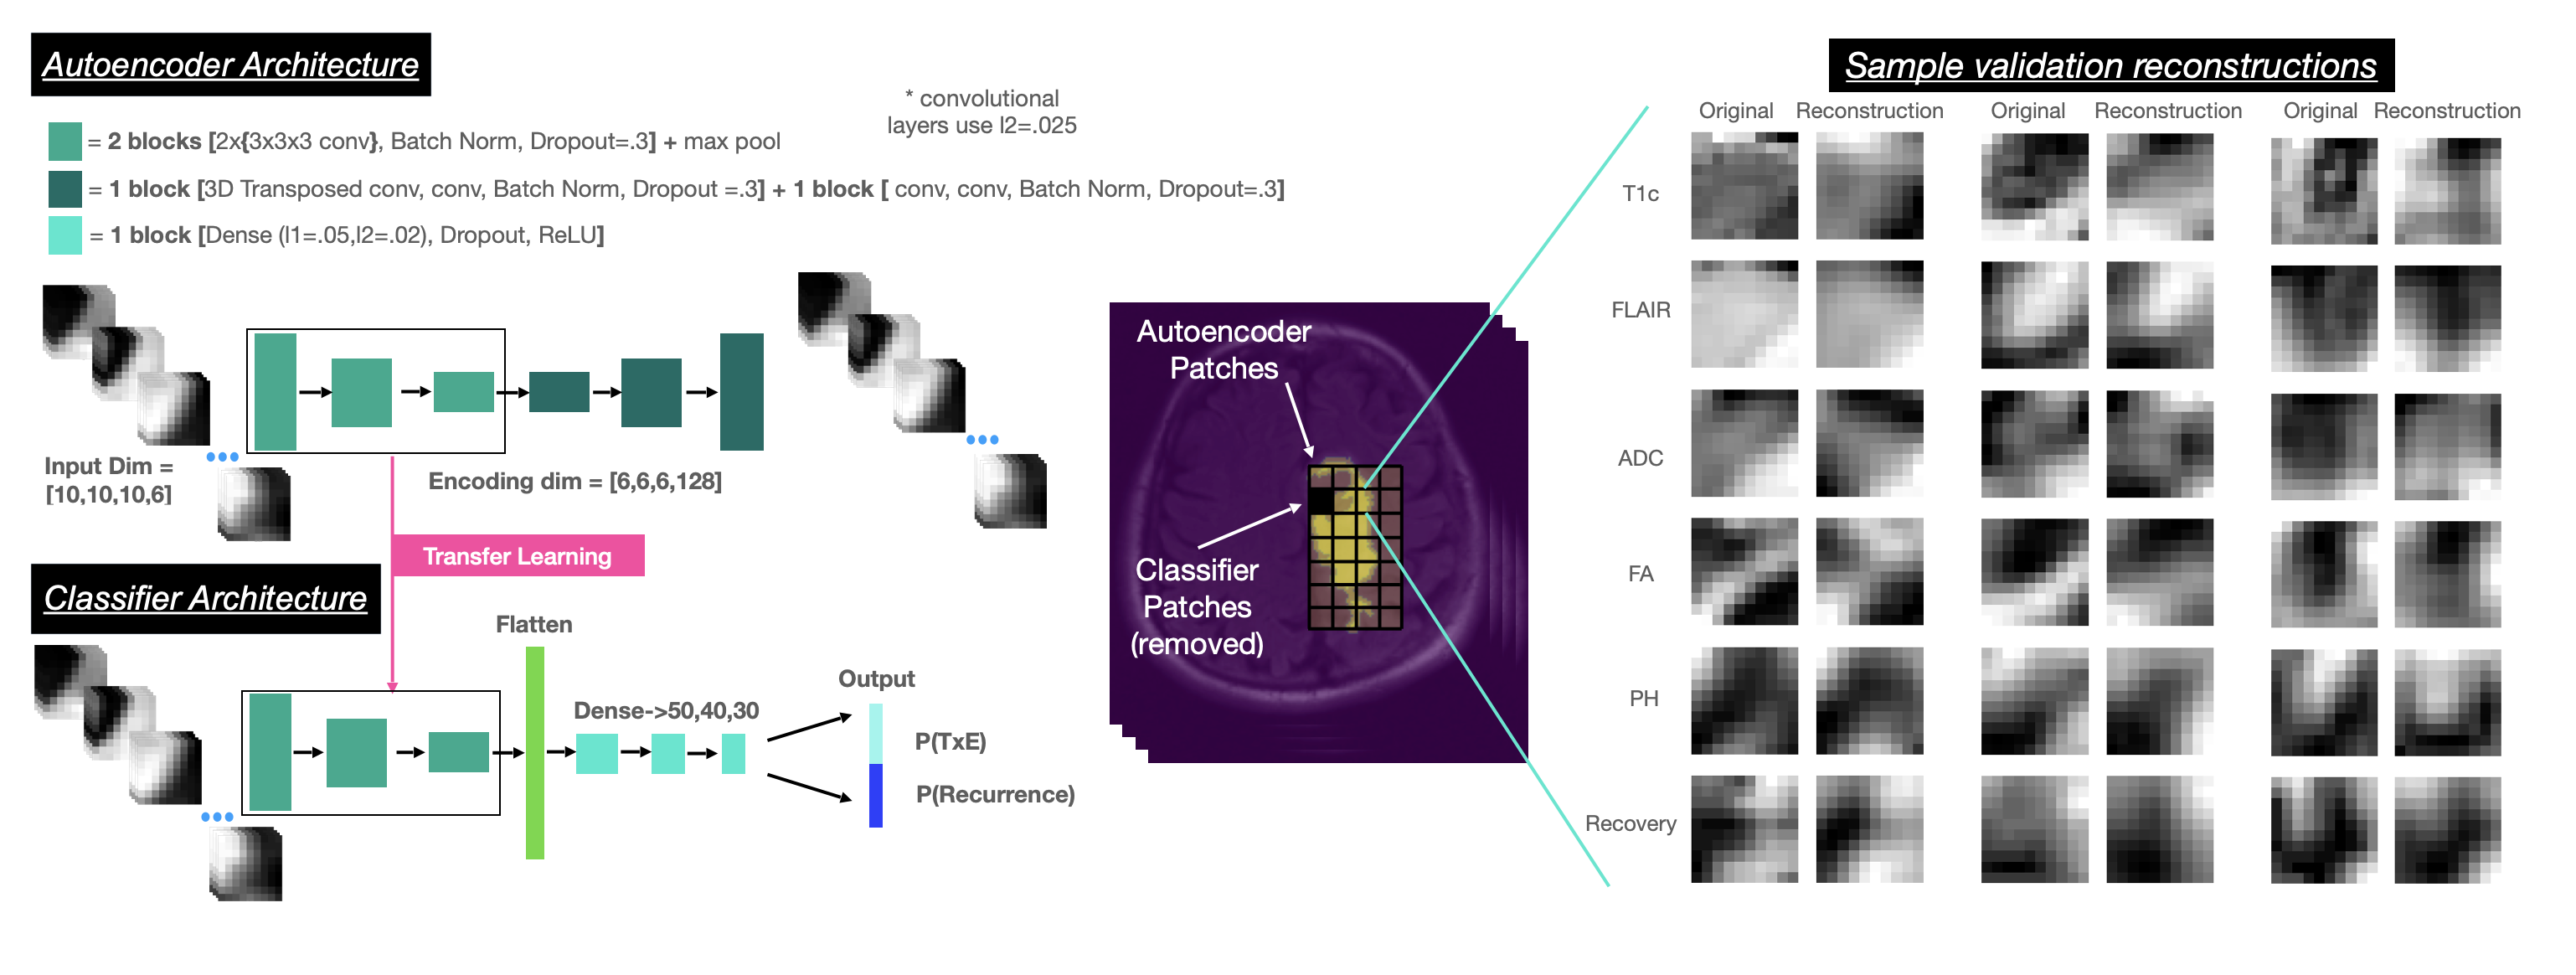
Figure 1: DL model architecture and sample reconstructions obtained during validation of the autoencoder pretraining. Qualitative appearance reflects reasonable initialization for the encoder of the classifier network.
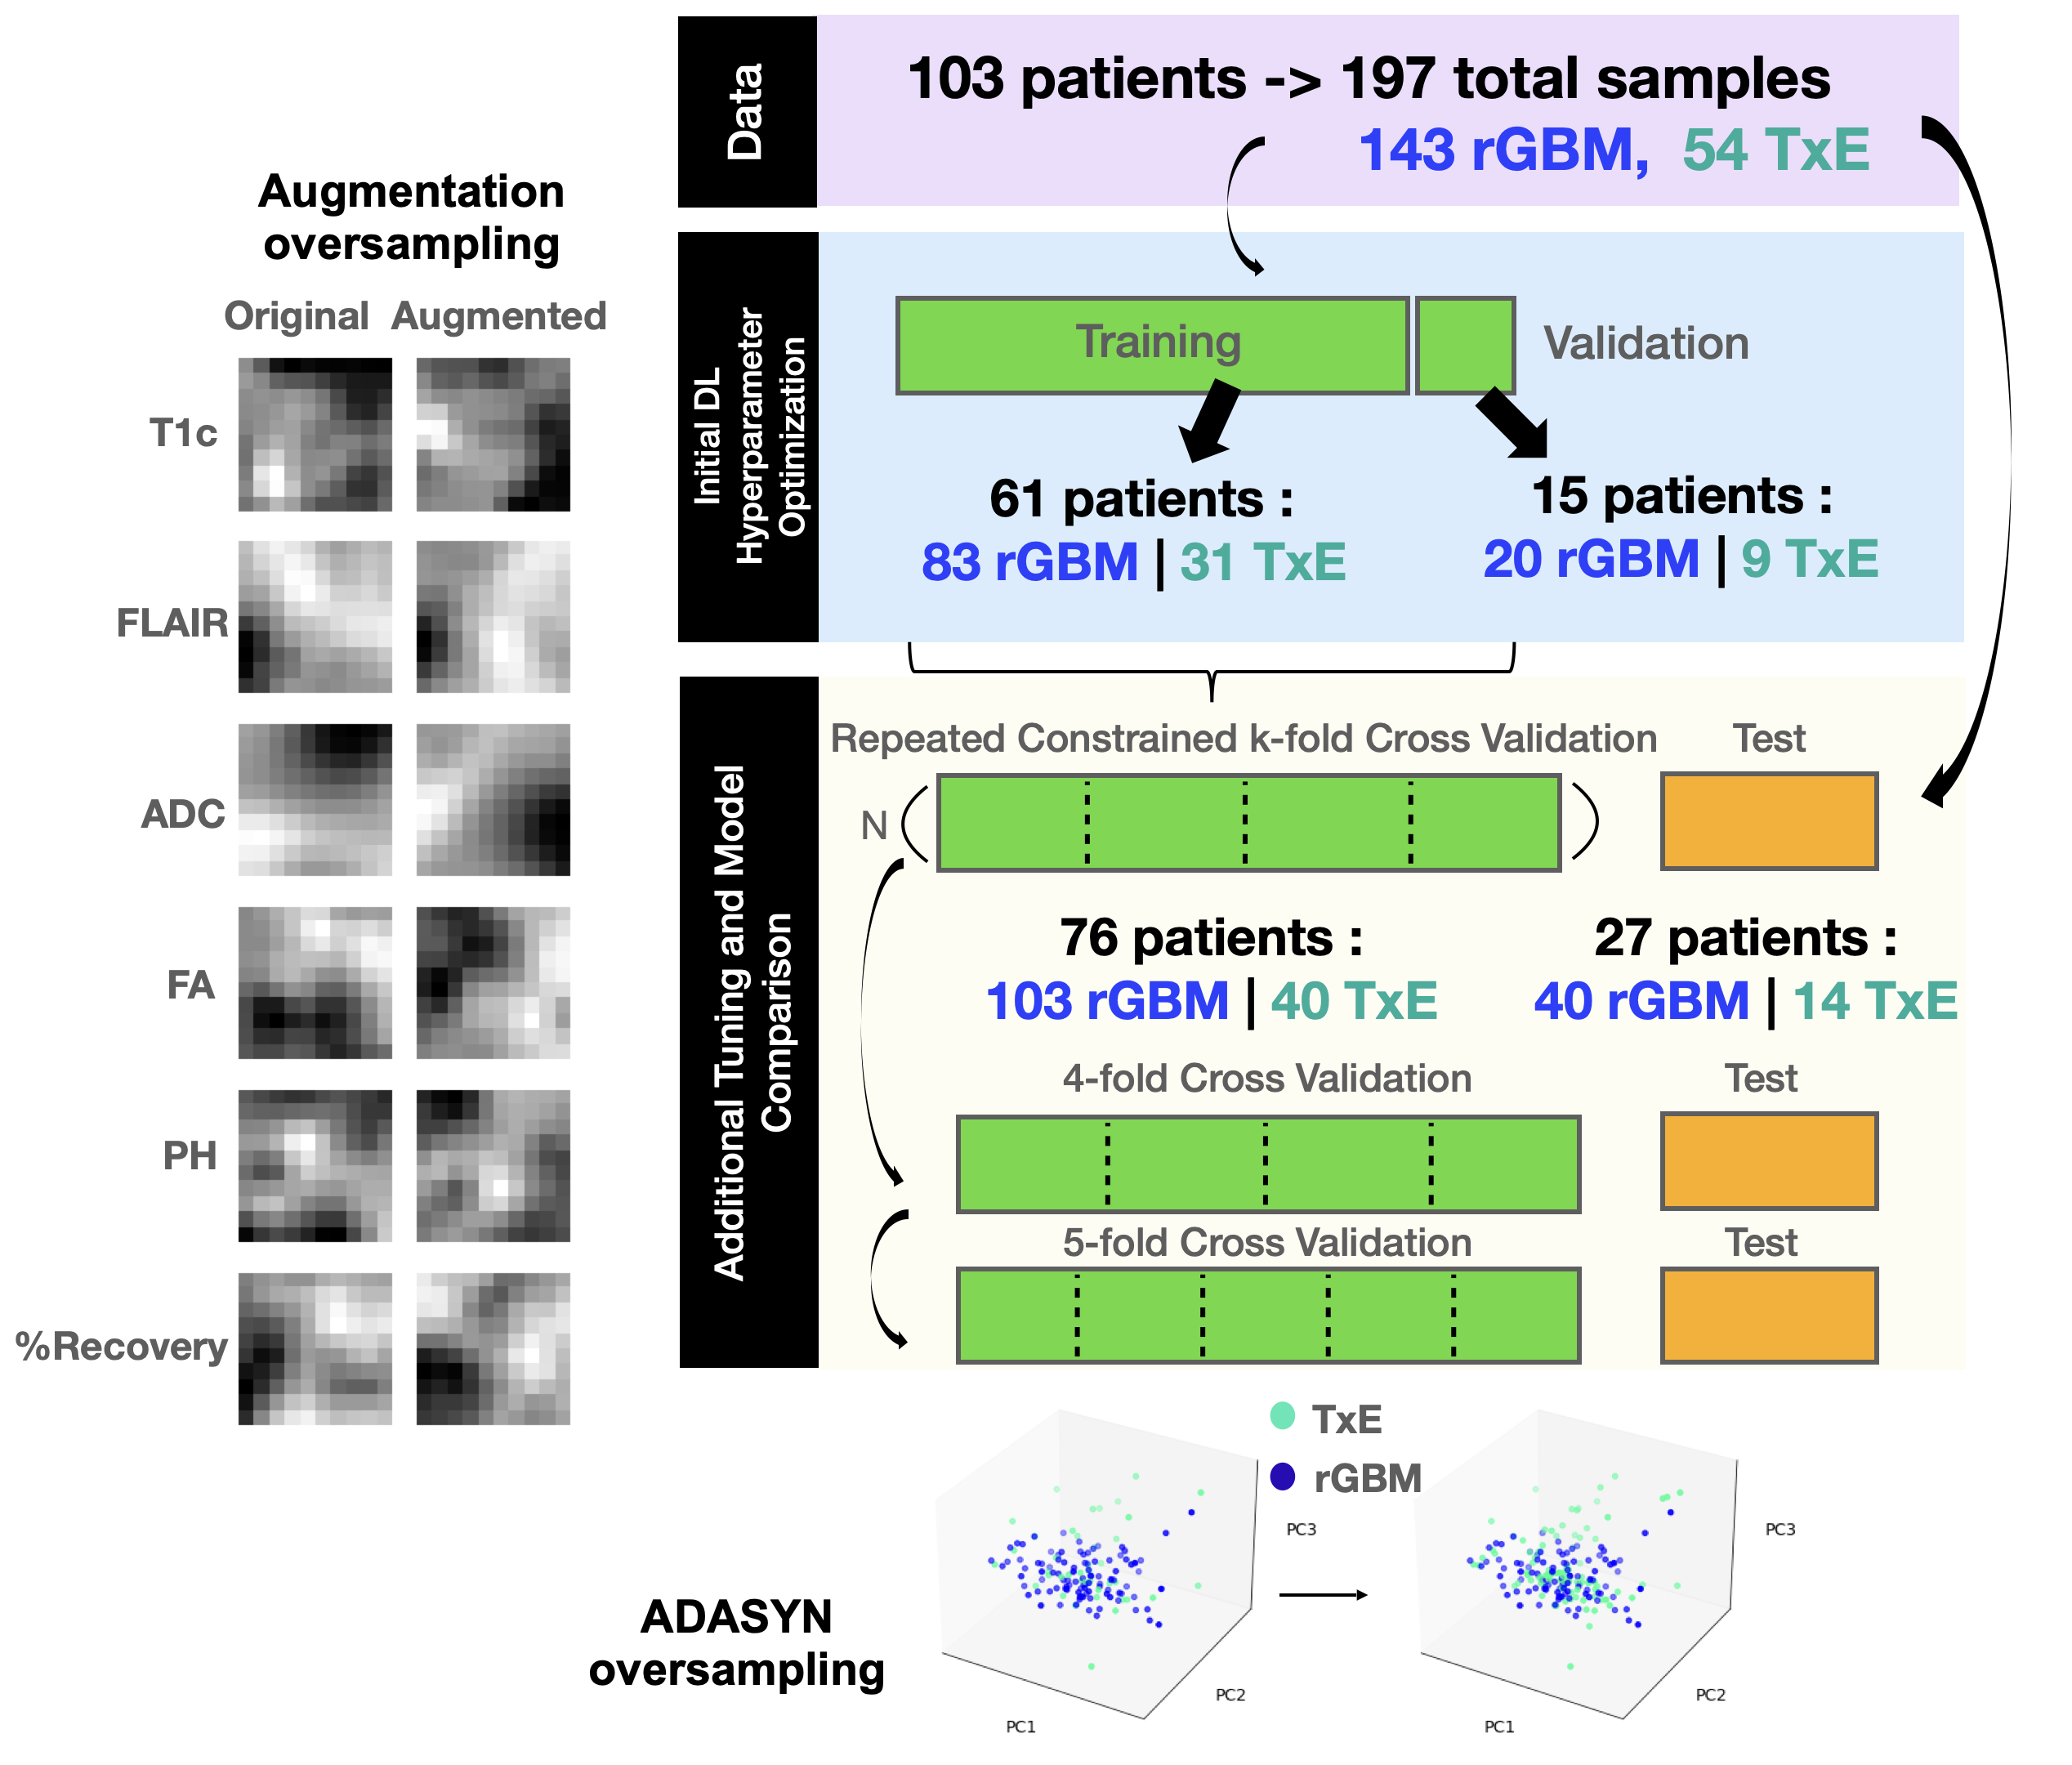
Figure 2: Experimental Design. Initial autoencoder and classifier architecture was tuned before further tuning and training with Repeated Constrained k-fold Cross Validation (CR-CV). DL models without reconstruction pretraining, and physiological imaging contrasts were then compared in CR-CV, 4, and 5-fold Cross Validation. Models are tested independently and in ensemble averaging on the holdout test set split off by 1/4 of patients. ADASYN and augmentation oversampling were used to oversample TxE to the same proportions as rGBM in each fold for ML and DL models respectively.
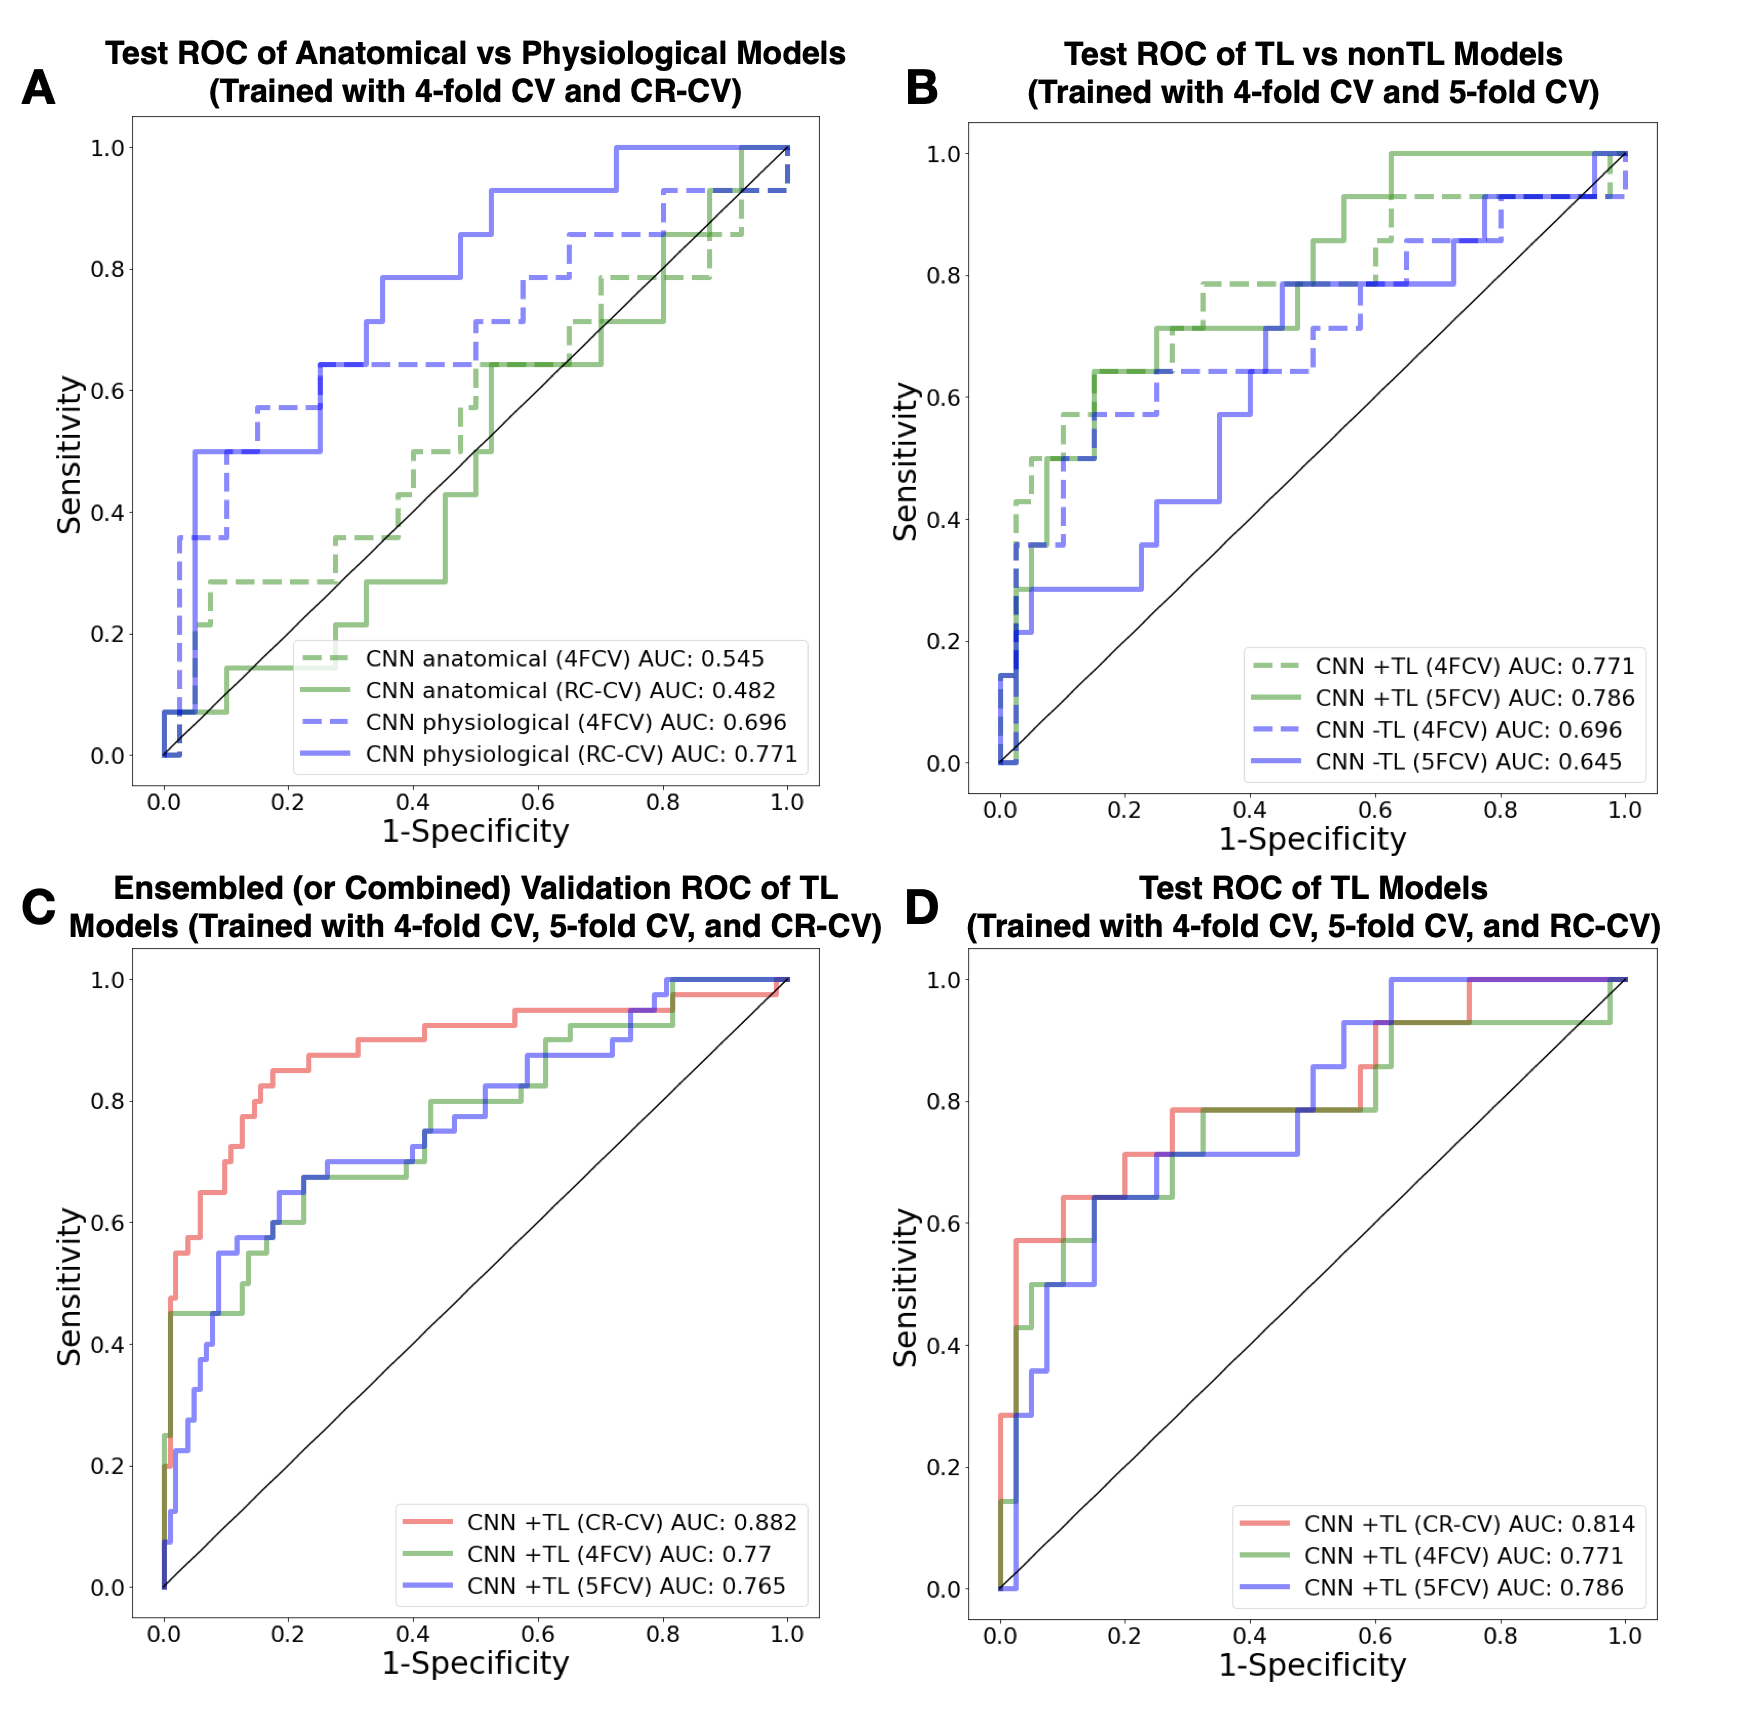
Figure 3: Receiver Operator Characteristic (ROC) curves comparing testing performance of using physiological imaging contrasts (A), reconstruction pretraining (B), and CR-CV performance in validation (C) and testing (D). Validation ROCs are generated by averaging the predictions made with CR-CV and combining the predictions made with k-fold CV across each fold.
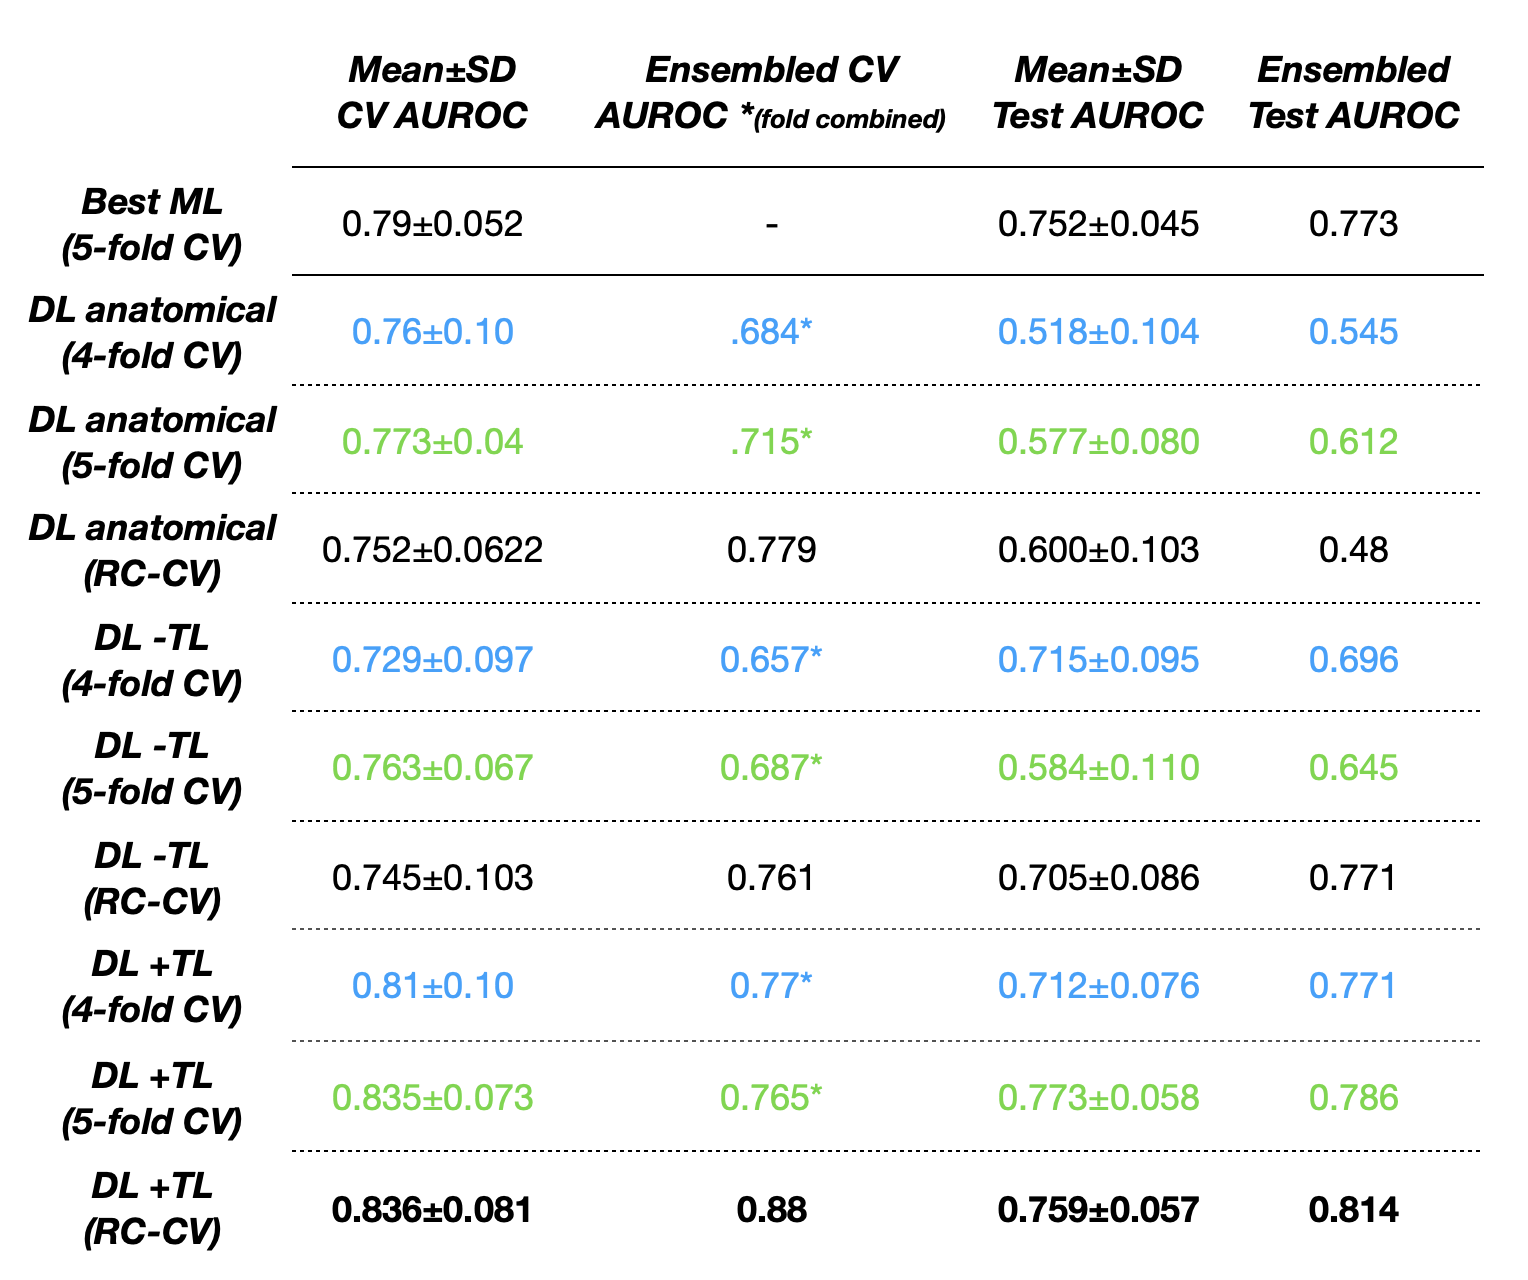
Figure 4: Area Under the Receiver Operator Characteristic (AUROC) curves for all models across CR-CV, 4-fold CV, 5-fold CV, average testing, and ensembled testing is shown. Pretrained CNN (+TL), non pretrained CNN (-TL), CNN using anatomical images only, as well as baseline ML (Soft Voting Ensemble of Random Forest, Gaussian Process, and Support Vector Classifiers) performance is shown.
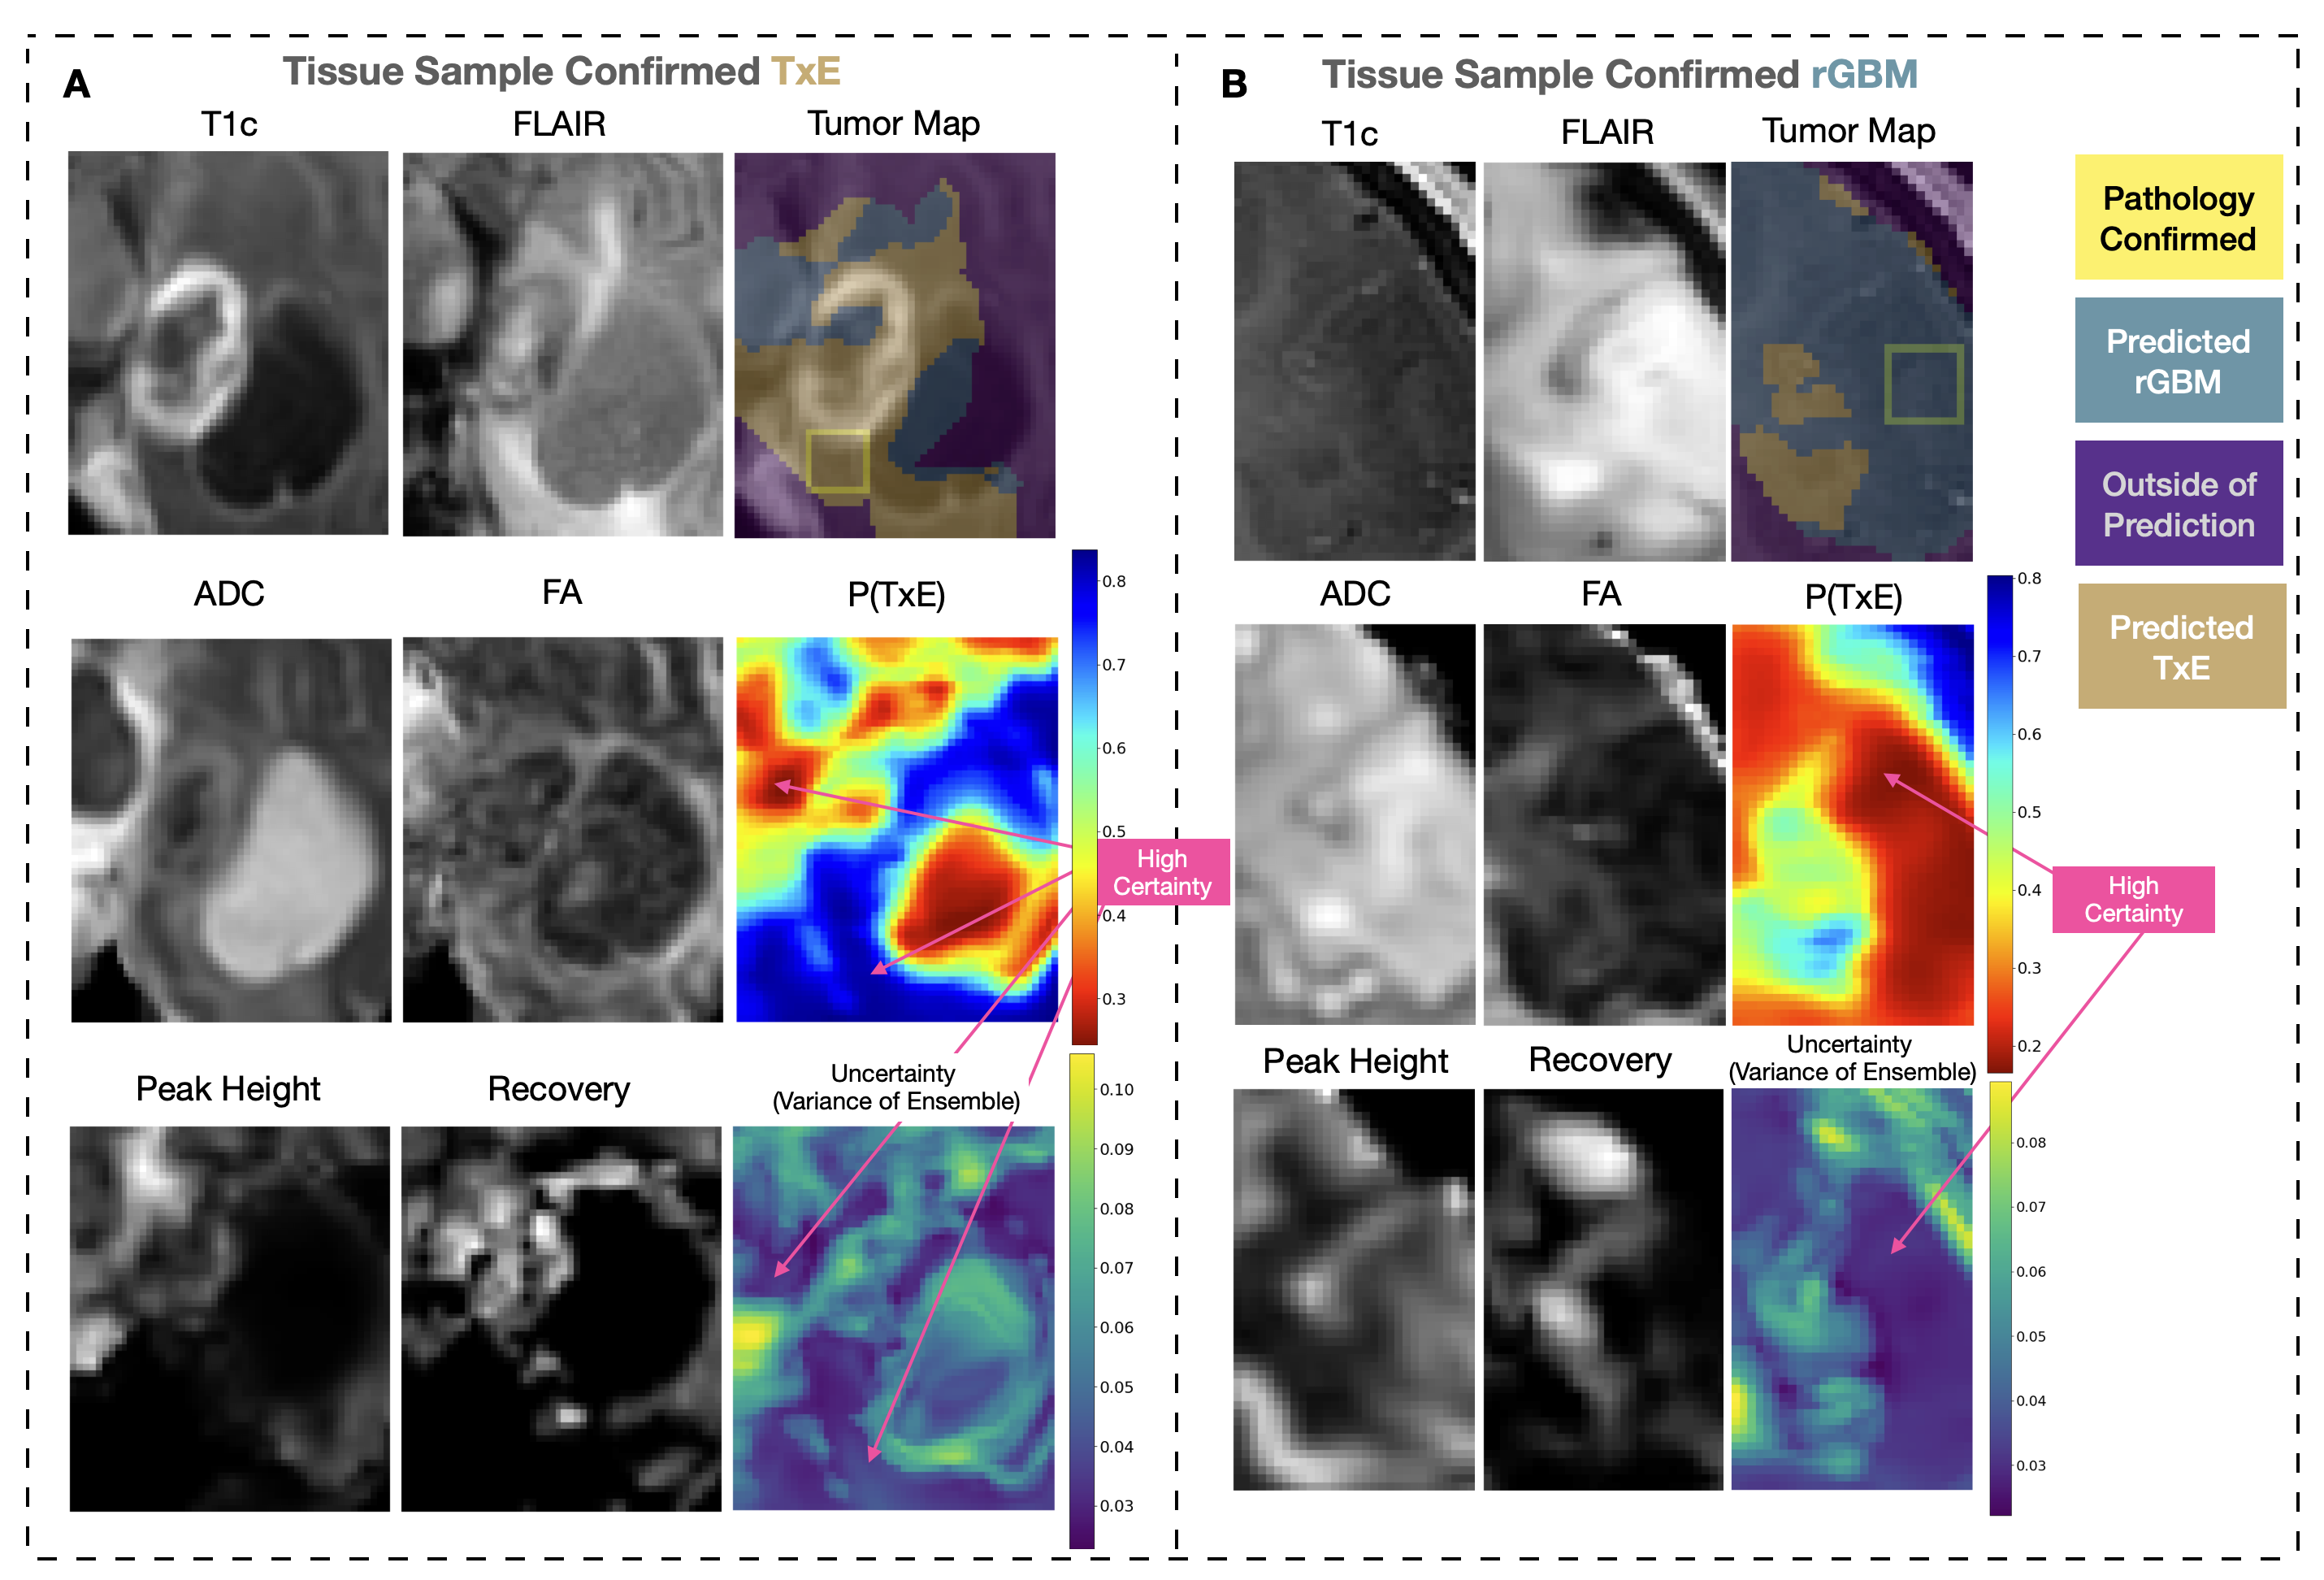
Figure 5: Sample test set spatial maps. P(TxE) is the model output, where blue represent areas predicted to be TxE and red to be rGBM. Uncertainty maps are shown, with highly certain areas in purple and highlighted with arrows. Images are cropped to surround the T2-lesion. Yellow boxes surrounding the tissue samples confirmed with pathology are 10mm but scaled to the cropped image. Tumor Maps are thresholded at .448 yielding a sensitivity=0.85, specificity=0.83, and accuracy=0.83 in CR-CV. (A) Test case with the sample confirmed as TxE, and (B) test case with the sample confirmed as rGBM.