0130
Multi-Parametric Quantitative MRI Assessment of Soft Tissue Sarcoma Response to Preoperative Therapy
Wei Huang1, Andy Kaempf1, Brooke Beckett1, Alina Tudorica1, Jeong Youn Lim1, and Christopher Ryan1
1Oregon Health & Science University, Portland, OR, United States
1Oregon Health & Science University, Portland, OR, United States
Synopsis
Keywords: Cancer, Treatment, DCE-MRI, DW-MRI, Therapy Response, Ktrans, ADC
Thirty patients with lower extremity soft tissue sarcoma were treated with preoperative chemoradiotherapy and underwent MRI exams including DCE- and DW-MRI pre-therapy, after the first cycle of therapy regimen, and after completion of therapy but before surgery. Ten patients had optimal and the other 20 had sub-optimal pathologic responses based on necrosis percentage of the surgical tumor specimens. Quantitative DCE-MRI markers and apparent diffusion coefficient (ADC) were superior to radiographic tumor size measurement in early prediction and evaluation of therapy response. Multi-parametric approach of combining DCE- and DW-MRI markers further improved early prediction of optimal vs. sub-optimal response.Introduction
High-risk soft tissue sarcoma (STS) of the extremities is often treated with preoperative chemoradiotherapy. The degree of necrosis in surgical tumor specimen has been shown to correlate with disease control and overall survival1. Noninvasive methods that can accurately predict treatment-induced necrosis in the early stage of treatment may help guide therapy regimen adjustment to optimize response and improve outcome. Extensive research2,3 has shown that tumor size change in response to treatment is often preceded by underlying tumor biological changes measureable with quantitative imaging biomarkers. This study aimed to predict and evaluate STS response to preoperative chemoradiation through measurements of tumor perfusion and permeability by dynamic contrast-enhanced (DCE) MRI and cellularity by diffusion-weighted (DW) MRI.Methods
Thirty patients with lower extremity STS were enrolled in a research MRI study including DCE- and DW-MRI using a 3T Siemens system. MRIs were performed at visit 1 (V1) - before treatment, V2 - after the first therapy cycle of a regimen of three chemotherapy cycles plus one radiation session, and V3 – after completion of therapy before surgery. Several subjects dropped out of the MRI study at V2 and V3 due to various reasons, resulting in 25 and 17 subjects at V2 and V3, respectively.DCE-MRI using a 3D RF-spoiled gradient-echo sequence with 7 – 14 s temporal resolution and ~10 min acquisition time4 was performed following DW-MRI using a 2D (no slice gap) single-shot EPI sequence with b = 0, 200, and 1000 s/mm2. Tumor ROIs were manually drawn on post-contrast DCE images and diffusion images with b = 1000 s/mm2, respectively. Tumor longest diameter (LD) was measured on DCE images according to the RECIST guidelines5. Pharmacokinetic analyses of DCE time courses from the tumor ROIs were performed using the Shutter-Speed model4,6 to estimate Ktrans, ve, kep (= Ktrans/ve), and τi (mean intracellular water lifetime) parameters. Apparent diffusion coefficient (ADC) maps were generated by the vendor software using all three b values and the tumor ROI ADC values were recorded. For both DCE parameters and ADC, the whole tumor mean value was calculated as the weighted (by ROI voxel number on each slice) average of the single-slice ROI parameter values across image slices covering the tumor.
Pathologic therapy response was defined as optimal or sub-optimal based on surgical specimen necrosis percentage (NP) of ≥ 95% or < 95%, respectively7. For each MRI metric (at each visit and percent change: V21% and V31%, V2 and V3 relative to V1, respectively), Wilcoxon rank sum tests were used to assess differences between the response groups and univariable logistic regressions (ULR) were fit to evaluate discriminative performance with AUC values. Associations between MRI metrics and NP were assessed by Spearman correlation. Predictors with ULR AUC ≥ 0.7 were included in multivariable logistic regression (MLR) models for prediction of response.
Results
10 patients had optimal while the other 20 had sub-optimal therapy responses. Descriptive statistics for each MRI metric and the ULR AUC for discriminating optimal vs. sub-optimal response are summarized in Table 1 (only DCE parameters with AUC ≥ 0.7 are listed). Tumor LD at any MRI visit or its percent change was not discriminative of the two groups. While the DCE parameters and ADC were excellent classifiers of optimal vs. sub-optimal response after therapy completion (V3), it is important to note that, after only the first cycle of preoperative therapy, V2 Ktrans, kep, and ADC, and V21% Ktrans, τi, and ADC were fair to excellent early predictors of pathologic response. Pre-therapy (V1) Ktrans and kep also provided fair predictions of response with AUC > 0.7. Fig. 1 shows an example of Ktrans and ADC maps from V1 to V3 of a STS with 98% necrosis following treatment. Although there are no noticeable changes in LD, the decrease in Ktrans and increase in ADC over the treatment course are clearly visible. Table 2 shows Spearman correlation estimates of each MRI metric with NP (only DCE parameters with p < 0.1 are listed). Again, LD did not correlate with NP at any time point or by percent change. While the DCE parameters and ADC at V3 were highly correlated with NP, it is the significant (p < 0.05) correlations of V2 Ktrans and kep and the near significant correlations of V1 Ktrans (p = 0.055) and V2 ADC (p = 0.054) with NP that allow early prediction of pathologic response.Fig. 2 shows ROC curves for MLR of V21% (Ktrans + τi) and V21% (Ktrans + τi + ADC) with AUC = 0.76 and 0.98, respectively. The large increase in AUC after addition of ADC was nearly significant (p = 0.083; DeLong’s test8).
Discussion
The findings of DCE-MRI marker superiority over tumor size for early prediction of STS response to preoperative chemoradiotherapy are consistent with the results from the first 20 patients of this cohort4. Tumors are generally complex systems characterized by spatial and temporal heterogeneity in pathophysiology. A quantitative imaging method that depicts only one aspect of tumor biology is intrinsically limited. The increase in predictive performance when ADC was combined with Ktrans and τi suggests that multi-parametric quantitative MRI provides a more comprehensive and accurate assessment of multi-faceted responses to treatment.Acknowledgements
Grant support: NIH U01CA154602, R01CA248192
References
1. Eilber FC, Rosen G, Eckardt J, et al. Treatment-induced pathologic necrosis: a predictor of local recurrence and survival in patients receiving neoadjuvant therapy for high-grade extremity soft tissue sarcomas. J Clin Oncol 2001;19(13):3203–3209.
2. Leach MO, Morgan B, Tofts PS, et al. Imaging vascular function for early stage clinical trials using dynamic contrast-enhanced magnetic resonance imaging. Eur Radiol 2012;22:1451-1464.
3. Yankeelov TE, Mankoff DA, Schwartz LH, et al. Quantitative imaging in cancer clinical trials. Clin Cancer Res 2016;22:284-290.
4. Huang W, Beckett BR, Tudorica A, et al. Evaluation of soft tissue sarcoma response to preoperative chemoradiotherapy using dynamic contrast-enhanced magnetic resonance imaging. Tomography 2016;2:308-316.
5. Eisenhauer EA, Therasse P, Bogaerts J, et al. New response evaluation criteria in solid tumors: revised RECIST guideline (version 1.1). Eur J Cancer 2009;45:228-247.
6. Li X, Rooney WD, Springer CS. A unified pharmacokinetic theory for intravascular and extracellular contrast agents. Magn Reson Med 2005;54:1351-1359. [Erratum. Magn Reson Med 2006;55:1217.]
7. Ryan CW, Montag AG, Hosenpud JR, et al. Histologic response of dose-intense chemotherapy with preoperative hypofractionated radiotherapy for patients with high-risk soft tissue sarcomas. Cancer 2008;112(11):2432–2439.
8. DeLong ER, DeLong DM, Clarke-Pearson DL. Comparing the areas under two or more correlated receiver operating characteristic curves: a nonparametric approach. Biometrics 1988;44:837–845.
Figures
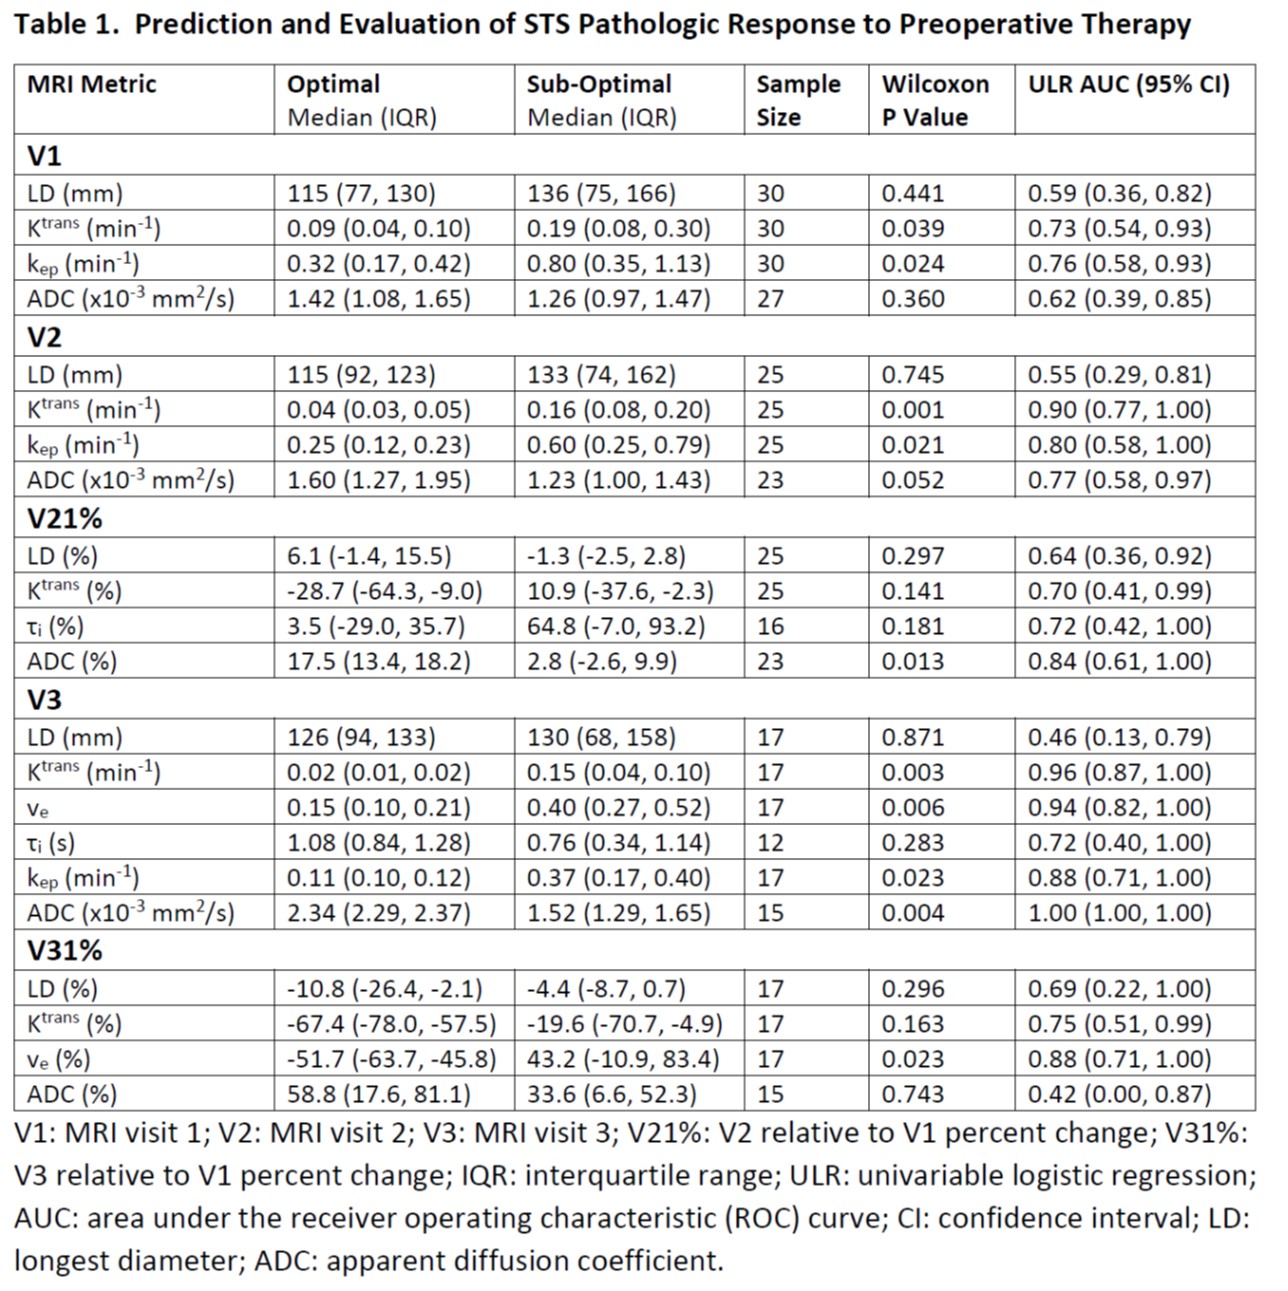
Table 1.
Prediction and Evaluation of STS Pathologic Response to Preoperative
Therapy
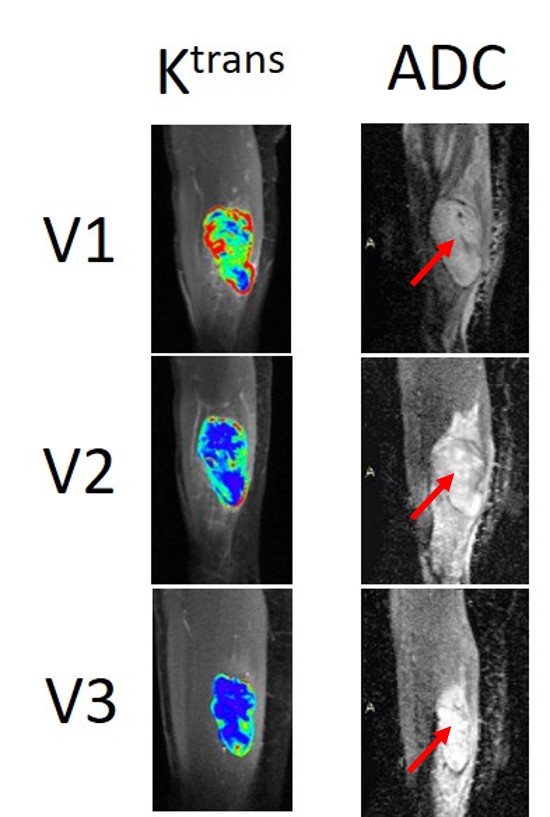
Figure 1. Voxel-based tumor Ktrans (color) and ADC (arrow points to tumor) maps at V1, V2, and V3 from a patient with a soft tissue sarcoma in the right thigh. This patient was an optimal responder following preoperative chemoradiotherapy with 98% necrosis in the surgical tumor specimen. The color scale for Ktrans and grey scale for ADC are kept the same for all three MRI visits for comparison purposes.
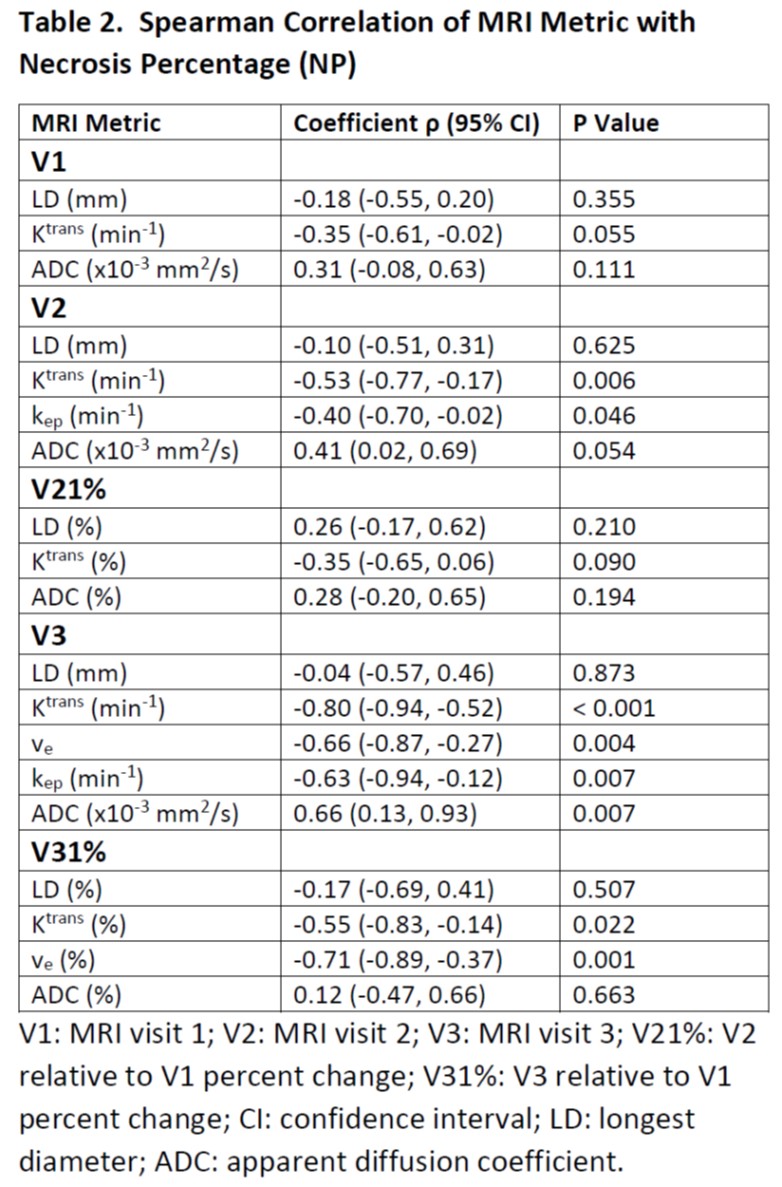
Table 2. Spearman
Correlation of MRI Metric with Necrosis Percentage (NP)
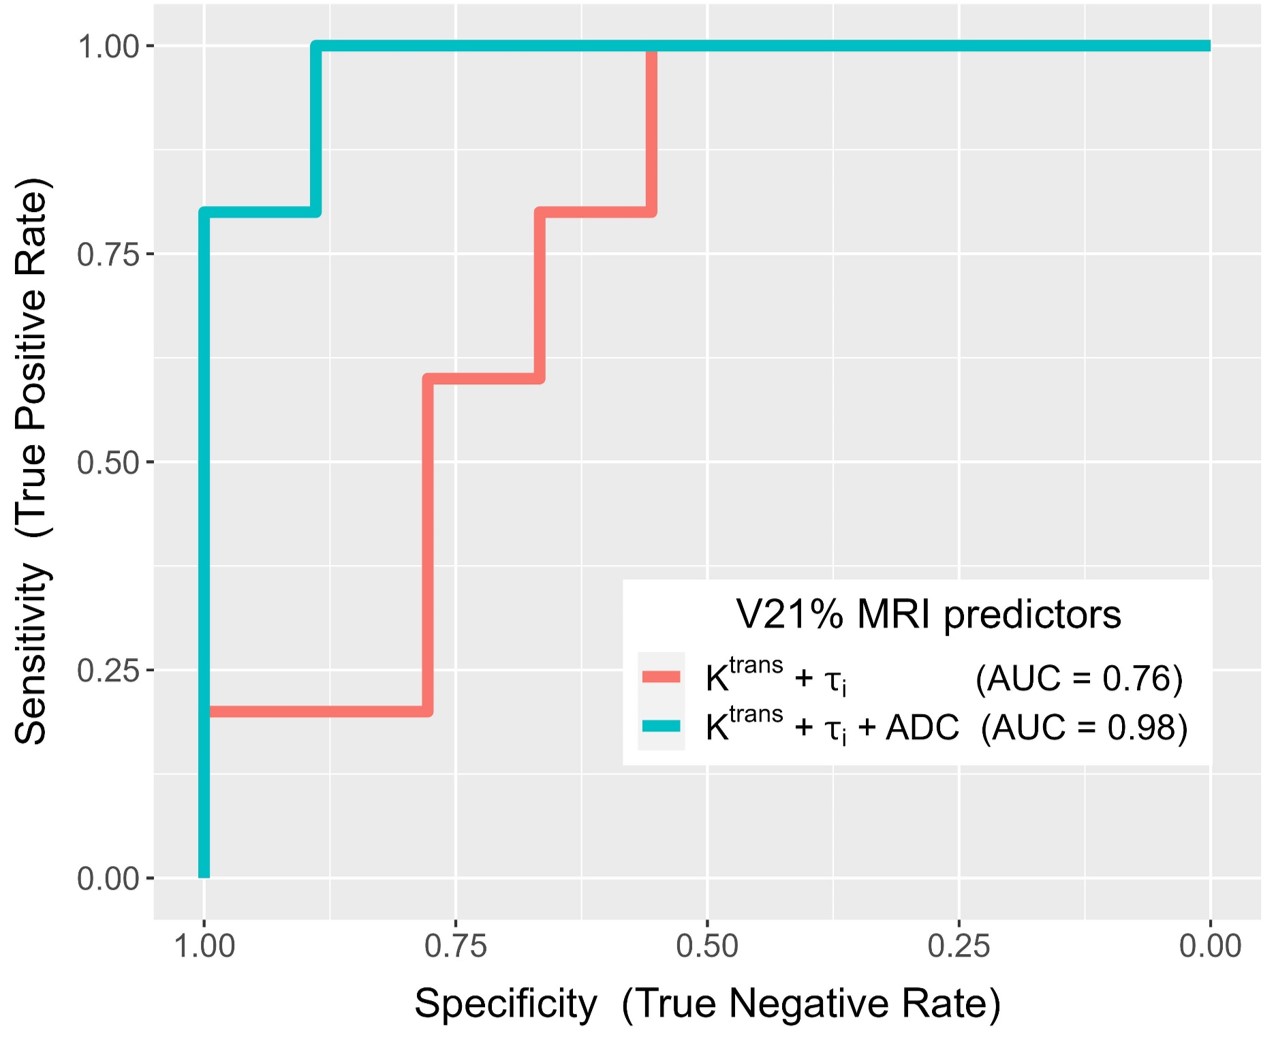
Figure 2. ROC curves from multivariable logistic regression (MLR) of V21% (Ktrans + τi) (red; AUC = 0.76) and V21% (Ktrans + τi + ADC) (green; AUC = 0.98) for prediction of optimal vs. sub-optimal pathologic response.
DOI: https://doi.org/10.58530/2023/0130