0129
Multimodal serial assessment of neoadjuvant therapy response and recurrence-free survival in locally advanced breast cancer
Anum S. Kazerouni1, Lanell M. Peterson1, Isaac Jenkins2, Alena Novakova1, Hannah M. Linden1, David Hockenbery1, David Mankoff3, Jennifer Specht1, and Savannah C. Partridge1
1University of Washington, Seattle, WA, United States, 2Fred Hutch Cancer Center, Seattle, WA, United States, 3University of Pennsylvania, Philadelphia, PA, United States
1University of Washington, Seattle, WA, United States, 2Fred Hutch Cancer Center, Seattle, WA, United States, 3University of Pennsylvania, Philadelphia, PA, United States
Synopsis
Keywords: Breast, Cancer
We investigated the combination of DCE-MRI and 18F-FDG PET for assessing metabolism/perfusion mismatch and predicting pathological response and recurrence-free survival (RFS) in women undergoing neoadjuvant chemotherapy (NAC) for breast cancer. Thirty-five patients with localized breast cancer were imaged with both modalities at 3 timepoints over the course of NAC. Greater mid-treatment decreases in imaging measures were predictive of pathological response and associated with improved long-term outcome. Furthermore, mid-treatment decreases in metabolism/perfusion ratios were predictive of RFS. These results indicate a complementary relationship between DCE-MRI and 18F-FDG PET metrics and potential value of metabolism/perfusion mismatch as a marker of response.Introduction
Patients with locally advanced breast cancer are typically treated with neoadjuvant chemotherapy (NAC) to reduce local tumor burden and enable breast-conserving surgery. However, response to NAC is variable, with only ~35% of patients achieving pathological complete response (pCR), a marker associated with improved survival1. Quantitative magnetic resonance imaging (MRI) and positron emission tomography (PET) can noninvasively measure physiological tissue properties in vivo2. Pretherapy mismatch between tumor metabolism and perfusion was previously found predictive of poor response to NAC, using [18F]-fluorodeoxyglucose (18F-FDG) and [15O]-water PET3. Furthermore, dynamic contrast-enhanced (DCE)-MRI kinetics correlated well with blood flow measures by 15O-water PET in breast tumors4, suggesting DCE-MRI, commonly used for clinical management, could provide a more convenient method for perfusion assessment5. In this prospective study, we investigated the combination of DCE-MRI and 18F-FDG PET for assessing metabolism/perfusion mismatch and predicting pathological response and recurrence-free survival (RFS) in women undergoing NAC for breast cancer.Methods
Subjects and treatment outcomes:Patients undergoing NAC for histologically confirmed breast cancer (stage II-III) were enrolled in this IRB-approved prospective trial (May 2012-July 2015; NCT01931709). Patients were imaged with dynamic 18F-FDG PET and DCE-MRI prior to therapy (baseline), 2-12 weeks after the start of NAC (mid-treatment), and after completion of NAC (post-treatment). Residual cancer burden (RCB) after NAC was determined by pathology at surgery, and RFS was determined by most recent followup.
Image acquisition and analysis:
Patients were scanned on a 3T (Achieva, Philips Healthcare) clinical scanner with a dedicated breast coil. DCE-MRI data was acquired with a fat suppressed, 3D fast gradient echo sequence with one pre-contrast and three post-contrast acquisitions centered at 2, 5, and 8 minutes after gadolinium-based contrast injection (0.1mmol/kg-body-weight at 2cc/sec, followed by 15cc saline flush). To correct for patient motion, DCE-MRI series were registered using CADstream (Merge Healthcare, Chicago, IL). Contrast kinetics were calculated for each tumor using custom software developed in ImageJ5 to measure percent enhancement (PE) at 2 minutes post-contrast, signal enhancement ratio (SER), functional tumor volume (FTV, cm3, with PE≥50%) and washout volume (WV, cm3, with SER≥1.1). Hotspot analysis was performed to identify the 3×3 voxel subregions with peak PE (peak_PE) and SER (peak_SER) in each lesion. PET imaging was performed on a GE Discovery STE PET/CT scanner (GE Medical Systems, Waukesha, WI) as previously described for dynamic imaging3,6 with a low dose CT for attenuation correction and positioning. Dynamic imaging was performed over the chest and breast for 60 minutes after the start of FDG infusion (7-11 mCi, 259-407 MBq) and was followed by a clinical protocol of 5 fields-of-view static imaging. Summed standardized uptake value (SUV) images from 30-60 minutes post injection were constructed from the dynamic data and the maximum each the lesion was calculated (SUVmax). Additionally, dynamic data was modeled to derive parameters of radiotracer kinetics including K1 (blood flow rate) and MRFDG (glucose metabolic rate).
Statistical analyses:
Spearman’s rank correlation coefficient (𝜌) was calculated to assess associations between baseline MRI and PET imaging metrics. In addition to individual imaging metrics, metabolism/perfusion ratios were calculated as MRFDG/peak_PE and MRFDG/peak_SER. Wilcoxon rank sum test was used to compare the percent change from baseline for each feature between RCB 0/I and II/III patient groups. Cox proportional hazards regression was used to examine the association of RFS and percent change in imaging measures, with the Wald test used to evaluate statistical significance.
Results
Thirty-five women (median age: 43, range: 31-66 years) with invasive breast cancer (Luminal A: N=1 [3%], Luminal B: N=20 [57%], TNBC: N=12 [34%], HER2+: N=2 [6%]) were enrolled in this study, of which 11 (31%) achieved RCB 0/I after NAC. A mild correlation was observed between PET and MRI measures of vascularity (K1 and peak_PE: 𝜌=0.35, p=0.04; K1 and peak_SER: 𝜌=0.31, p=0.07). No significant correlation was observed between MRFDG and PE or SER. No imaging measures were significantly different between RCB 0/I and II/III patients at baseline. At mid-treatment, RCB 0/I patients exhibited greater decrease from baseline in peak_PE compared to RCB II/III patients (-31.1% vs. -15.1%, p=0.03), as well as trends of greater decrease in WV and SUVmax (p=0.05). At post-treatment, RCB 0/I patients had significantly greater decrease from baseline in K1, SUVmax, peak_PE, and peak_SER (Table 1, p<0.05). For survival analyses, six (17%) patients recurred since treatment initiation, with a median follow-up time of 8.1 (range: 1.1-9.8) years. Mid-treatment percent change in K1, MRFDG, peak_SER, WV, MRFDG/peak_PE and MRFDG/peak_SER each showed significant association with RFS (p<0.05, Table 2).Discussion & Conclusion
Our findings demonstrate mid-treatment changes in DCE-MRI and 18F-FDG PET measures can predict pathological response, consistent with other studies5,7,8, and further may serve as biomarkers of long-term outcome. In contrast to the prior PET studies based on 15O-water PET perfusion measures3, we did not find pretherapy metabolism/perfusion mismatch quantified by MRFDG/peak_SER and MRFDG/peak_PE to be predictive of treatment response. However, mid-treatment changes in these ratios were predictive of outcome, with greater decreases associated with longer RFS. Our preliminary results support the complementary nature of these multi-modality imaging metrics and potential value of metabolism/perfusion mismatch as a marker of response, warranting further investigation in larger studies.Acknowledgements
Supported by NIH/NCI grants P50CA138293, R01CA248192References
- I-SPY2 Trial Consortium et al. Association of Event-Free and Distant Recurrence–Free Survival With Individual-Level Pathologic Complete Response in Neoadjuvant Treatment of Stages 2 and 3 Breast Cancer: Three-Year Follow-up Analysis for the I-SPY2 Adaptively Randomized Clinical Trial. JAMA Oncol 6, 1355 (2020).
- Yankeelov, T. E., Abramson, R. G. & Quarles, C. C. Quantitative multimodality imaging in cancer research and therapy. Nat Rev Clin Oncol 11, 670–680 (2014).
- Mankoff, D. A. et al. Blood Flow and Metabolism in Locally Advanced Breast Cancer: Relationship to Response to Therapy. Journal of Nuclear Medicine 43, 500–509 (2002).
- Eby, P. R. et al. Metabolic and Vascular Features of Dynamic Contrast-enhanced Breast Magnetic Resonance Imaging and 15O-Water Positron Emission Tomography Blood Flow in Breast Cancer. Academic Radiology 15, 1246–1254 (2008).
- Partridge, S. C. et al. Association between serial dynamic contrast-enhanced MRI and dynamic 18F-FDG PET measures in patients undergoing neoadjuvant chemotherapy for locally advanced breast cancer. Journal of Magnetic Resonance Imaging 32, 1124–1131 (2010).
- Mankoff, D. A. et al. Changes in Blood Flow and Metabolism in Locally Advanced Breast Cancer Treated with Neoadjuvant Chemotherapy. Journal of Nuclear Medicine 44, 1806–1814 (2003).
- Hylton, N. M. et al. Locally Advanced Breast Cancer: MR Imaging for Prediction of Response to Neoadjuvant Chemotherapy—Results from ACRIN 6657/I-SPY TRIAL. Radiology 263, 663–672 (2012).
- Tseng, J. et al. 18F-FDG Kinetics in Locally Advanced Breast Cancer: Correlation with Tumor Blood Flow and Changes in Response to Neoadjuvant Chemotherapy. Journal of Nuclear Medicine 45, 1829–1837 (2004).
Figures
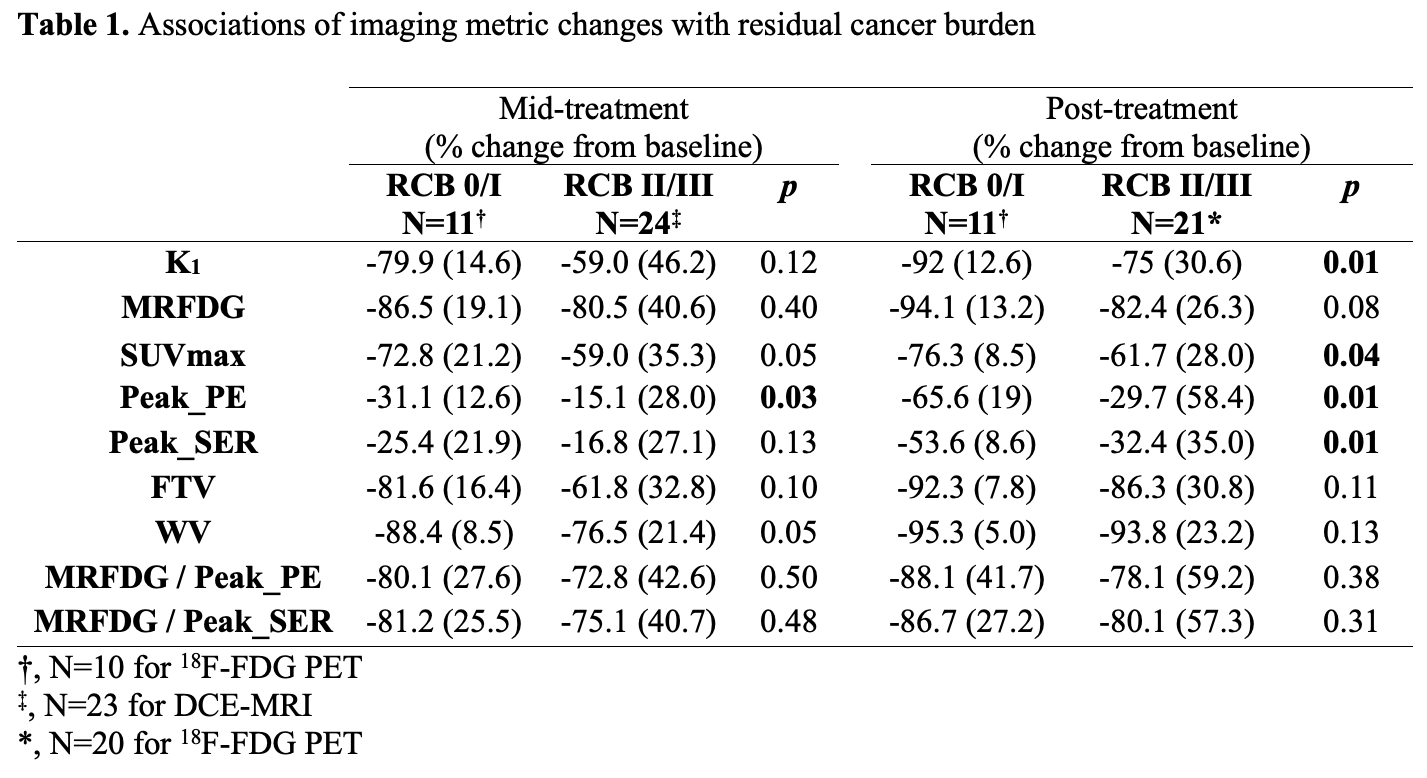
Table 1. Associations of imaging metric changes with residual cancer burden
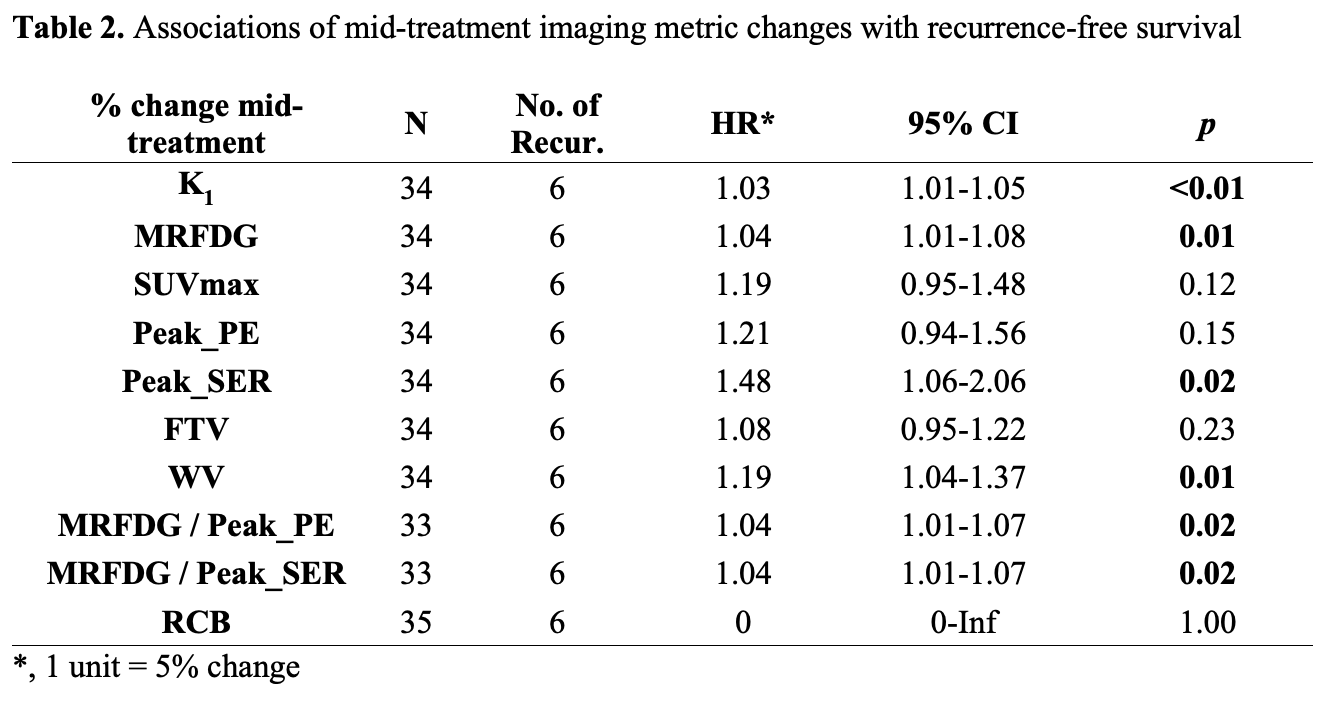
Table 2. Associations of mid-treatment imaging metric changes with recurrence-free survival
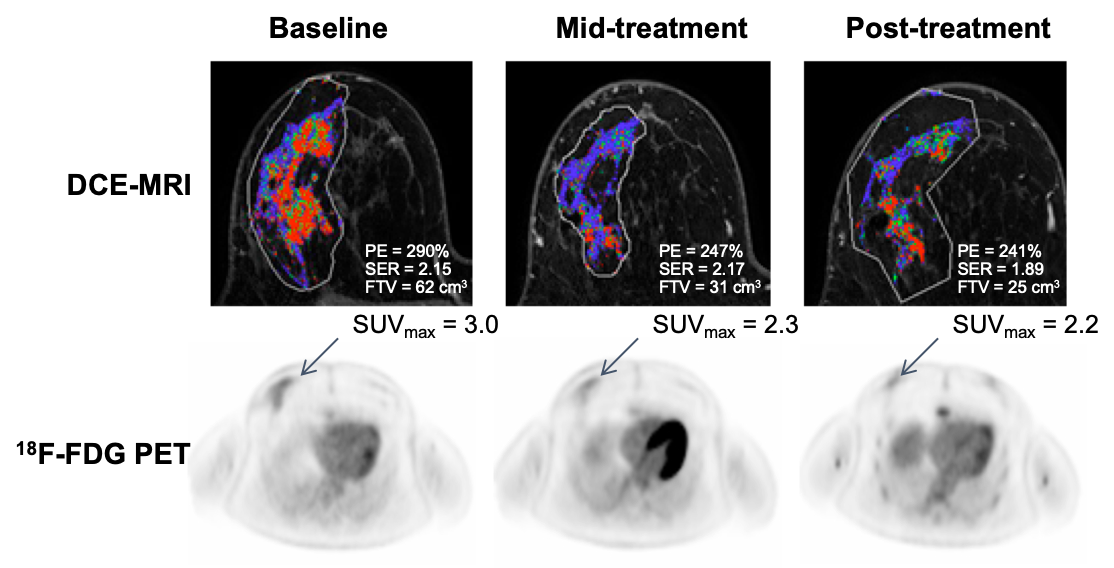
Figure 1. Serial DCE-MRI and 18F-FDG PET image examples for a patient with Luminal B cancer with >9 cm residual disease (non-pCR). Both MRI and PET measures showed little change over the course of treatment.
DOI: https://doi.org/10.58530/2023/0129