0126
Magnetic Resonance Elastography reveals effects of immunotherapy on glioma biomechanics1Department of Neuroradiology, Heidelberg University Hospital, Heidelberg, Germany, 2Clinical Cooperation Unit Neuroimmunology and Brain Tumor Immunology, German Cancer Consortium (DTK) within the German Cancer Research Center (DKFZ), Heidelberg, Germany, 3Faculty of Biosciences, Heidelberg University, Heidelberg, Germany, 4Clinical Cooperation Unit Neurooncology, German Cancer Consortium (DTK) within the German Cancer Research Center (DKFZ), Heidelberg, Germany, 5Department of Neurology, Heidelberg University Hospital, Heidelberg, Germany, 6INSERM UMRS1148 - Laboratory for Vascular Translational Science, University Paris, Paris, France, 7School of Biomedical Engineering and Imaging Sciences, King’s College London, London, United Kingdom, 8Richard Dimbleby Laboratory of Cancer Research, School of Cancer & Pharmaceutical Sciences, King’s College London, London, United Kingdom, 9School of Biomedical Engineering, Science and Health Systems, Drexel University, Philadelphia, PA, United States, 10Department of Neurology, University Medical Center Mannheim, Heidelberg University, Mannheim, Germany
Synopsis
Keywords: Elastography, Neuro
MRI and MRE were used to monitor the effects of immunotherapy on tumor volume, FA and biomechanics of murine orthotopic glioma. Treated tumors were significantly smaller, softer and had lower FA than controls. This difference was most pronounced when comparing tumor stiffness of both groups. Controls revealed heterogeneous tumor stiffness. We hypothesize that this is caused by viable tumor cells alternated with necrotic areas and presumably immune-suppressive iba1-positive cells. In contrast, biomechanical properties of treated animals correlated better with presence of macrophages/microglia and likely reflected anti-tumorigenic inflammation. Thus, MRE could prove useful for monitoring glioma response to therapy.Introduction
Glioblastoma is the most common primary malignant brain tumor exhibiting poor prognosis despite standardized therapy. Recently, immunotherapies have been introduced to raise anti-tumor immune responses to improve outcome1. Most of these therapies target immuno-suppressive pathways, ultimately aiming at an activation of T-cells or shifting macrophages towards proinflammatory states2. MRI is the most important paraclinical tool to monitor therapy response, but it has shortcomings in differentiating tumor progression from therapy-associated phenomena3. This study investigates the effects of myeloid-targeted immunotherapy with CDNP-R848 (nanoparticle-caged resiquimod)4 on biomechanical properties in a pre-clinical glioma model and introduces Magnetic Resonance Elastography (MRE) for tumor monitoring and response assessment.Methods
GL261 glioma cells were orthotopically implanted into the right striatum of 10 female C57BL/6 mice. Five animals received three doses of 100µl CDNP-R848 i.v. on days 14, 17 and 20 after surgery as immunotherapeutic treatment4. The other five animals received the cyclodextrin nanoparticle cage (CDNP) as vehicle controls.Imaging was performed 12, 19 and 26 days after tumor implantation on a 9.4 T small animal MRI scanner and included T2-weighted (T2w) imaging, Diffusion Tensor Imaging (DTI) and MRE (900 Hz vibration frequency). After the last imaging time point, animals received an i.v. injection of 10mg CD31-AF647 as an intravital dye to stain the vasculature. Subsequently, animals were euthanized, brains were harvested and optically cleared following the iDISCO5 protocol including iba1-staining for macrophages/microglia. Whole brains were imaged on a light sheet microscope (LSM; 1.46 µm x 1.46 µm in-plane, z-stack with 6 µm step size).
Image analyses comprised coregistration of MRI, MRE and LSM data. Tumors were manually segmented on T2w images and iba1-positive myeloid cell-containing regions on LSM. Tumor volume was assessed and the magnitude of the complex valued shear modulus |G*| (termed “stiffness” in the following) as well as fractional anisotropy (FA) were evaluated within the tumor and the LSM-defined regions of interest (ROI).
Results
Tumor volume increased in the controls, while CDNP-R848 resulted in full tumor control (Fig. 1). Tumor stiffness remained stable within the controls, while it significantly decreased in CDNP-R848 treated animals upon therapy induction (week 3; Fig. 1). Moreover, at this timepoint (week 3), significant differences in |G*| were observed between the groups with the CDNP-R848 treated animals having softer tumors than the controls (mean |G*| at week 3 3.94 kPa vs. 5.87 kPa, p<0.0001; Fig. 1). FA was also lower in CDNP-R848 treated animals than in controls at week 3 (0.14 vs 0.18 p=0.0004, Fig. 1).Heterogeneity of tumor stiffness was visible on elastograms of controls at week 4 (Fig. 2), displaying alternating softer and stiffer tumor subregions. This is reflected in the histogram plots showing distribution frequencies of |G*| within the tumor ROIs (Fig. 2). At week 3, |G*| distribution presented as a single peak for both controls and treated animals, whereas in week 4, only the vehicle-treated animals developed a double peak (highest frequencies at 1.97 kPa and 5.33 kPa, respectively), corresponding to the visually perceivable stiffer and softer tumor subregions.
To further investigate the underlying mechanisms, LSM data was analysed alongside T2w and MRE. Analysis of CD31-positive areas showed that pathologic tumor vessels were homogenously distributed within the tumors of both groups and did not match stiffness patterns. Areas with iba1-positive myeloid cells differed between the groups: while treated animals had homogeneously distributed macrophages/microglia within or around the tumor, these cells were distributed in patches mainly around and partially within the tumor in controls. Moreover, iba1-positive areas tended to be softer than the entire tumor and correlated with areas of lower |G*| within the tumor tissue (Fig. 3, 4). This seemed to be especially the case in CDNP-R848 treated animals (Fig. 3, 4), indicating that the drop of |G*| is likely caused by myeloid-mediated inflammation and not tumor growth.
Discussion
CDNP-R848 induced tumor control, while also impacting the tumor’s overall biomechanical properties and microenvironment. The inflammation caused by the stimulated macrophages/microglia4 seemed to directly influence tumor stiffness. Even though tumor volume and FA also differed between groups during immunotherapy, the effect was most pronounced in |G*|.The tumor vasculature did not seem to contribute to stiffness changes as the homogeneous distribution did not match the observed heterogeneity of tumor stiffness. In controls, iba1-positive areas did not match the heterogeneity patterns found in |G*|-elastograms. Therefore, this seems to be additionally caused by the growth pattern with necrotic and hemorrhagic areas alternating with regions of viable tumor cells. In contrast, tumor stiffness of treated animals correlated better with presence of macrophages/microglia. For example, some treated animals presented with a soft area that exceeded the volume of residual tumor determined on T2w-images but correlated with a rim of macrophages/microglia around the residuum. In summary, we hypothesize that inflammation caused by a CDNP-R848 mediated shift of macrophages/microglia in pro-inflammatory state is reflected by a significant decrease in tumor stiffness. This seemed to outmatch effects of tumor growth on tumor biomechanics.
Conclusion
MRE is capable of detecting biomechanical changes in gliomas, which are linked to inflammation due to immunotherapy and tumor growth. Thus, MRE could prove useful for monitoring glioma response to immunotherapy.Acknowledgements
No acknowledgement found.References
1. Platten, M. & Reardon, D. A. Concepts for Immunotherapies in Gliomas. Semin. Neurol. 38, 62–72 (2018).
2. Franson, A. et al. Development of immunotherapy for high-grade gliomas: Overcoming the immunosuppressive tumor microenvironment. Front. Med. 9, (2022).
3. Ellingson, B. M., Chung, C., Pope, W. B., Boxerman, J. L. & Kaufmann, T. J. Pseudoprogression, radionecrosis, inflammation or true tumor progression? challenges associated with glioblastoma response assessment in an evolving therapeutic landscape. J. Neurooncol. 134, 495–504 (2017).
4. Rodell, C. B. et al. TLR7/8-agonist-loaded nanoparticles promote the polarization of tumour-associated macrophages to enhance cancer immunotherapy. Nat. Biomed. Eng. 2, 578–588 (2018).
5. Renier, N. et al. iDISCO: A Simple, Rapid Method to Immunolabel Large Tissue Samples for Volume Imaging. Cell 159, 896–910 (2014).
Figures
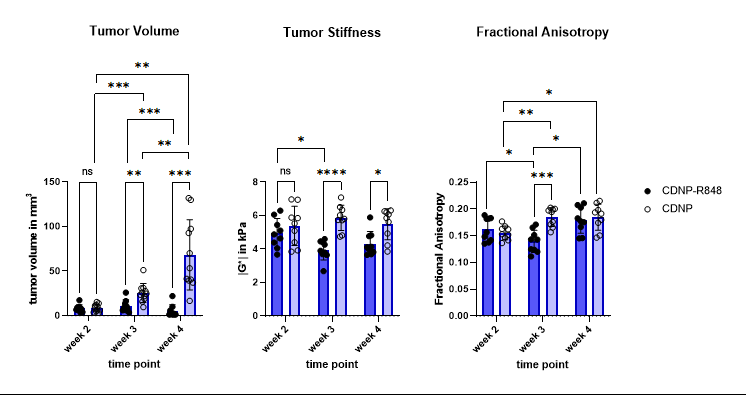
Figure 1. Mean values for tumor volume (mm3, left), tumor stiffness (kPa, middle) and FA (au, right). Volume of untreated tumors progressively increased, while it was controlled in treated animals. In treated animals, |G*| significantly decreased leading to a pronounced difference compared to untreated glioma at week 3 during therapy. FA and tumor volume also differentiated treated and untreated animals at week 3, however to a lesser extent. Stiffness differences between groups remained after completion of therapy at week 4, while mean FA values were comparable at this time point.
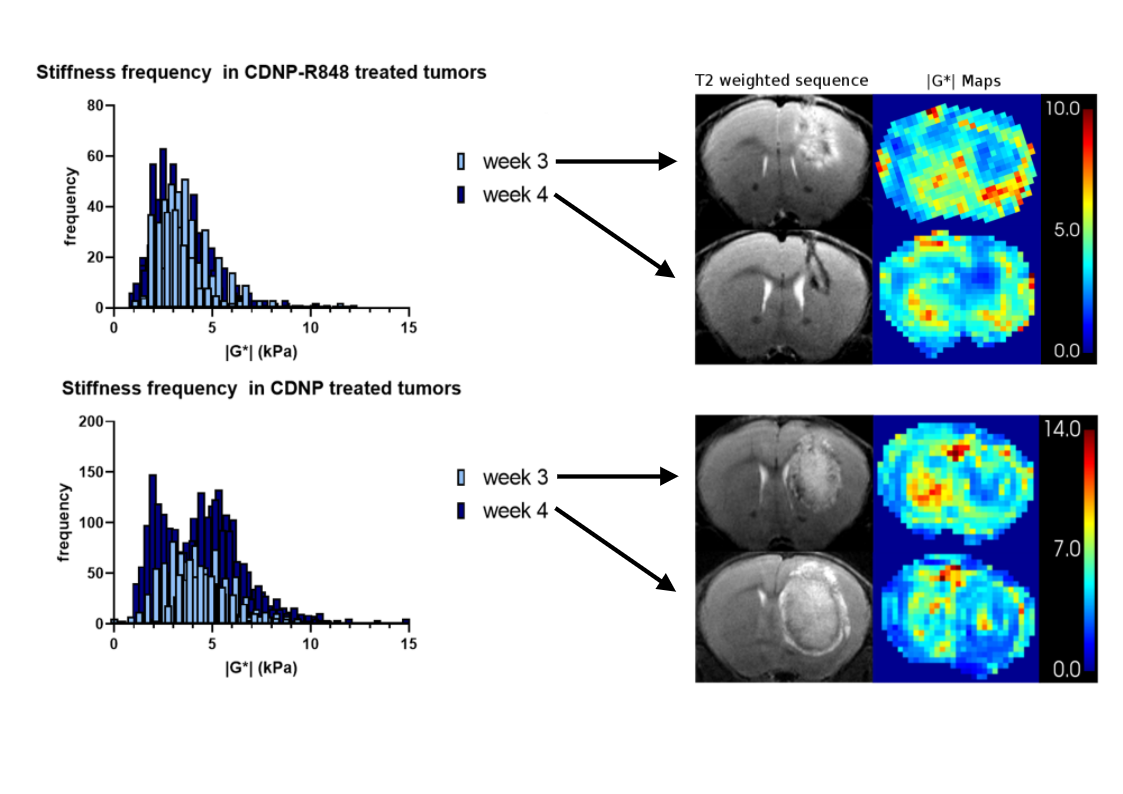
Figure 2. Plotted histograms displaying frequency distribution of tumoral |G*| for all treated animals (top) and all controls (bottom). Exemplary T2w and |G*| elastograms are shown on the right for each time point. Elastograms of treated animals reflect a rather homogeneous tumor softening, reflected in a singular frequency peak in the histogram (top). In contrast, stiffness of untreated tumors became heterogenous with alternating stiff and soft regions, which led to a double peak of frequency distribution at week 4 (bottom).
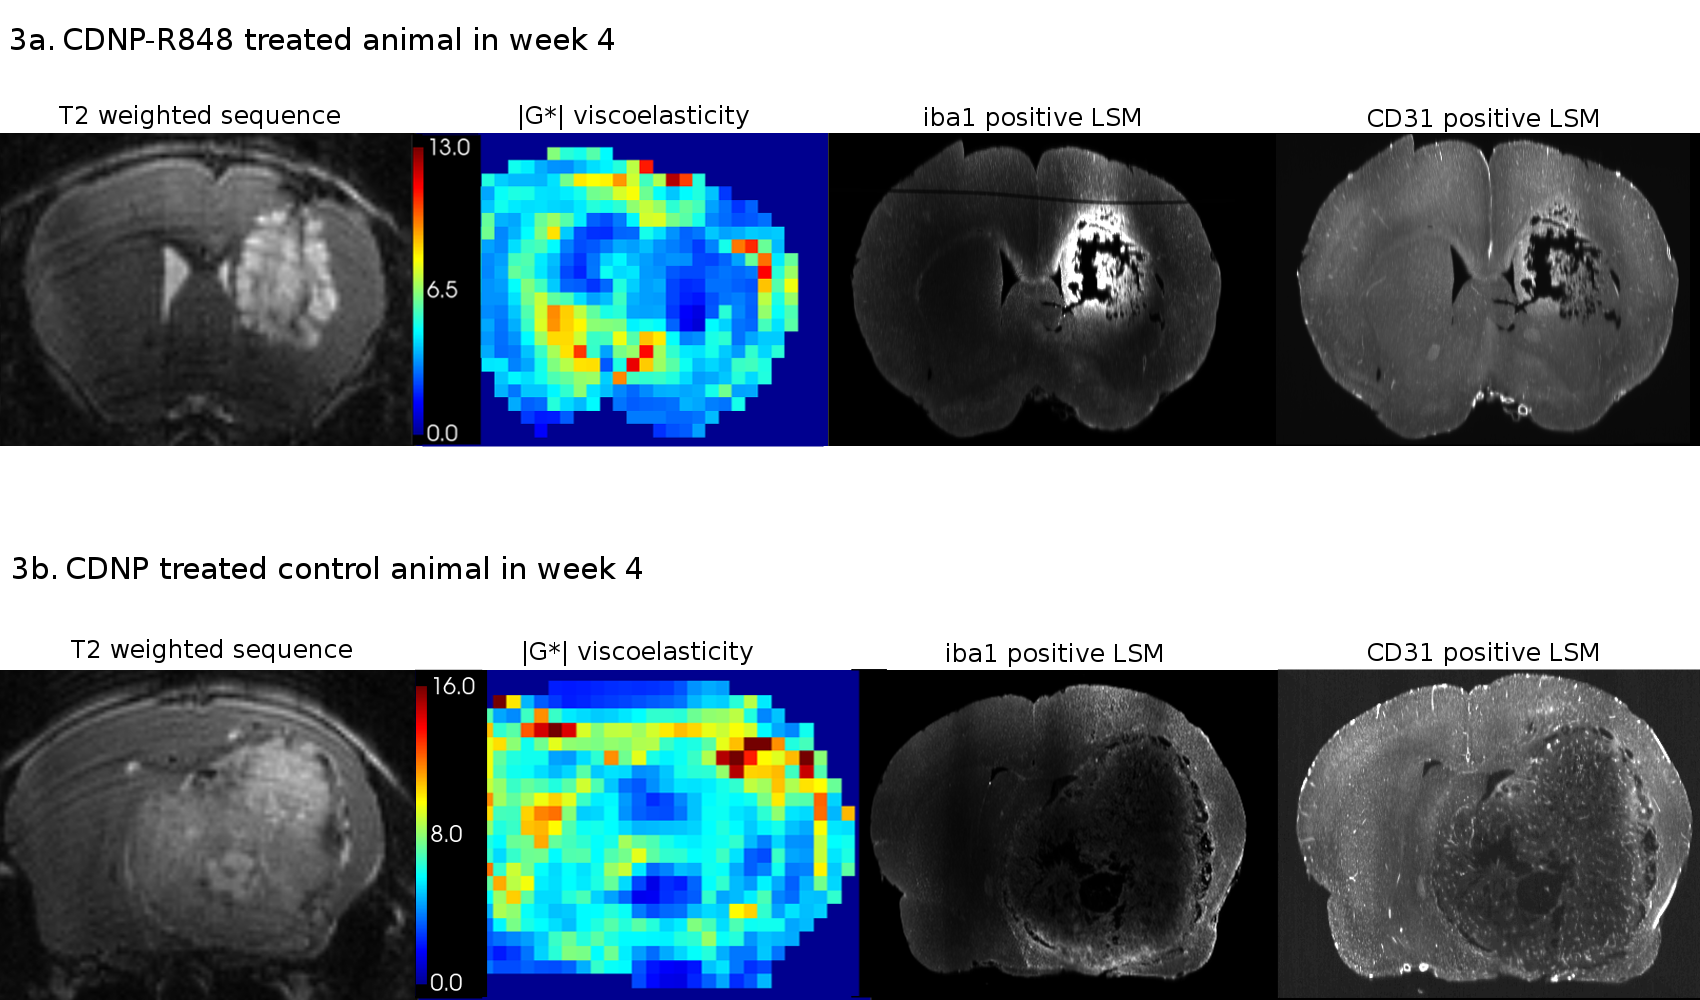
Figure 3. Image series of a representative animal of each group at week 4 including T2w images, stiffness maps and corresponding LSM data of iba1 (macrophages/microglia) and CD31 (vasculature). In treated animals (3a), iba1-positive areas correlate with areas of low |G*|. Tumor stiffness in untreated controls (3b) does not uniformly correlate with iba1-positivity and is likely also influenced by other components, e.g., necrosis or viable tumor cells. CD31-positive tumor vasculature shows no spatial correspondence with tumor stiffness.
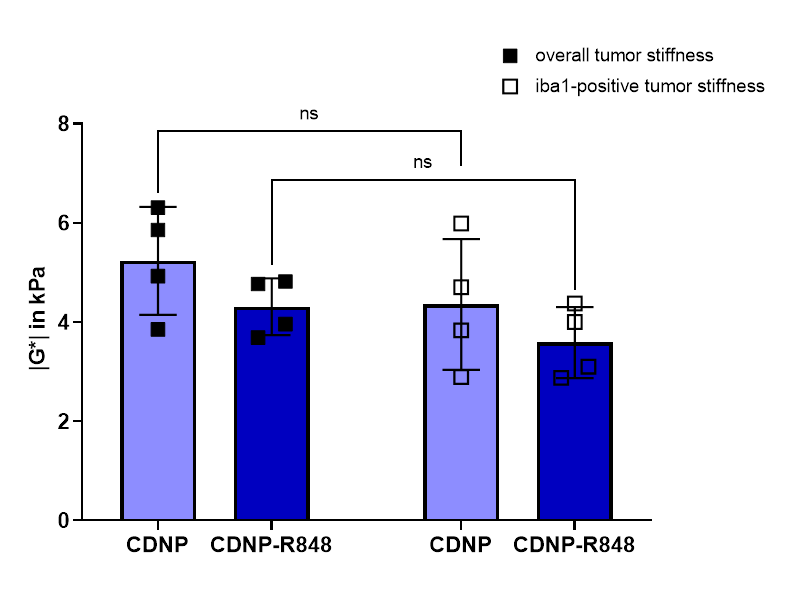
Figure 4. Stiffness |G*| of the total tumor volume (black squares) was compared to tumor subregions with accumulation of iba1-positive cells (white squares). Within individual animals, overall tumor stiffness was higher than in subregions containing macrophages/microglia. Even though no significant differences could be observed in a group-wise comparison, these areas seem to contribute to tumor softening.