0123
Characterization of the R2*/R2 ratio of the BOLD laminar-specificity through biophysical simulations using realistic vascular architectures1Department of Radiology, Center for Image Sciences, UMC Utrecht, Utrecht, Netherlands, 2C.J. Gorter MRI Center, LUMC, Leiden, Netherlands
Synopsis
Keywords: Signal Modeling, fMRI
GE-BOLD fMRI is the most used technique to measure functional hyperemia across cortical depth. GE-BOLD is sensitive towards all vascular contributions, while SE-BOLD increases the specificity towards small vessels– being more specific to neuronal activity. However, SE-BOLD fMRI measurements may not completely remove the macrovascular contribution. Using realistic vascular models, we simulated specific oxygenation states in different vascular compartments to characterize the GE-and SE-BOLD specificity across cortical depth quantified through the R2*/R2-ratio. Simulations show 1)similar ratio values at deeper layers indicating comparable specificity to microvessels for both sequences, 2)layer-fMRI SE-BOLD cannot completely eliminate the macrovascular contribution towards the pial surface.Introduction
Gradient-echo (GE)-BOLD is the most commonly used technique to measure brain activation across cortical depth, so-called laminar fMRI – localized changes of cortical hemodynamic responses due to neuronal activity [1]. Nevertheless, GE-BOLD is sensitive to both macro- and micro-vessels, which impacts the specificity to the underlying neuronal activity especially towards the pial surface [2,3]. Computational simulations based on random cylinder models have shown that spin-echo (SE)-BOLD can minimize the macrovascular contribution [4,5]. Hence, SE-BOLD increases the specificity towards microvessels – being more specific to neuronal activity. However, SE-BOLD fMRI measurements may not completely remove the macrovascular contribution – macrovessels may still influence the detected BOLD signal, especially near the pial surface. Therefore, it is necessary to investigate the GE-BOLD and SE-BOLD signal formation using computational simulations based on realistic cortical angioarchitectures [7]. In this work, we used realistic vascular models to simulate specific oxygenation states and biophysical interactions to characterize the laminar specificity of GE and SE across cortical depth- quantified by means of the R2*/R2 ratio. This sort of simulations might help to clarify the vascular contribution to the BOLD signal at submillimeter acquisitions.Methods
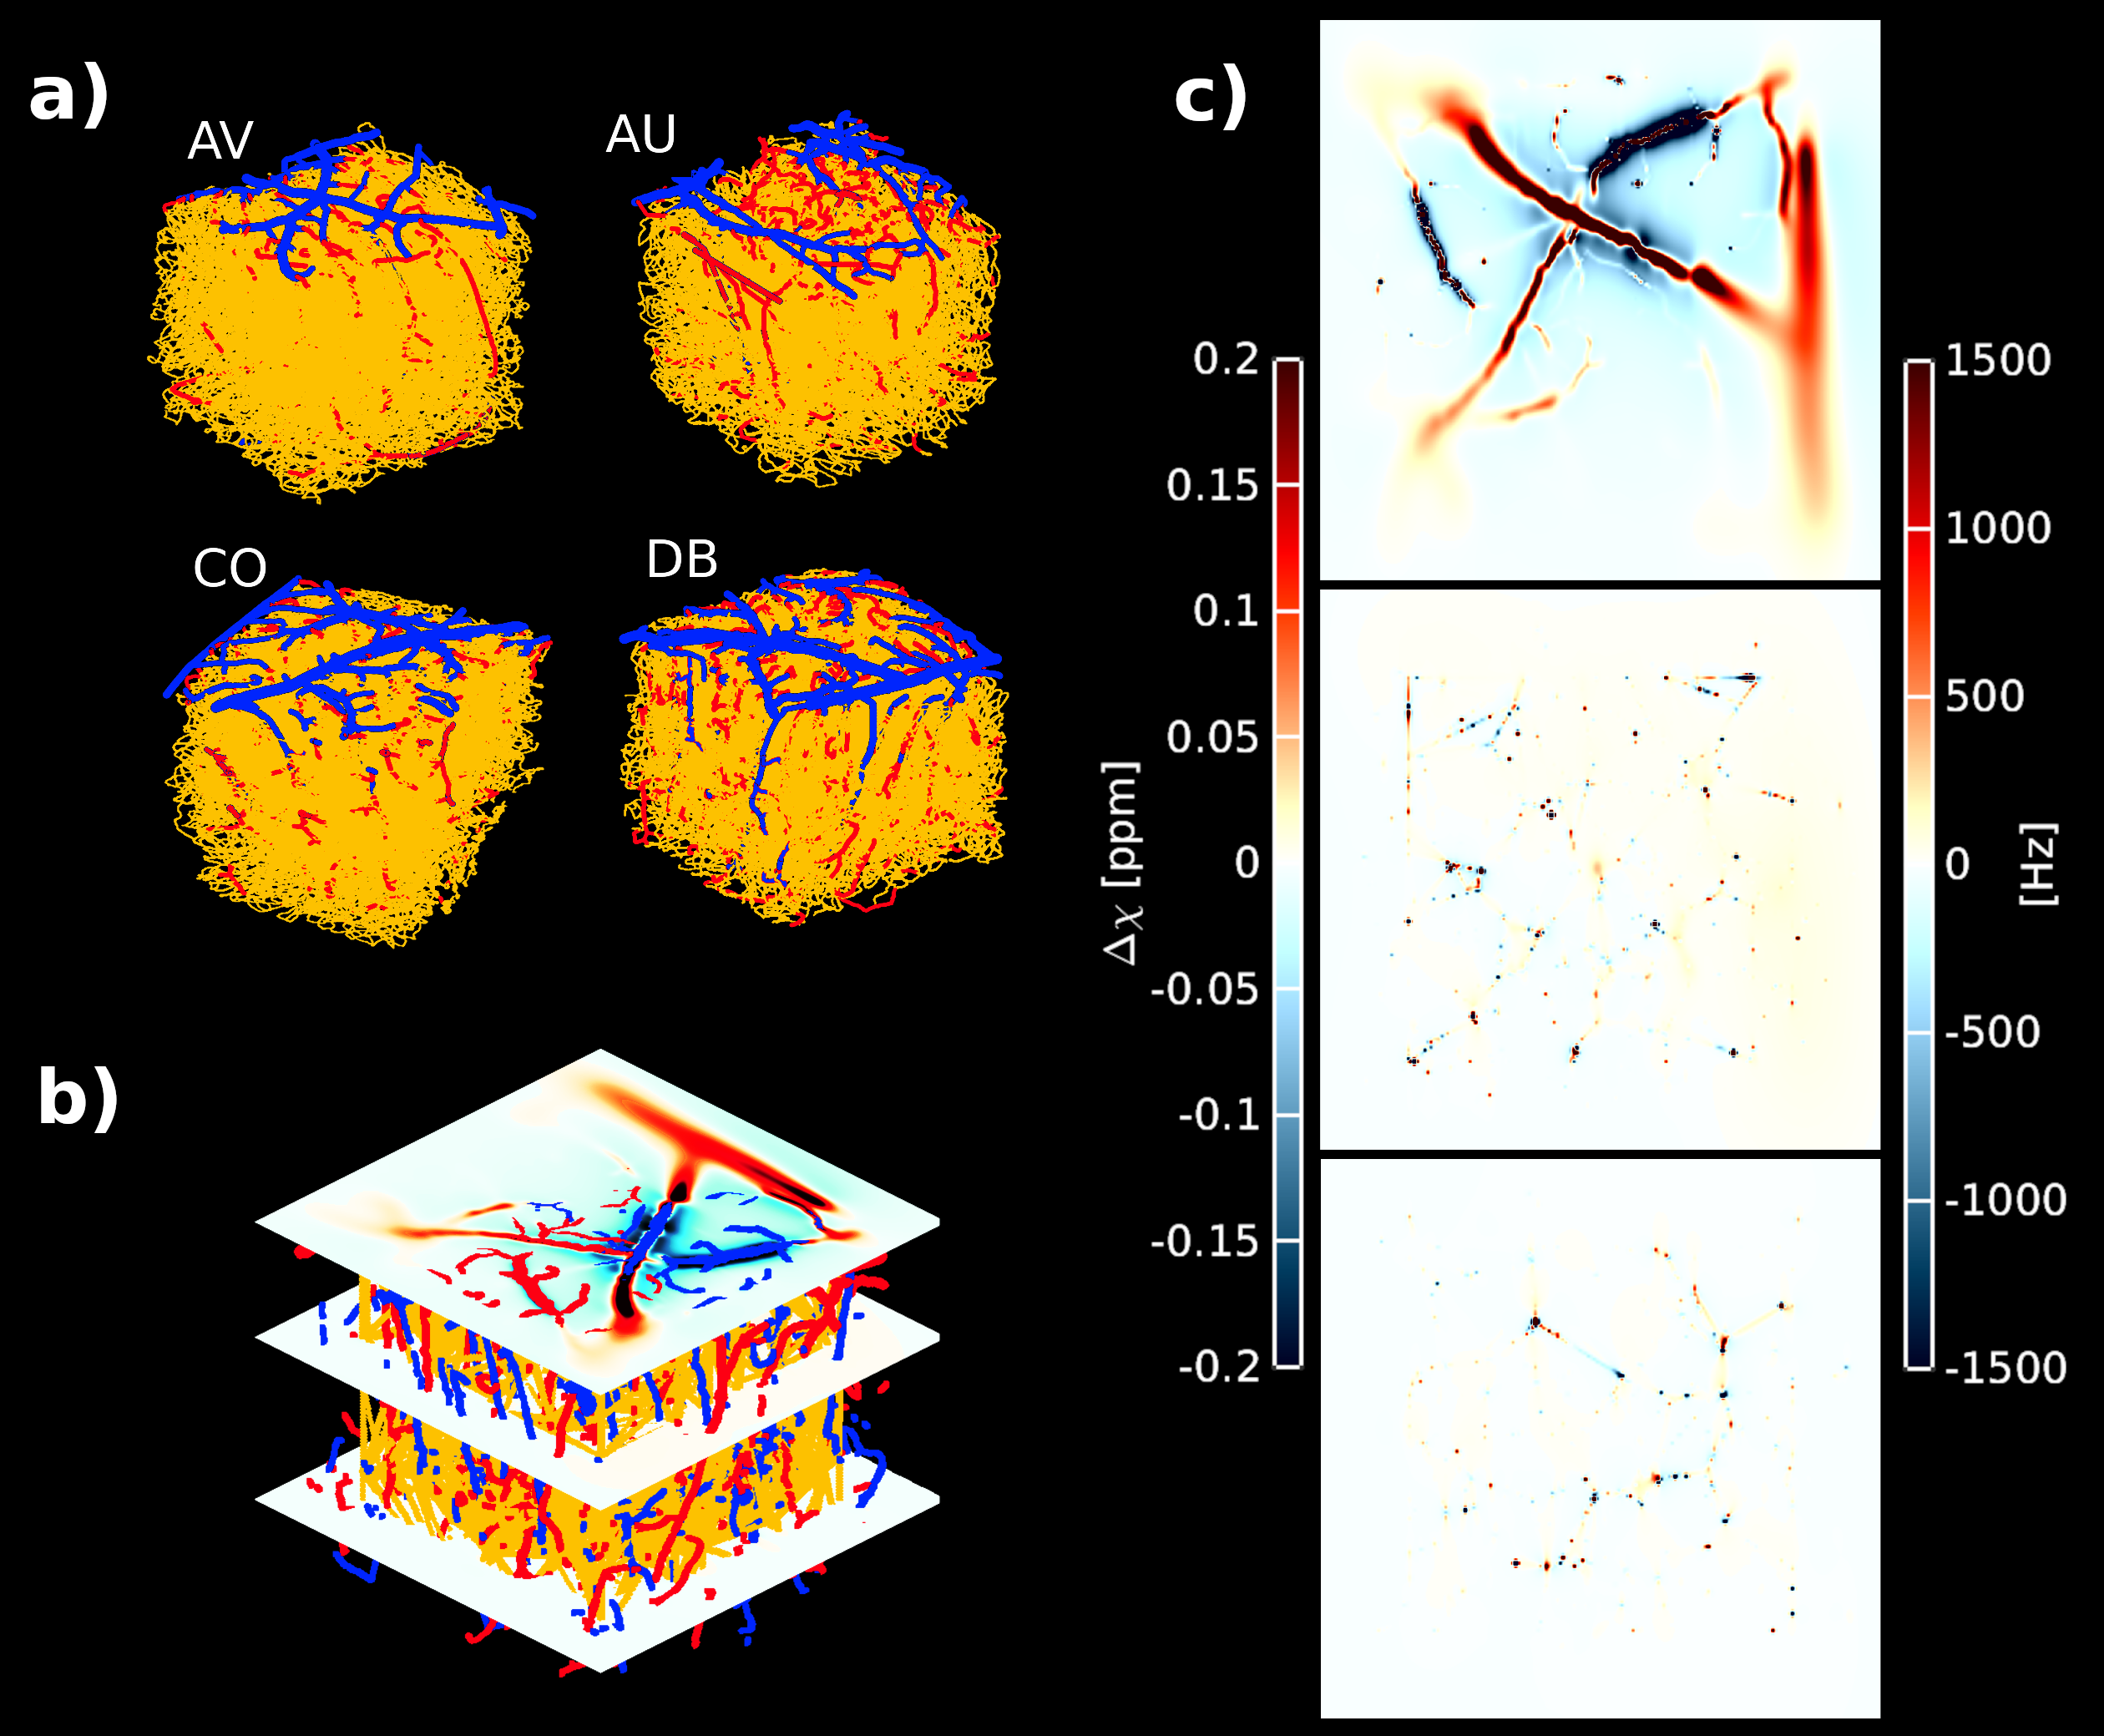
We used four vascular architectures from the parietal cortex of mice obtained with two-photon microscopy [9]. Using an in-house MATLAB script, we extracted a vascular graph representation that permits quantifying vascular properties such as vessel radius, length, and tortuosity. We labeled each vessel strand according to these vascular characteristics. Our models preserve a 3/1 artery/vein ratio as expected in the human cortex [8]. The resulting vascular model comprises a three-compartment model - arteries and veins (both macrovessels), and capillaries (microvessels). We simulated different oxygenation levels per vascular compartment as follows: SO2 in arteries SO2art = 98%; capillaries [SO2art – ((SO2art - SO2vein)/2)]; and veins S02vein = [98%,90%,80%,70%,60%,50%]]. To compute the inhomogeneous magnetic field, we simulate the dipolar response of a finite cylinder (vessel) at 7T for all vascular compartments [7]. The inhomogeneous magnetic field was computed according to ∆B0(r)=1⁄2∙2πγ∙∆χ(t)∙B0∙(r2/d2)∙cos(2θ)∙sin2(φ) [7]. Monte Carlo simulations were used to simulate spin dephasing due to diffusion (D=1μm2/mm) through the inhomogeneous magnetic field produced due to the susceptibility distribution of deoxyhemoglobin content in the vasculature. Assuming mono-exponential decay, we computed the extravascular GE-BOLD (TE=21ms) and SE-BOLD (TE=45ms) signal evolution at different oxygenation states. Intravascular contribution to the BOLD signal was assumed minimal for 7T. R2*/R2 ratio was computed as R2*=(-log(φGE)/TEGE) and R2=(-log(φSE)/TESE), where φ is the total spin dephasing accumulation over the TE, respectively [10]. Note that the intrinsic T2 of the tissue was neglected and computations only assumed R2’ dependence on pulse sequence. In order to quantify the global dephasing effect of GE and SE, Monte Carlo simulations were performed at voxel level (1mm3) for different oxygenation states. Then, layer-specificity of the R2*/R2 ratio was calculated using Monte Carlo simulations for each cortical layer. Nine cortical layers were defined equidistantly between GM/CSF and WM/GM boundaries – these layers do not represent histological or vascular features.Results
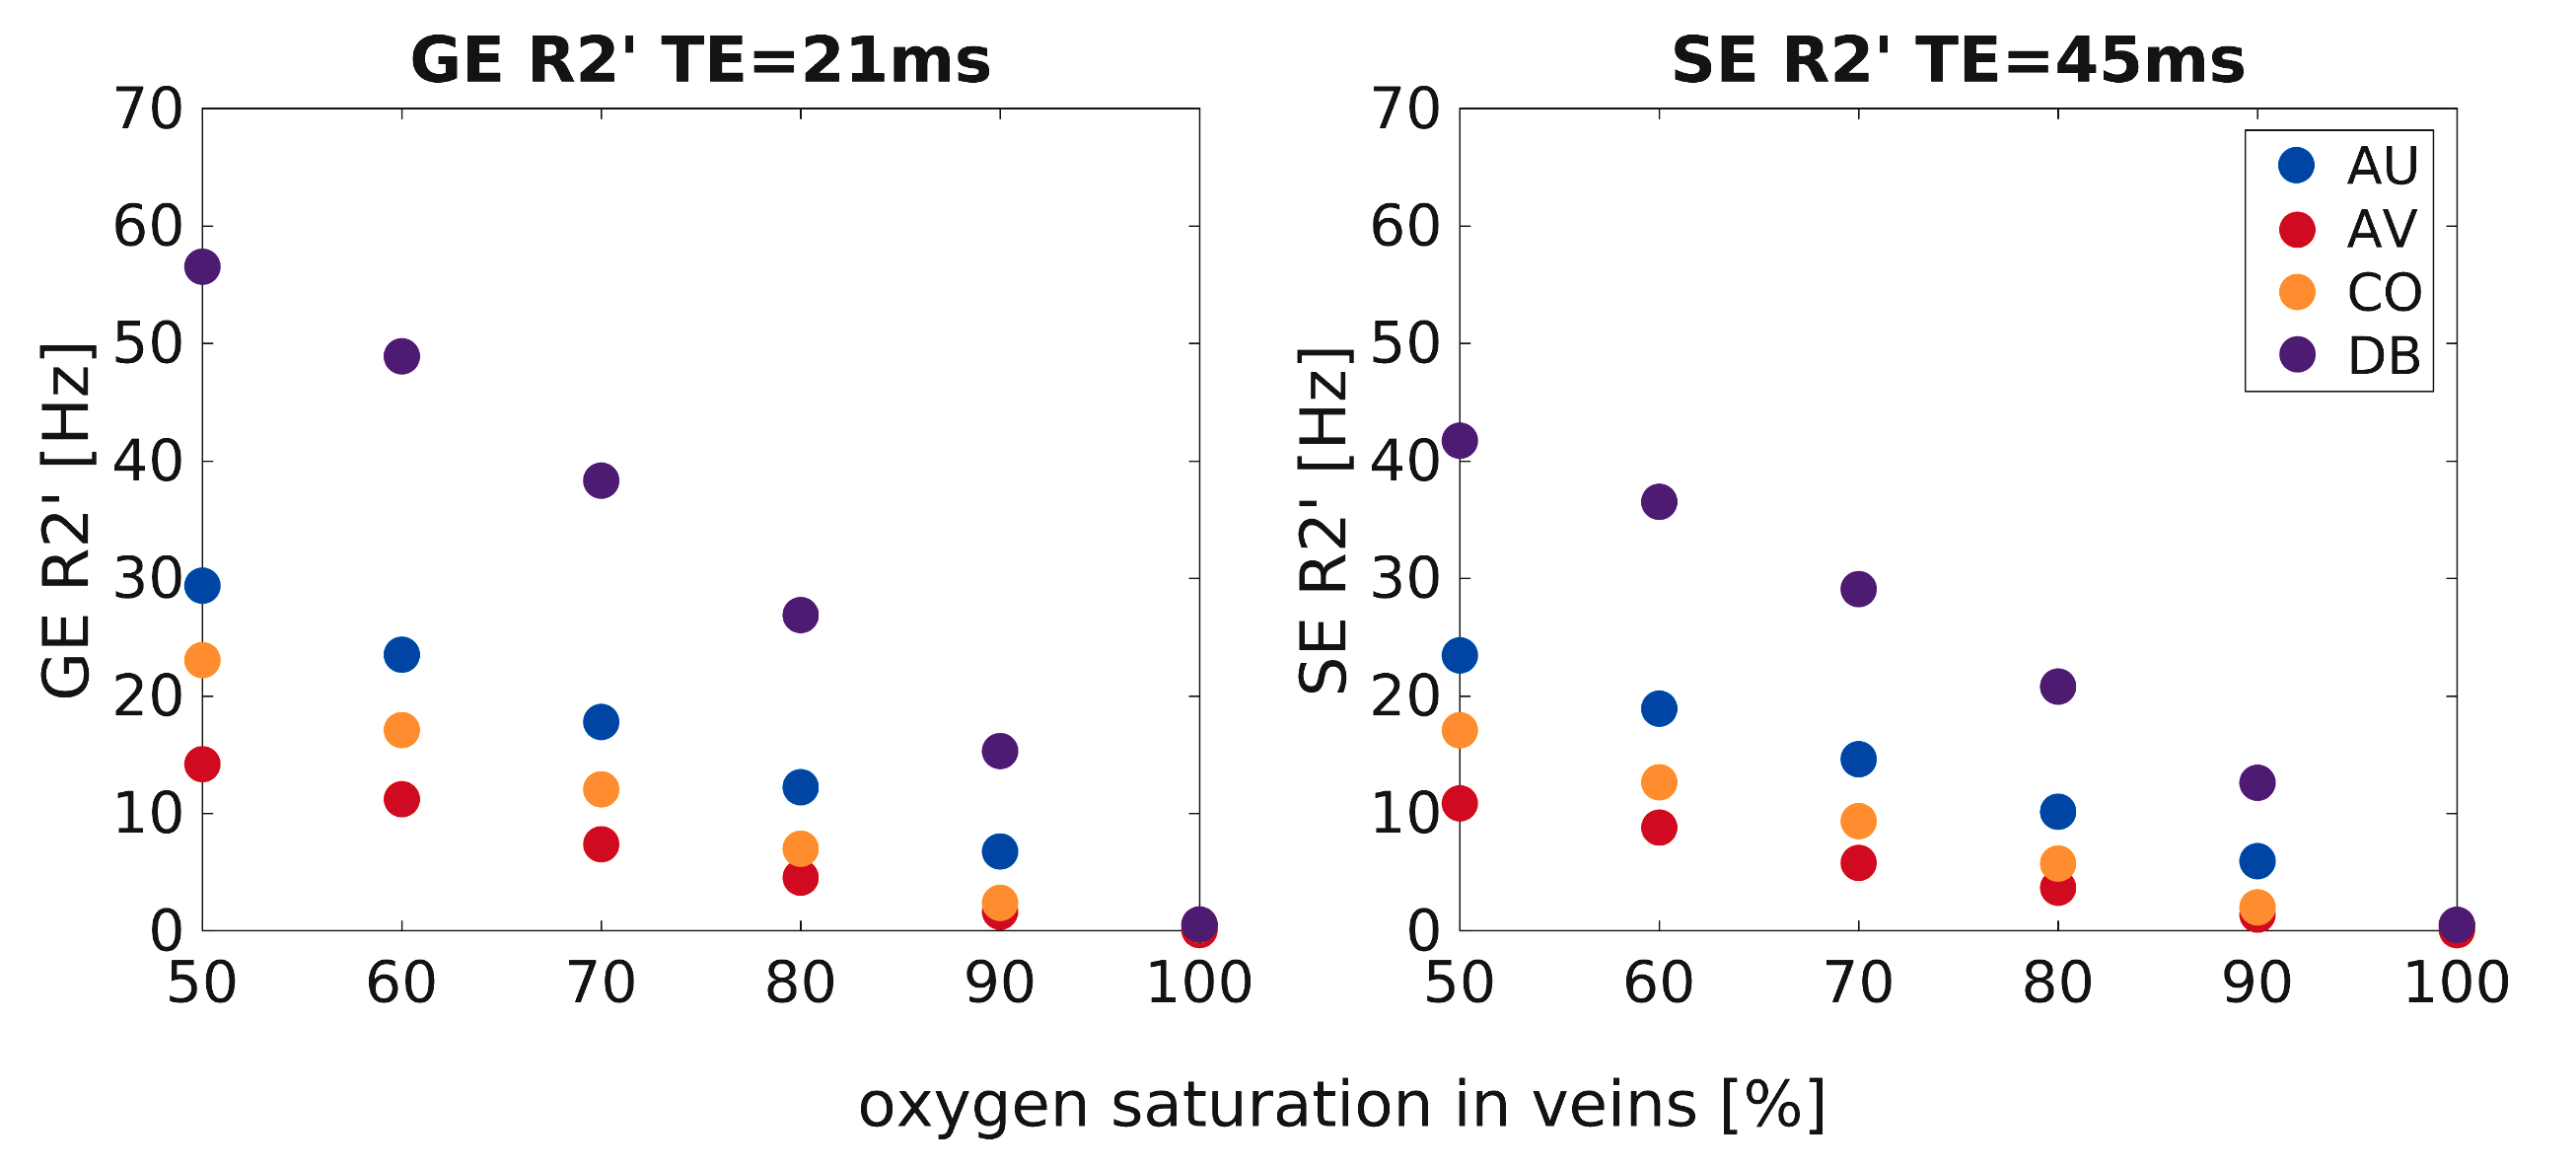
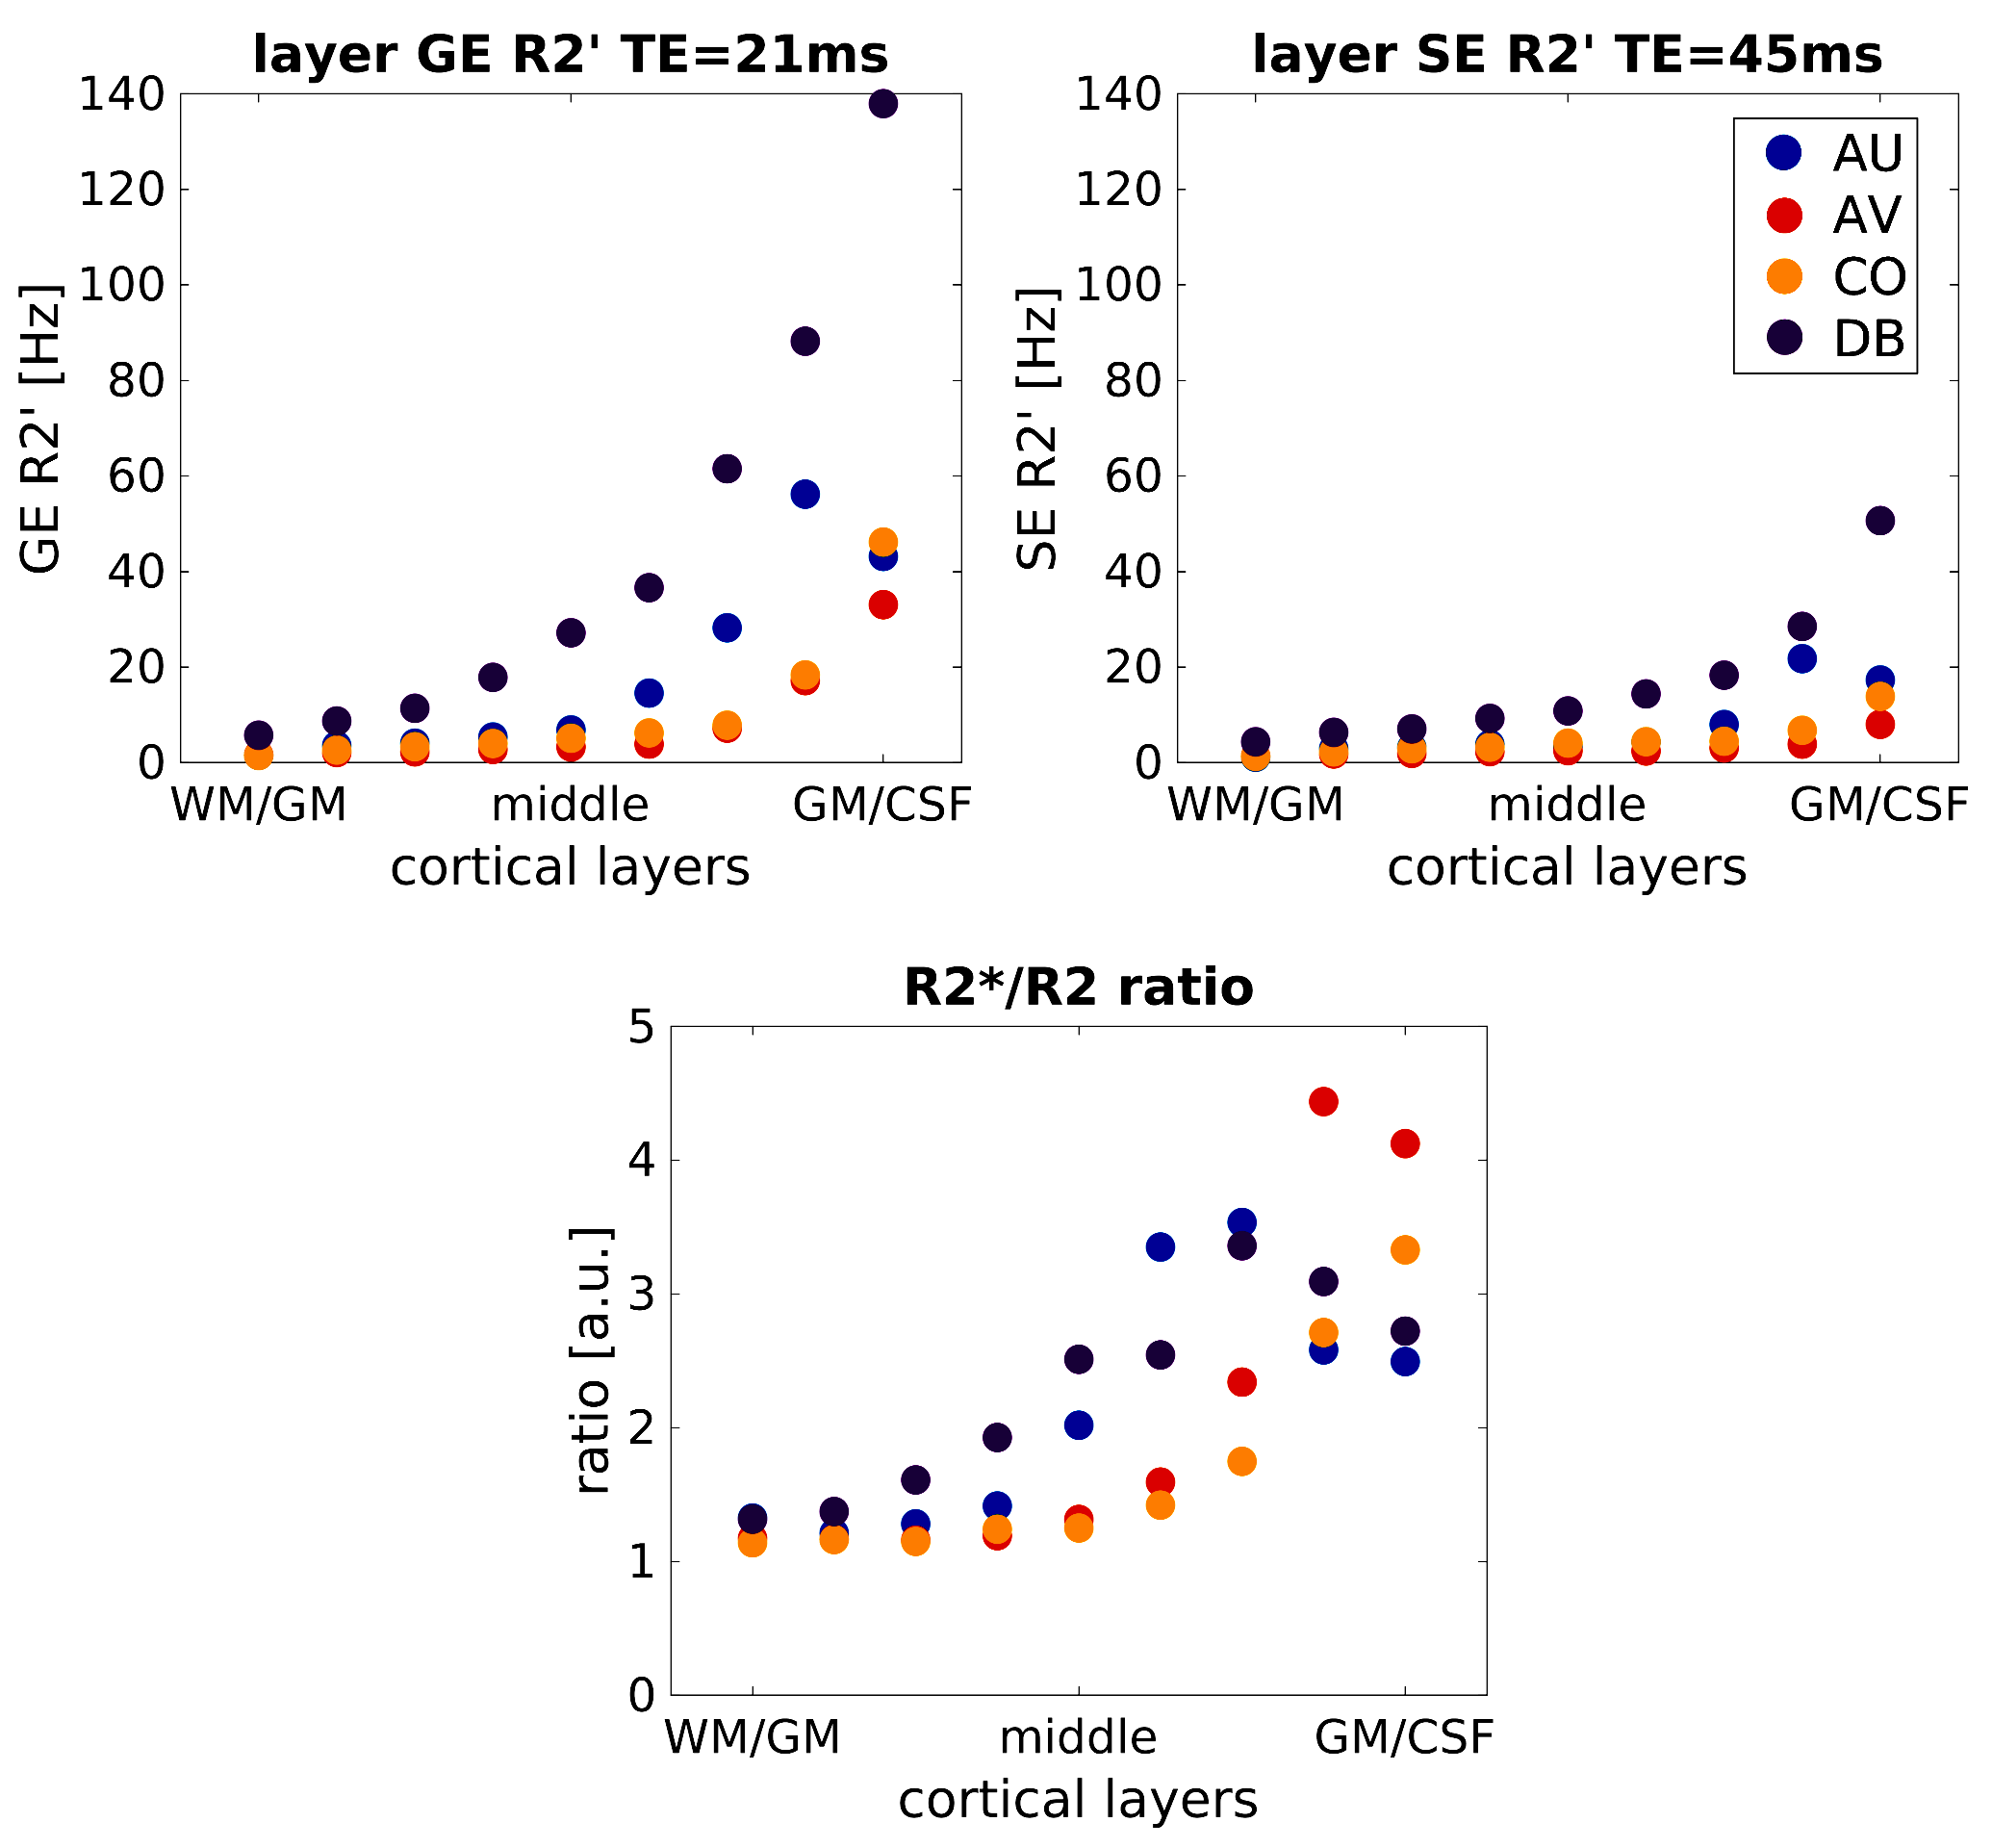
Figure 1 shows the inhomogeneous magnetic field produced by a representative realistic vascular model for an exemplary oxygenation state (SO2vein = 70%). Near the cortical surface (top plane), the influence of the macrovasculature largely contributes to the inhomogeneity of the magnetic field. In contrast, the vascular content at the middle and bottom planes consists mostly of capillaries, which slightly modifies the homogeneity of the magnetic field. Figure 2 displays the global dephasing behavior at voxel level of the four vascular models for different oxygenation states. GE R2’ shows a larger effect as compared to SE R2’. Each vascular model presents the same linearity to increased oxygenation states. Differences in R2’ between the four vascular models result from variations in vascular morphology and topology (Figure1a). Figure 3 shows the relation of the dephasing effect for both GE and SE across cortical depth for a representative oxygenation state (SO2vein = 70%). GE R2’ is higher near the GM/CSF boundary as compared to the deeper layers. SE R2’ presents the same behavior but damped by the refocusing pulse; however, the refocusing does not entirely remove the contribution of large vessels at the GM/CSF boundary. Moreover, the R2*/R2 ratio is relatively similar between layers for the deeper layers, on the order of~1-2. Near the cortical surface and upper layers, this ratio is on the order of ~3 to 5. This ratio depends on the vascular topology and features of the vessels.Discussion/Conclusion
Our simulations show similar R2*/R2 ratio values at deeper layers, but larger ones near the cortical surface, indicating similar specificity to microvessels for GE and SE at deeper layers. However, the SE R2’ also increased toward the pial surface suggesting that SE-BOLD cannot completely eliminate the macrovascular component in contrast to simulations using non-realistic vascular models. Further, although vascular compartments are preserved across the four vascular models, vascular topology differences particularly for the macrovasculature induce differences to the computed R2’ effects. Additionally, the computed ratios can be used as a surrogate to filter macrovascular contributions in fMRI measurements. Thus, using realistic vascular models improves our understanding of the relation between angioarchitecture and biophysical effects on BOLD signal formation.Acknowledgements
This work was supported by the NIMH NIH under award number R01MH111417 and TTW-ZonMW-SGF-LHS Human Measurement models grant # 18969-Virtual Cerebrovascular Responses.References
1. Ogawa, S. et al. Functional brain mapping by blood oxygenation level-dependent contrast magnetic resonance imaging. A comparison of signal characteristics with a biophysical model. Biophys. J. 1993; 64:803–812 2. Kiselev V.G., Posse S. Analytical model of susceptibility-induced MR signal dephasing: effect of diffusion in a microvascular network. Magn Reson Med 1999; 41:499-509 3. Han S. et al. Improved laminar specificity and sensitivity by combining SE and GE BOLD signals. Neuroimage 2022; 264: 119675. 4. Weisskoff, R., et al. Microscopic susceptibility variation and transverse relaxation: Theory and experiment. Magn. Reson. Med 1994; 31:601–610 5. Uludag K. et al. An integrative model for neuronal activity-induced signal changes for gradient and spin echo functional imaging. Neuroimage 2009; 48:150-165 6. Schellekens W et al. The many layers of BOLD. The effect of hypercapnic and hyperoxic stimuli on macro- and micro-vascular compartments quantified by CVR, M, and CBV across cortical depth. Journal of Cerebral Blood Flow & Metabolism. 2022;0(0). 7. Báez-Yáñez M.G. et al. A statistical 3D model of the human cortical vasculature to compute the hemodynamic fingerprint of the BOLD fMRI signal. bioRxiv 2020.10.05.326512 8. Duvernoy, H.M. et al. Cortical blood vessels of the human brain. Brain Res. Bull. 1981; 7:519–579 9. Blinder et al. The cortical angiome: an interconnected vascular network with non-columnar patterns of blood flow. Nat Neurosci. 2013;16(7):889-97. 10. Boxerman, et al. MR contrast due to intravascular magnetic susceptibility perturbations. Magn Reson Med 1995; 34(4):555-66.
Figures